USDCAD another opportunity to go shortI marked with Yellow rectangles GAP from daily intervals and with circle very nice rejection and pull back after GAP acted as nice support area.
It is pending order and I'm waiting for pair to go higher so the trade will have good risk/reward ration.
Current price gives us around 1.5.
Exponential Moving Average (EMA)

ETHUSD 1H 50 EMA TradesWhen price stays above the 50 ema that indicates a bullish continuation trend.
When price pulls back to the 50 ema and bounces long is an entry point.

Possible bullish momentum- Price is currently moving in an triangle
- The ascending (triangle) trendline is being supported by a round number and Fib retr.
EMA‘s might indicate a bearish movement in the future but the bullish supporting criteria is is strong - EMA‘s could end up losing it‘s force

CAD/CHF SHORT BASIC 123 setupBroken trendline and recent structure!
EMA 200,36, recent structure are acting as a resistance + we got nice rejection candle.
The risk on this trade is small because we are on D1/W1 structure, overall D1 formation looks promising.
It is also a hedge form GBP/JPY and GBP/CHF long.
Nothing fancy isn't it?
Looks like it will be breakeven month :) A lot of ups and downs, pretty harsh!
Talk to you soon,
Marjan
Forex Swing Traders

AUD/JPY short abc setupBroken trendline
EMA 200 acting as a S/R, horizontal S/R as well
We have also resistance trendline
Rejection candles in place

STR/BTC crossing EMA50 on hourly chart STR/BTC crossing EMA50 in hourly chart and at the same time MFI crosses above 40 ... is it a new pump and dump.
Brain storming ... please tell me your thoughts

Waiting for ETH to cross above EMA 50 and MFI crossing above 40I always wait for for the price to cross above EMA50 and at the same time it has to be supported by volume. Money flow Index (MFI) is one of the best indicators to see the flow of positive money to the market.

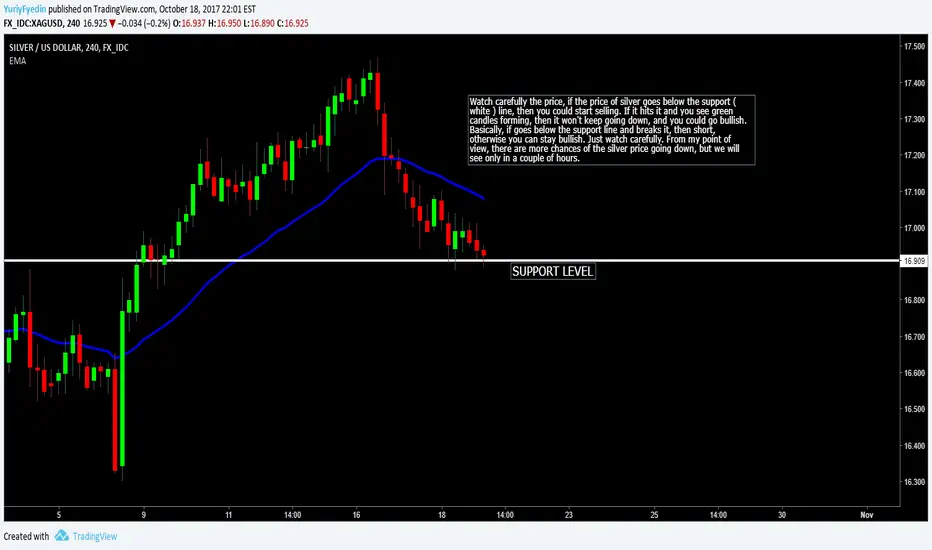
SILVER HITS SUPPORT LEVELWatch carefully the price, if the price of silver goes below the support ( white ) line, then you could start selling. If it hits it and you see green candles forming, then it won't keep going down, and you could go bullish.
Basically, if goes below the support line and breaks it, then short, otherwise you can stay bullish. Just watch carefully. From my point of view, there are more chances of the silver price going down, but we will see only in a couple of hours.
XEM about to pumpThe 4 hour closes in 3 minutes and the 10 day and 30 day EMAs are crossing. If it holds the current price, the new 4 hour candle is going to open above both EMAs as they are crossing up. There is also a bullish divergence happening with price and Stoch

Ripple short This chart shows that this coin is not much different from the rest of coins. It is correlated with most of them and follows the same trend.
I marked with yellowish rectangle nice price action with solid spike which was hold by GAP from daily chart for 3 consequential days. Pair never managed to go above this level for one full day.
Currently it is trading below psychological level 5000 which is not really respected by market but it may stop another attempt to go higher.
I would short it till 1000.

ABCD pattern after Friday's NFP EURUSD There is almost perfect ABCD patter on EURUSD 4H chart. Pair bounced from the strong support around 1.1660. Fridays NFP wasn't good for dollar as far as I can tell.
My Profit target is just below GAP which was created Sunday two weeks ago.
I marked the other GAP from the last week which rejected pair 4th of October(C).
There are three important things which should be taken in consideration.
- will open from Sunday will bring another GAP
- how the pair will act when it will meet 200ema
- how the pair will react to closest GAP
I will update this idea next week.

USDCAD another short I marked GAP from daily chart. It seems like that the pair is treating this place as a good support(we can see nice combination of 200ema and GAP).
USDCAD is still in bearish trend and I expect that the trend will continue and the lowest low may be challenged.

SAFEX worth to take a closer look Based on recent price action I think it is good idea to consider buying some of them.
We have 200 ema acting as strong support pushing pair towards north, triple bottom, GAP which may hold any drops and huge bullish candle on the Daily chart.
I marked similar formation with Yellowish rectangle which may suggest similar price action in future
I would set first TP around 750 or hold it for some time ans see what happens
I think fundamentals are very positive for this pair too.

GBGBTC Interesting price action I marked on the chart 3 GAPS based on Daily chart . Two blue ones are recent and the yellow one is older then 1 year.
First thing we can see here is how 200ema rejected pair multiple times during the last 30 days. See eclipses on the chart.
18th of September we have very strong movement and pair with ease went through 200EMA and all three GAPS.
GAPs are not very respected by market but 200 EMA seems like swapped roles and it is playing important role as a support instead of resistance.
I would wait a little bit ans see what will happen when the pair will touch the 200ema how market reacts and then make decision.
It is also good idea but slightly more risky to enter market right now with TP around 0.0000670000.
This Idea will be updated in near future

AUD/JPY Resistance-turned-Support Another one as you can see the pair is moving to retest a major level which is a good opportunity to go long..
RSI is heading south to overbought area, also .50% fibo retracement smack at the support area , and EMA 50 is getting close to the price as you know this moving average is a dynamic support and resistance .
If you want to take the trade from this levels it could yield around 100 pips to 90.25 as a TP
PS. all yes pairs are highly correlated to USD/JPY 0.24% so if the greenback keep the pressure yen will be weak against all currencies, but if UJ drop this trade will probably gonna fail..
good luck homies

Searching it´s touchdown at a 200EMA!The EURGBP is trying to get back to the level of the 200 EMA
Due to traders getting their profits, it seems the start a retracement. According to the theory, it will make the last move down to get back to the level of this 200 EMA.
Check the 4H chart to see the best point to enter.
When a full candle is under the 14 EMA line.

CLAMS this is madness update I'm still pretty bullish for this particular pair.
Story so far...
Pair bounced from 8500 and hang for some time above 10k then moved quickly above lower GAP reached first our goal which was 22k then moved back a little and rested above 200ema and on the bottom of the GAP to gain some strength to move higher. Target for this pair is still 0.00560000.
Another turning point will be when pair will move above upper GAP then eventually will rest on it and prepare for final push. There is probably bunch of the other scenarios so let's observe. I will update this idea so if U follow this trade I will definitely update if something important will happen

GOLD 4HPrice close to approaching strong monthly support level. Price could rebound from there or break though bringing more downside. Price also near 200 EMA which could act as a potential support area as well. Will watch for a breakout of downtrend line on the 4H & wait for a bullish engulfing to consider taking this long. Will be watching price action for now! : )

TRIG three line strike combined with 38.20% Fibo I decided to add something from me for this pair. I checked other ideas and seems like everyone is pretty positive about it.
I marked with yellowish rectangle very important candlestick pattern. It is called three line strike and it has very high accuracy rate something like 84%.
Combined with 38.20% fibo it makes quite solid support.
I would wait a little bit to enter when 200 EMA will give a nice push and move it higher.
I would look close to 0.0010000 as the profit area.

ETH another drop to 0.05000 ?I'm observing this pair for some time. I was almost bullish for it. I marked very strong support/resistance area(0,066500) which I think will be broken soon. 0.05000 was tested on polo once so it is possible that this kind of move which happen again. I'm expecting strong move after this area will be broken.

USDCAD I'm waiting for good signal for another short sellI expecting pair to meet 200 ema again. I think pair will be stopped by 200ema and this is the time I will be looking for short position. My TP is 1.2254. I almost certain like most traders here that his pair will reach 1.200 sooner or later but currently can't find good entry point.

BCN new opportunity aiming for 200% profit I marked rounded bottom on the chart. Pair is currently trading above very important Fibonacci level which is 14.58%. This formation combined with 200 ema is suggesting solid bottom and probably rebound to 50% of previous big move. I wouldn't be surprised if the pair will go down just to touch the closest lowest low.

Maidsafecoin perfect triple bottom really good BUY signalIt is perfect rebound from the very solid support. We can see on daily chart really perfect triple bottom formation. I would set up TP area near highs but it can change over time. really good buy signal.
I took closer look:
1st bottom we see morning start formation with upside down head and shoulders formation. Shoulders level above 10k
2nd bottom upside Head and shoulders formation shoulders level above 10k
3rd bottom nice hammer and it seems like it is forming third upside head and shoulders
This looks pretty harmonic
