Thoughts on $ENA (Ethena)ENA is looking pretty solid right now. Ethena is one of those coins that just shrugs off market corrections. We've seen a 320% jump, which is pretty wild.
As long as it stays above $1, I think the chart is in good shape. It might need some time to chill before aiming for that all-time high (ATH), and it looks like now might be that time.
87.5% of the coins are in the hands of whales, and they're not letting go.
Next big unlock isn't until April 2nd, 2025, with 13.75% of the supply hitting the market.
With whales holding the reins, they're waiting for the perfect moment to cash in, which means they'll need some serious hype and a bunch of FOMO buyers.
It makes sense that this could happen if it breaks that ATH of 1.52. Doesn't mean it'll be a straight shot up there; we might see some dips, but I think the odds are good it'll make it eventually.
ENA

ENA/USDT Analysis (1-Hour Timeframe)ENA/USDT Analysis (1-Hour Timeframe)
We are currently witnessing a breakout of the identified pattern on ENA/USDT in the 1-hour timeframe. This breakout signals potential bullish momentum.
Key Observations:
Breakout Confirmation: The price has successfully broken through the pattern, indicating a shift in market sentiment.
Target Projection: My first target is set at the next green zone, where I anticipate the price might encounter some resistance or consolidation.
Potential Scenarios:
If momentum sustains, we could see further upward movement beyond the green zone.
However, in case of a pullback, monitoring for support around the breakout level will be crucial.

#ENA/USDT Ready to go up#ENA
The price is moving in a descending channel on the 15-minute frame and sticking to it well
We have a bounce from the lower limit of the descending channel, this support is at 0.6900
We have a downtrend on the RSI indicator that is about to be broken, which supports the rise
We have a trend to stabilize above the moving average 100
Entry price 0.7000
First target 0.7190
Second target 0.7389
Third target 0.7600

$ENA to ALL TIME HIGH Ethena fi with a clean sweep of previous highs
This has much room to $10
Buy signal still active on XETR:ENA

ENA Long Sl -9.35%ENA Long Setup
Reason:
breakout from trendline
Fair Value gap Still not mitigated, waiting for liquidity to be grabbed.
Golden pocket will be the entry point.
Showing Bullish momentum in HTF
Waiting for LTF confirmation to enter.
Best Regards,
The Crypto Panda
BINANCE:ENAUSDT
BYBIT:ENAUSDT.P
MEXC:ENAUSDT
KUCOIN:ENAUSDT

URGENT: ENA Critical Support Zone Could Trigger Massive RallyConsidering that BTC might pull back slightly further to around $86k or $85k.
This chart showcases the price action of ENA against Tether (USDT) on a daily timeframe, highlighting crucial levels of support, resistance, and a speculative path for potential price movement. The blue zone, around $0.5040 to $0.4833, represents a significant support area where the price may find buyers if it retraces from its current level near $0.640. The chart also indicates a red projected path suggesting a pullback toward the blue zone before a potential bullish reversal and upward rally.
The upper resistance zones, at $0.6809 and $1.0353 to $1.0976, mark critical areas where sellers may attempt to stall the price momentum. A decisive break above these levels could open the doors for a rally toward the previous highs near $1.5230. The current setup suggests that traders are closely monitoring the blue support zone for signs of bullish strength, while the overall sentiment remains cautiously optimistic, contingent upon holding the key support and breaking the resistance zones.

Is #ENAUSDT Ready to Rally or Fall Further? Key Levels to Watch Yello, Paradisers! Is #ENAUSDT ready to make a massive bullish move and slide down further? Let's discuss #Ethena analysis and see what's happening:
💎#ENA is showing promising signs of a bullish continuation and holding steady at the crucial support zone between $0.254 and $0.300. We've been closely watching its journey within a Descending Broadening Wedge pattern, and now, #Ethena looks poised to test the descending resistance line—a potential turning point.
💎Volume has remained robust, and with #ENA marking its all-time low just one month ago, we may be setting up for a strong rebound. As the saying goes, "Once we hit bottom, the only place to go is up," and this could be unfolding right now.
💎If #ENAUSDT can maintain strength at its current level, we could be on the verge of a significant rally. A breakout above the $0.470 minor resistance zone would open the path to higher targets and potentially even new highs.
💎However, if momentum weakens around this support zone, a pullback toward the lower demand area near $0.204 could be in store. A daily close below this demand zone would invalidate our bullish outlook and could signal more downside risk.
Stay vigilant, Paradisers, and closely monitor #ENA's price action.
MyCryptoParadise
iFeel the success🌴

$ENA - Local resistance that needs to flippedENA broke above the weekly consolidation, however, price has reached its higher timeframe supply zone.
The structure remains positive, suggesting potential for more upside as long as it holds .54 to .50 level
If .50 level holds, there's a chance we could quickly reach 0.80.
For now, 0.66 is the local resistance that needs to be flipped.

ENAUSDT Bullish Flag!ENAUSDT Technical analysis update
ENAUSDT is trading within a bullish flag pattern on the 4-hour chart, with the 100 EMA providing support at the flag's bottom. Once the price breaks above the flag's resistance, a bullish move of 50-100% can be anticipated in ENA.
Buy After breakout confirmed in 4H chart
Target: 50%-100%

$ENAUSDT going new ATHBINANCE:ENAUSDT
This coin will perform well in this cycle. A very strong team and a very good prospect to fly to the overhang.
Targets are on the chart. Adding to the portfolio.

ENA (Ethena) The recent price movement of ENA (Ethena) has shown exciting technical shifts, particularly after attempting to break out of a long-standing price channel four times. This repeated testing of resistance typically indicates strong buying pressure and potential momentum toward higher price levels. With the price channel finally breaking, ENA has surged toward a target range of $2-$5 This upward movement suggests increased investor confidence and bullish sentiment, often seen when technical resistance is overcome after multiple attempts.
A price target of $5 is ambitious, yet plausible, given the increased interest and potential fundamental factors supporting ENA. However, as with all crypto investments, this analysis should be viewed as a technical observation and not financial advice, as the market remains highly volatile and subject to rapid changes based on external influences.

ENA USDTENA chart shows the price behavior within a descending channel. The price has been respecting the channel boundaries, with each peak and trough aligning with the upper and lower trendlines. The price of ENA has been rejected from the upper boundary of the descending channel and the resistance zone (Green) at $0.4203 - $0.4462 many times.
Everything is on the chart

#ENA/USDT#ENA
The price is moving in a descending channel on the 4-hour frame upwards and is expected to continue.
We have a trend to stabilize above the moving average 100 again.
We have a downtrend on the RSI indicator that supports the rise by breaking it upwards.
We have a support area at the lower limit of the channel at a price of 0.33100.3800.
Entry price 0.2800.
First target 0.4174.
Second target 0.4435.
Third target 0.4637.

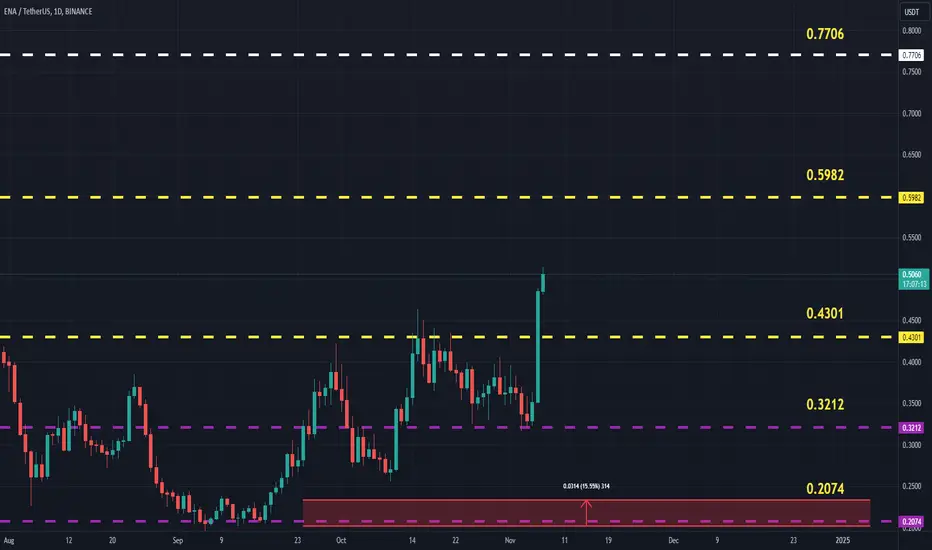
ENAUSDT (Ethena) Updated till 07-11-24ENAUSDT (Ethena) Daily timeframe range. PA got lots of space to move around here. if the candle above 0.4301 dont get invalid it can get to 0.5982 or above depends on volume. but for that it needs to hold 0.4301. recent support at 0.3212.
ENA/USDT: Bull Flag Breakout! Strong Bullish Setup in Play!!Hey everyone!
If you’re finding value in this analysis, don’t forget to hit that 👍 and follow for more updates!
ENA is looking strong right now! It is breaking out from the bull flag pattern and a successful retest is also done. Long some at CMP and add more in the dip.
Entry range: CMP and add more up to $0.36
Targets:- $0.44/$0.50/$0.57/$0.64
SL: $0.345
Lev: Use low leverage (Max 5x)
What do you think of ENA’s price action? I’m seeing a strong bullish setup here! Share your insights and analysis in the comments below!

Ethena Labs Under Fire: Alleged Funds Misuse Sparks 6% ENA DropOverview of Allegations and Price Impact
Ethena Labs, an Ethereum-based synthetic dollar protocol, is facing significant community backlash after allegations of fund misuse. The controversy centers around Ethena Labs’ involvement in its own crypto farming event using 180 million XETR:ENA tokens, allegedly manipulating rewards to benefit the organization. Following these accusations, the ENA token’s price has taken a notable hit, crashing 6.01% to $0.33 as investors question the protocol’s transparency and governance.
Details of the Alleged Misuse
The allegations emerged on October 27 when crypto analyst Nomad pointed out that Ethena Labs staked approximately 25% of the total ENA (SENA) supply in its ongoing Season 3 farming event. According to Nomad, the Ethena team used six wallets, which reportedly accumulated significant rewards, including Satoshi points and Ethereal tokens, through interactions within the ecosystem. Observers believe that the staking could dilute the rewards of regular participants and create an ethical dilemma by favoring foundation insiders.
The accusations reveal that these wallets may have received 180 million XETR:ENA tokens from a Coinbase Prime Custody address, previously believed to hold locked tokens for the Ethena Foundation. The debate sparked an intense response from the community, with some questioning Ethena’s governance practices.
In response, Ethena Labs issued a public statement denying the allegations. The team asserted that no locked team or investor tokens were staked to receive rewards, and all ENA tokens in question were sent from foundation wallets following the vesting schedule. To enhance transparency, Ethena Labs announced a UI update, breaking down total sENA eligible for future airdrops and excluding undistributed tokens.
Past Staking Controversies
Ethena’s history with its farming events raises additional concerns. Past staking events, particularly Seasons 1 and 2, reportedly suffered from irregularities, leading some participants to incur financial losses. These recurring issues have led many community members to scrutinize the protocol’s fairness and commitment to ethical governance. For Ethena Labs, maintaining credibility is crucial, given that the protocol manages a substantial $2.6 billion in user funds.
Despite the allegations, Ethena Labs received a confidence boost as Wintermute, a prominent algorithmic trading company, accepted Ethena’s USDe token as collateral for over-the-counter (OTC) trading activities. This acceptance suggests that, while mired in controversy, Ethena’s assets are still gaining traction in broader financial markets.
Technical Analysis
On the technical front, XETR:ENA token is experiencing a downtrend as it currently trades below the 50-day moving average. With a Relative Strength Index (RSI) at 43, the market sentiment remains bearish. ENA’s daily chart reveals a rising wedge pattern, indicating potential downward movement if the price fails to hold within this channel. The token is approaching a crucial support level at $0.17, a breakdown of which could lead to further declines, especially if Bitcoin’s bullish momentum reverses.
With the ongoing scrutiny and allegations, Ethena Labs faces pressure to prove its commitment to fair practices and transparency. If it addresses these issues effectively, the protocol may regain the community’s trust. However, any failure to resolve these concerns could hinder its long-term prospects in the increasingly competitive DeFi landscape.

ENA/USDT: Potential Accumulation Phase on Weekly SupportThe chart suggests that ENA/USDT is currently in a potential accumulation phase, with price hovering around a key support zone on the weekly timeframe. This may indicate a possible bottoming pattern, setting the stage for a bullish reversal.
Detailed Analysis:
Support Zone:
ENA/USDT is trading near the highlighted green support area around the $0.16 - $0.20 range. This zone has acted as a critical support level in the past, absorbing selling pressure and facilitating potential buying interest.
Current Price Action:
The price is consolidating in this zone, indicating a possible accumulation phase, which typically precedes a bullish move.
The recent low volume suggests a lack of selling momentum, which could be a sign of potential bullish interest building up.
Entry Price:
The ideal entry range is around $0.16 - $0.20, given the strong support at these levels. This offers a lower-risk entry point with the potential for a significant upside.
Target Price:
The primary target price for this setup could be around $0.55, which corresponds to a previous resistance level and aligns with potential recovery if bullish momentum picks up.
Key Support & Resistance Levels:
Support: $0.16 - $0.20 (accumulation zone)
Resistance: $0.36 (intermediate resistance), $0.55 (target level)
Risk Management:
Stop Loss: To manage risk, a stop-loss can be placed below $0.15, as a break below this level could invalidate the potential bullish setup.
Trade Plan Summary:
Entry Zone: $0.16 - $0.20
Take Profit: $0.55 (target level)
Stop Loss: Below $0.15
Conclusion:
ENA/USDT appears to be consolidating at a strong weekly support zone, indicating a potential accumulation phase. If the support holds, a bullish reversal toward the $0.55 resistance level is possible.

$ENA - dPOC and ImbalancesRecently, there’s been a noticeable increase in VC/KOL backing Ethena (ENA).
XETR:ENA has broken out above $0.30 and now price is at key resistance at 0.46
Stay below 0.445 on the hourly chart, and we could see a decline toward the 0.40 to 0.38 range (wVAP) . A bounce is likely here, followed by a potential retest of 0.44 (dPOC) .
Any rejection we get at 0.44, I'm expecting for the singleprints to be filled at 0.36 to 0.28 zone.

ENA(Ethena) COMING WITH BIG GAINThe initial entry was made earlier. A new entry point is identified between 0.31 and 0.33, with a stop-loss set at 0.28. The target remains higher.
Gradual increase in volume indicates that it may be the right time to consider a position.
#ENA #BTC #USDT

#ENA/USDT#ENA
The price is moving in a descending channel on the 12-hour frame and is sticking to it to a large extent and it was broken upwards
We have a bounce from the lower limit of the channel at a price of 0.200
We have an upward trend on the RSI indicator, which supports the rise
We have a trend to stabilize above the moving average 100
Entry price 0.220
First target 0.257
Second target 0.286
Third target 0.322

ENAUSDT Resistance Breakout!ENAUSDt technical analysis update
ENA is breaking the resistance trendline after 20 days of consolidation on the 4H chart. We can expect a strong bullish move from the current level, as the price is trading above the 100 EMA.
Regards
Hexa

#ENA/USDT#ENA
We have a descending channel pattern on the 12-hour frame, the price is moving within it and adhering to its borders well
We have a support ar ea in green at a price of 0.800 after the price touched it and rebounded from it
We have a trend to stabilize above the moving average 100
We have a descending trend on the RSI indicator that supports the price upwards and is expected to break it
Entry price 0.2900
First target 0.330
Second target 0.355.
Third target 0.386

ENAUSDTENA ~ 12H
#ENA Successfully broke through the resistance of this descending pattern.
Buy in stages. bulls will continue to push the price as long as it is above this resistance.
