ENA : The largest token release...Hello dears
Given the long-term price decline that we have witnessed, it has now been announced that this currency is going to do a token release, which will naturally cause the price to fall, so be careful.
In case of a fall, we have identified important supports for you so that you can buy with risk and capital management.
The target has also been identified.
*Trade safely with us*
ENAUSDT

TradeCityPro | ENA: Expansion Pattern Near Critical Break Levels👋 Welcome to TradeCity Pro!
In this analysis, I want to review the ENA coin for you. The Ethena project is one of the DeFi projects in crypto that has attracted a lot of hype in this category.
💥 ENA coin, with a market cap of $1.7 billion, ranks 50th on CoinMarketCap.
📅 Daily Timeframe
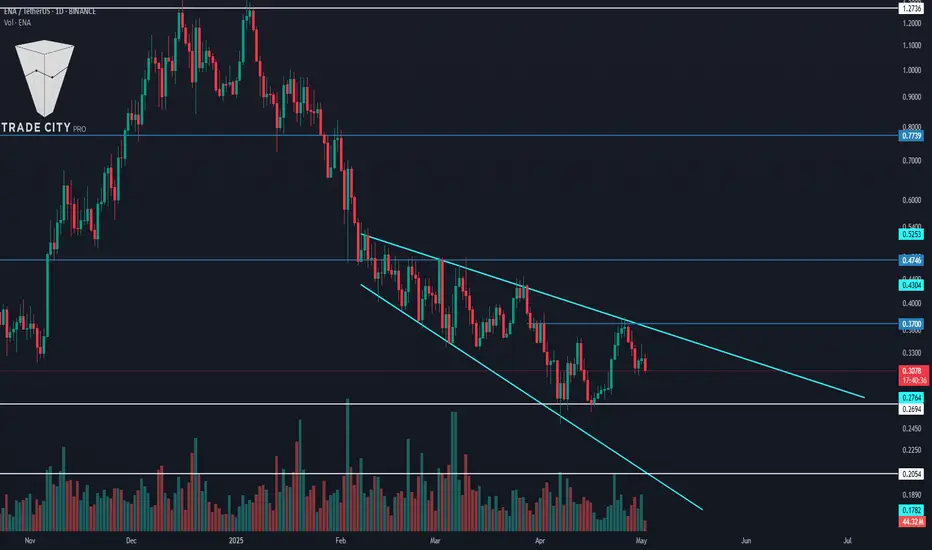
As you can see on the daily chart, there is an Expanding Triangle, and the price is fluctuating within this pattern.
📚 One key characteristic of an Expanding Triangle is that while the price is within the triangle, it tends not to respect static levels such as supports and resistances. Currently, the price is within the triangle and, as you can see, it doesn’t respond significantly to static zones.
📈 For this coin to become bullish, the triangle must break to the upside and the triangle trigger at 0.37 should be activated. In that case, the price can move upward and begin a bullish trend. Full confirmation of the bullish reversal will come with price stabilization above 0.4746.
✔️ For continued downward movement, the first trigger is the break of 0.2694. If you already hold this coin, you can use this level as a stop-loss — and once the price closes below it, you can trigger your stop-loss.
📊 For short positions, the break of 0.2694 is a valid trigger, but the issue is that it activates before the triangle breaks, and I personally prefer not to open a position within an Expanding Triangle — I’d rather wait and enter after it breaks.
🔽 Another trigger for a bearish move is the break of 0.2054. This is the main support for ENA, and if it breaks, the price will register a new All-Time Low.
📝 Final Thoughts
This analysis reflects our opinions and is not financial advice.
Share your thoughts in the comments, and don’t forget to share this analysis with your friends! ❤️
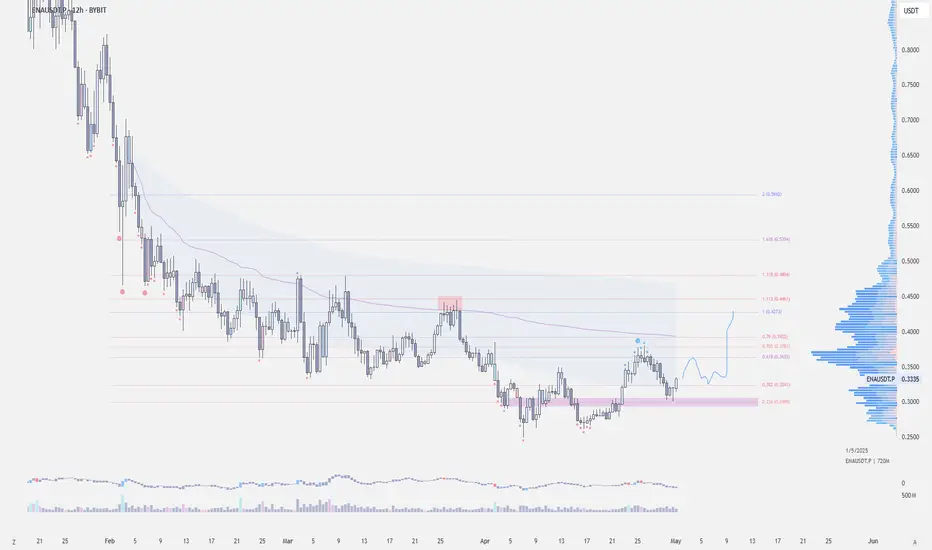
$ENA - Long Trade IdeaBINANCE:ENAUSDT | 12h
This one looks good so long as we're holding the .236 fib level or 0.29
We may get a reaction again at OTE levels .36 to .38
Stoploss: just below .29
Re-entry: .32 to .29
Set your target to .40 to .50 if we hold this level
$ENA/USDT Quick Analysis $ENA/USDT Quick Analysis
ENA has successfully broken its long-term downtrend and retested the $0.30–$0.35 support zone.
Price action is bullish, aiming for a $1.35 target (295% upside).
The breakdown below $0.30 would invalidate the setup
DYOR, NFA

#ENA/USDT#ENA
The price is moving within a descending channel on the 1-hour frame, adhering well to it, and is heading for a strong breakout and retest.
We are seeing a bounce from the lower boundary of the descending channel, which is support at 0.3430.
We have a downtrend on the RSI indicator that is about to be broken and retested, supporting the upward trend.
We are looking for stability above the 100 moving average.
Entry price: 0.3521
First target: 0.3608
Second target: 0.3728
Third target: 0.3882

ENA is standing at a classic “make-or-break base-build” juncture
🕞 60-Second Read
Trend on the 1-D chart is still structurally bearish , yet price (spot 0.350 USDT) just printed a higher-low off the April wick and reclaimed the mid-channel line. Two large upside voids are now in play.
Hot-Zone #1 – 0.292 (15 m imbalance): fresh demand, 17 % under spot.
Hot-Zone #2 – 0.496 (3 MP-High retest): range cap & first breaker, 42 % above.
Hot-Zone #3 – 0.836 → 0.892 (Feb pivot ↔ Yearly EC): macro supply shelf.
🎲 Probability Dashboard
HTF Trend & Structure – -2
Liquidity Map (voids above) – +1
Momentum (vector flips) – +1
Derivatives (funding ≈ flat) – 0
Net Score = 0
Bear / Neutral / Bull odds ≈ 40 % / 30 % / 30 %
📈 Trade Playbook
Strategy 1
1. Layered Limit Grid – Aggressive Counter-Trend Long
Entry layers (size %):
0.300 – 25 % of your allocated ENAUSDT size
0.280 – 35 %
0.260 – 25 %
0.240 – 15 %
SL = 0.215
TP ladder:
0.350 – 20 % off-load
0.496 – 25 %
0.836 – 30 %
1.040 – 25 %
Weighted R:R ≈ 7.3
Strategy 2
2. Layered Limit Grid – Conservative Breakout Long
Trigger: daily close > 0.496, then place grid orders.
Entry layers (size %):
0.510 – 40 %
0.570 – 30 %
0.650 – 20 %
0.836 – 10 %
SL = 0.440
TP ladder:
0.836 – 30 %
1.040 – 30 %
1.516 – 25 %
1.550 – 15 %
Weighted R:R ≈ 4.8
Setup Logic
Price reclaimed mid-channel but remains inside a 69 % upside void to 0.836.
Stacked un-retested highs (0.496 / 0.836 / 1.040) act as magnetic targets.
Yearly S1 (0.220) converges with vector zone support – ideal invalidation.
Risk Radar
Perp OI up 18 % WoW – a funding spike could squeeze late longs.
Two token unlocks (2 & 5 May) add ≥ 200 M ENA supply.
Macro: FOMC (1 May) & BTC flow volatility may spill into alts.
ENA must flip 0.496 to sprint through the 0.84-1.04 air-pocket; fail that and liquidity magnets at 0.30 → 0.22 take the wheel. Trade the grid – not the hopium.
(Not financial advice – always do your own research.)

#ENA/USDT#ENA
The price is moving within a descending channel on the 1-hour frame, adhering well to it, and is heading for a strong breakout and retest.
We are seeing a rebound from the lower boundary of the descending channel, which is support at 0.2800.
We have a downtrend on the RSI indicator that is about to break and retest, supporting the upward trend.
We are looking for stability above the 100 moving average.
Entry price: 0.2935
First target: 0.3020
Second target: 0.3100
Third target: 0.3200

ENA/USDT Breakout Pattern (18.04.2025)The ENA/USDT pair on the M30 timeframe presents a Potential Buying Opportunity due to a recent Formation of a Breakout Pattern. This suggests a shift in momentum towards the upside and a higher likelihood of further advances in the coming hours.
Possible Long Trade:
Entry: Consider Entering A Long Position around Trendline Of The Pattern.
Target Levels:
1st Resistance – 0.3015
2nd Resistance – 0.3217
🎁 Please hit the like button and
🎁 Leave a comment to support for My Post !
Your likes and comments are incredibly motivating and will encourage me to share more analysis with you.
Best Regards, KABHI_TA_TRADING
Thank you.

ENAUSDT 1DENA ~ 1D Analysis
#ENA The main support that you might be able to consider to start buying back from here with a short -term target of at least 10%+ from here.

ENAUSDT 2DENA ~ 2D Analysis
#ENA Buy gradually after re -testing this support with a short -term target of at least 15%+ from here.

ENA Possible Head and ShouldersENA might be forming an head and shoulders formation which could cause a significant drop in value.
Be careful if the level of 0.34 breaks. It's also a great short opportunity.
Thanks for reading.

$ENA - Scalp Long Trade IdeaENA | 2h
0.328 appears to be the local resistance level here
If we can get a valid swing point retest around 0.31-0.305, we'll considering to long targeting the bearish order block above
Setting stoploss just below 0.29
Targets:
0.347
0.379 (bearish order block)
0.392

ENA/USDT Price Analysis📌 About ENA Token
ENA is the native token of Ethena, a decentralized synthetic dollar protocol built on Ethereum. Ethena aims to provide a stable, scalable, and censorship-resistant crypto-native alternative to traditional stablecoins. The token is used for governance, staking, and liquidity incentives within the Ethena ecosystem.
📉 ENA/USDT Price Analysis (4H Chart on Binance)
🔎 Market Overview
🔹 Current Price: $0.3194
🔹 Recent High: $0.3420 (Resistance)
🔹 Recent Low: $0.2907 (Support)
🔹 Volume: 3.56M (High volume at recent dip, showing potential buyer interest)
📈 Bullish Factors:
✅ Short-Term Bounce: The price has rebounded from the $0.2907 support level, indicating buyers stepping in.
✅ Moving Average Support: The yellow line (short-term MA) is beginning to turn up, suggesting early bullish momentum.
✅ Key Resistance at $0.3420: If ENA breaks this level, it could move towards $0.3509 - $0.3718.
⚠ Bearish Risks:
❌ Overall Downtrend: ENA is still trading below the blue (medium-term) and green (long-term) moving averages, which could act as resistance.
❌ Lower Highs Pattern: The recent price structure suggests a potential bearish continuation unless it breaks above $0.3420 - $0.3509.
❌ Potential Drop to $0.2907 - $0.2530: If ENA gets rejected at resistance, a lower move to the major support around $0.2907 or even $0.2530 is possible.
📊 Possible Scenarios:
1️⃣ Bullish Case (Breakout Above $0.3420)
If ENA breaks and holds above $0.3420, the next targets are $0.3509, $0.3718, and possibly $0.3942.
A breakout confirmation would signal trend reversal.
2️⃣ Bearish Case (Rejection & Drop to Support)
If ENA fails to break $0.3420, expect a pullback to $0.3106 - $0.3060 first.
If those supports fail, ENA could retest $0.2907 and possibly drop further to $0.2530.
💡 Trading Strategy:
📌 Long Entry: If ENA breaks $0.3420, target $0.3718 - $0.3942.
📌 Short Entry: If rejected below $0.3420, look for shorts targeting $0.3106 - $0.2907.
📌 Stop Loss: Set below $0.2907 for long trades and above $0.3420 for short trades.

ENA About to Collapse or One Last Rally Before the Fall?Yello, Paradisers! Is ENA about to crash hard, or is a sneaky rally waiting to trap late bulls? Read this before making your next move!
💎#ENAUSDT has recently formed a Change of Character (CHOCH) while leaving behind a supply zone and an imbalance. Currently, we expect an upside correction toward $0.4333 and $0.4507, but this move is likely to be short lived. If the price taps these levels and faces strong resistance expect a sharp rejection, especially with the descending trendline and EMA 50 acting as barriers to bullish momentum. This setup suggests ENA is in a prime position for further downside unless it breaks above the supply zone.
💎If #ENAUSD fails to break the supply zone, a rapid sell-off toward the $0.34 support zone is highly likely. A visible gap imbalance further increases the probability of the price filling the gap before any potential reversal. Volume analysis also shows a clear surge in bearish activity, confirming strong selling pressure in the market.
💎The $0.34 level remains the most crucial support where buyers may attempt to step in. However, if this fails to hold, the next major demand zone sits around $0.30, where a deeper correction could unfold. Until a significant bullish breakout occurs, the risk of further downside remains high.
💎If the price manages to break above the supply zone, it would invalidate the bearish setup and could fuel a stronger rally. However, as long as the descending trendline and EMA 50 continue to hold back bullish momentum, the bearish outlook remains intact.
💎Will ENA hold support or break down further? Drop your thoughts in the comments! Are you positioning yourself for a move, or are you waiting for confirmation? Let’s discuss!
Stay sharp, Paradisers! The market rewards patience, discipline, and strategic thinking. Trade smart.
MyCryptoParadise
iFeel the success🌴

#ENA/USDT#ENA
The price is moving within a descending channel on the 1-hour frame, adhering well to it, and is heading for a strong breakout and retest.
We are experiencing a rebound from the lower boundary of the descending channel, which is support at 0.3530.
We are experiencing a downtrend on the RSI indicator, which is about to break and retest, supporting the upward trend.
We are looking for stability above the 100 Moving Average.
Entry price: 0.3700
First target: 0.3820
Second target: 0.3950
Third target: 0.4118

Bearish Outlook for ENA: Potential Downward TrendHello everyone! 👋
I hope you're all doing well. I wanted to share my thoughts on ENA and provide my perspective on the current market situation. Here's my outlook:
The price of this coin is exhibiting signs of weakness, suggesting it may face further downward pressure. Recent price action has broken through key support levels, while momentum indicators are pointing to a continuation of the prevailing downtrend.
If the broader market sentiment remains negative, we could see further declines toward the next major support zones. While potential rebounds are always a possibility, the overall trend currently appears to favor the bears.
Stay vigilant and manage your risk accordingly.
Best regards! BINANCE:ENAUSDT

ENA/USDT Analysis: A great opportunity for a speculative longThis asset has broken an important sell zone and consolidated above it, forming a strong volume zone below at $0.415-$0.408. On a retest of this zone, we will monitor the reaction. If confirmation appears, we open a long position with the potential to break above the $0.48 level.

FireHoseReel | $ENA AnalysisWelcome to FireHoseReel!
Weekly Timeframe
BINANCE:ENAUSDT coin is currently at its strong demand zone on the weekly time frame, and it could potentially experience a pump from this area.
Let's check the lower time frames as well to find the best entry point!
Daily Timeframe
On the daily time frame, we have refined the weekly zone.
The price is currently at this zone, and there is significant liquidity to place targets, including liquidity voids and highs.
We also expect the start of the price's substructure phase on the daily time frame and the start of the minor phase on the weekly time frame.
4H Timeframe
On the 4-hour time frame, we are looking for our entry.
We have a demand zone where the price has reversed and turned bullish(CH).This zone also has a lot of liquidity above it, which serves as confirmation for our zone.
This zone will be a good entry point for a long trade.
Our target will be 0.5$ then 0.75$.

ENA/USDT: 100% PROFIT POTENTIAL TRADE SETUP!!🚀 Hey Traders! ENA Breakout Alert – 100% Move Incoming? 👀🔥
If you’re excited for this setup, smash that 👍 and hit Follow for premium trade ideas that actually deliver! 💹🔥
🔥 ENA/USDT – Breakout & Retest in Play! 🚀
ENA has broken out of a falling wedge and is now retesting the breakout level. With momentum building, it looks poised for a massive 90-100% upside move from here! 💥
💰 Trade Setup:
📍 Entry: CMP, add more up to $0.36
🎯 Targets: $0.46 / $0.58 / $0.66 / $0.77
🛑 Stop-Loss: $0.325
⚡ Leverage: Low (Max 5x)
🔎 Strategy:
Enter with low leverage now
Add more on dips and ride the breakout momentum higher 🚀
💬 What’s Your Take?
Are you bullish on ENA’s potential for a 100% move? Share your analysis, predictions, and strategies in the comments! Let’s crush it together and lock in those gains! 💰🚀🔥

ENA...Hello friends
Given that the price has reached the bottom of the range, which is also a good support area, we can enter the trade with risk and capital management.
*Trade safely with us*

Phemex Analysis #68: Is It A Good Time to Buy Ethena (ENA) Now?!Ethena has rapidly ascended in the decentralized finance (DeFi) sector, notably propelling its stablecoin, USDe, to become the world's largest by market capitalization within a year. In December 2024, Ethena Labs introduced USDtB, a stablecoin backed by BlackRock's tokenized money market fund, BUIDL, aimed at stabilizing USDe during bearish crypto market phases. More recently, a proposal has been put forward to integrate Ethereal, a decentralized exchange (DEX), into Ethena's reserve management system. This integration seeks to enhance trading capabilities for USDe and distribute governance tokens to ENA holders, further enriching the ecosystem.
Despite these fundamental advancements, ENA's price has experienced significant volatility. After reaching a high of $1.32, the token's value declined by approximately 75%, hitting a low of $0.33. However, the downward momentum has recently slowed, coinciding with a broader market recovery. This shift has led many to question whether now is an opportune time to invest in ENA, especially considering its substantial real-world developments.
Potential Scenarios
1. Continued Downtrend
If ENA fails to maintain current support levels at $0.316, it could test lower price points. Factors such as broader market downturns or negative investor sentiment could exacerbate this decline.
Pro Tips:
Short Positions: Experienced traders might consider short-selling strategies to capitalize on potential declines, especially if the price drops below $0.316 with high volume.
Buying at Support Levels: Long-term investors may consider accumulating ENA gradually near established support levels such as $0.26 and $0.20.
2. Consolidation Phase
ENA may enter a consolidation phase, trading within a defined range as the market seeks direction. This period of sideways movement could last until new catalysts emerge.
Pro Tips:
Range Trading: Identify key support ($0.316) and resistance levels ($0.48) to execute buy and sell orders effectively within the trading range.
Patience: Avoid overtrading during consolidation; wait for clear signals before making significant moves.
3. Bullish Reversal
Given ENA's recent positive developments and technical indicators, there is potential for a bullish reversal. Sustaining levels above recent resistance points could signal renewed investor confidence and an upward trend.
Pro Tips:
Breakout Entry: If the price breaks above the $0.40 resistance level with high volume, consider a long position with profit targets at $0.48, $0.54, and $0.70.
Accumulate Gradually: Consider dollar-cost averaging to build a position without exposing yourself to immediate market volatility.
Conclusion
Deciding to invest in ENA requires careful consideration of these scenarios. By employing strategic approaches tailored to each potential outcome, traders can better navigate the complexities of the cryptocurrency market. As always, thorough research and prudent risk management are essential when making investment decisions.
Tips:
🔥 Break free from "buy low, sell high"! Our new Pilot Contract empowers you to profit from ANY market direction on DEX coins with up to 3x leverage. Go long, go short, go further!
Check out Phemex - Pilot Contract today!
Disclaimer: This is NOT financial or investment advice. Please conduct your own research (DYOR). Phemex is not responsible, directly or indirectly, for any damage or loss incurred or claimed to be caused by or in association with the use of or reliance on any content, goods, or services mentioned in this article.

$ENA LTF Resistance to FlipENA | 4H
If we can flip its local resistance $0.40, we can see it pulls back up retesting the equilibrium $0.47 to $0.52
Local support is around $0.35-$0.32

TradeCityPro | ENAUSDT Ready to Go!👋 Welcome to the TradeCityPro channel!
Let's go together to analyze and review one of my favorite coins and DeFi coins that we are likely to have and experience a movement in the coming days
🌐 Overview Bitcoin
Before starting the analysis, I want to remind you again that we moved the Bitcoin analysis section from the analysis section to a separate analysis at your request, so that we can discuss the status of Bitcoin in more detail every day and analyze its charts and dominances together.
This is the general analysis of Bitcoin dominance, which we promised you in the analysis to analyze separately and analyze it for you in longer time frames.
📊 Weekly Timeframe
On the weekly time frame, after we hit the 1.2788 level, which was our ATH, we got rejected from it and engulfed the previous weekly candle.
This was also an exit point or a take profit for us, and after this, it is very logical to withdraw some of our capital, and the reason is that the buyers could not do anything and push the price above this level!
📈 Daily Timeframe
On the daily time frame, but after we followed a parabolic move and its slope reached the end of the road, we were rejected by the important resistance of 1.2788
This rejection caused our parabolic move to end and after its failure, we went for an upward move again, but we were rejected by the resistance and went for the support of 0.7857
After the failure of this support and the pullback to it, we went for a rejection again from this resistance and are currently suffering between 0.3282 and 0.4833, with the difference that there is still more presence of sellers for this event
To buy at risk, you can also make a long position at risk after the level of 0.4833 because we can only be active in DeFi and take our coins to DeFi. Now that we are talking about DeFi, you can in this space Also set the liquidity range of the money and we can exit to activate the spot below the level of 0.3282!
📝 Final Thoughts
Stay calm, trade wisely, and let's capture the market's best opportunities!
This analysis reflects our opinions and is not financial advice.
Share your thoughts in the comments, and don’t forget to share this analysis with your friends! ❤️
