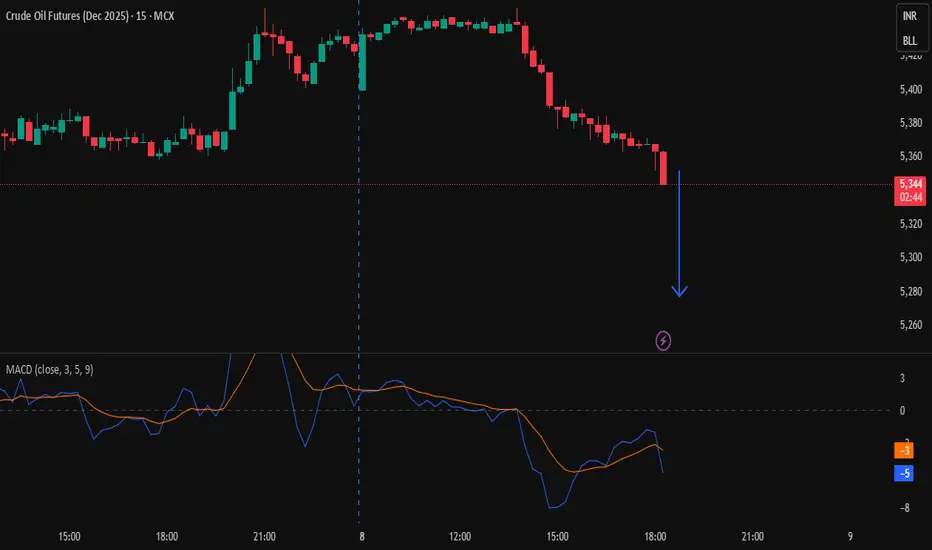
CRUDEOIL DEC 2025 FUTURESPrice making lower low and MACD making higher high and also MACD line if crosses below signal line, I thinks its going to be huge
Energy Commodities
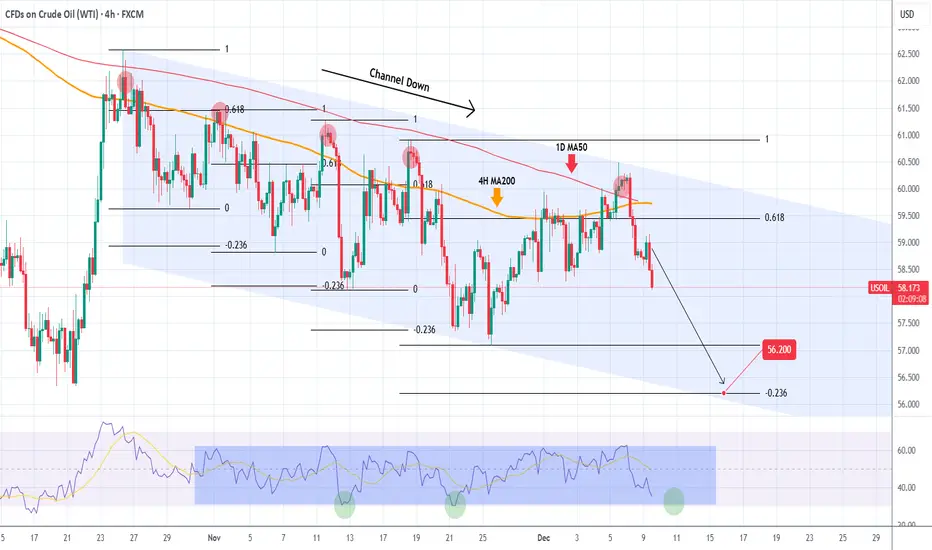
WTI OIL 1.5 month Channel Down started new Bearish Leg.WTI Oil (USOIL) has been trading within a 1.5-month Channel Down (since the October 4 High), that priced last Friday its latest Lower High, this time above the 1D MA50 (red trend-line).
That initiated the new Bearish Leg (also confirmed by the 4H RSI rejection at the top of its range). All 4 previous Bearish Legs bottomed just when the hit the -0.236 Fibonacci extension.
Based on that, we are expecting WTI to make a new Lower Low at 56.200.
---
** Please LIKE 👍, FOLLOW ✅, SHARE 🙌 and COMMENT ✍ if you enjoy this idea! Also share your ideas and charts in the comments section below! This is best way to keep it relevant, support us, keep the content here free and allow the idea to reach as many people as possible. **
---
💸💸💸💸💸💸
👇 👇 👇 👇 👇 👇
2026 retirement plan.The broader market structure suggests that 2026 could mark the lowest price level ever observed in natural gas, driven not by weakness, but by extraordinary global demand—particularly the explosive energy requirements of large-scale AI data infrastructures.
A double-top formation appears increasingly inevitable, supported by highly precise geometric alignment across multiple resistance and support zones.
This is not a trading call, but the result of a multifaceted, rigorously detailed market analysis viewed from several technical and structural angles.

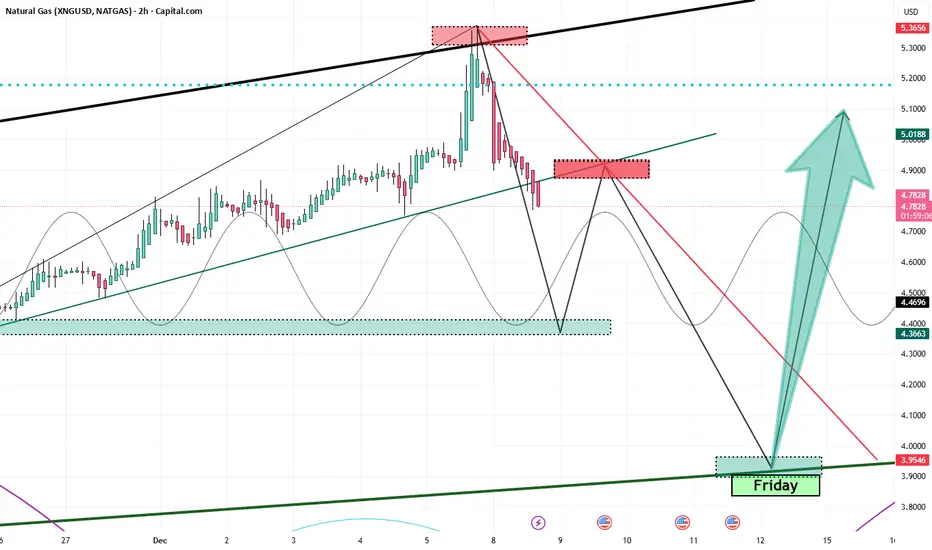
Wild Friday and the Weekly HammerFrom a technical-geometric standpoint, Natural Gas is approaching a high-confidence inflection zone. The weekly hammer forming into Friday’s close (12.12.2025) signals potential exhaustion of the recent downside leg and early signs of demand stepping back in.
Descending from 5.33 as expected, the move has unfolded cleanly, and the red candle opening on Monday—exactly in line with the anticipated flow—reinforces the directional bias of the current retracement phase
The end-goal for this corrective leg is anchored at 3.90, which stands out as the dominant liquidity objective. The structure shows a high—if not near-certain—probability of a retracement into that zone, consistent with the broader technical roadmap already outlined.
usoil : live tradeHello friends
Well, according to the channel we had, you can see that the sellers broke the specified support with strength and caused the price to fall.
Now, given that it has become clear to us that the power is in the hands of the sellers, we can re-enter the sell trade if the price rebounds or pullbacks in the specified area, of course with the necessary confirmations...
This analysis is purely technical and does not constitute a buy or sell recommendation, so please observe risk and capital management and avoid emotional movements.
*Trade safely with us*

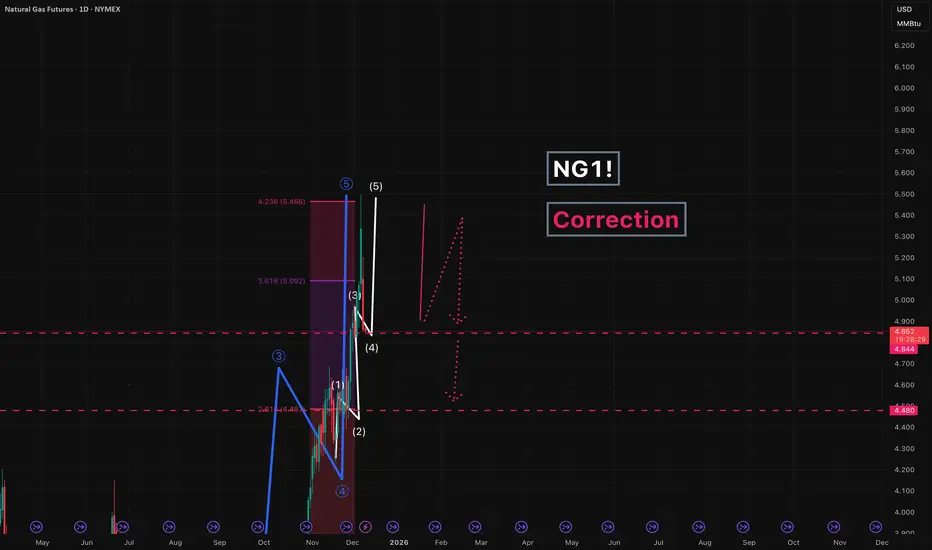
NG1! - correctionWe are currently correcting the impulsive move in Natural Gas.
First, we expect a pullback toward 4.850 (a move that is already in progress), followed by a continuation down into the 4.480 area.
---
Please subscribe and leave a comment.
You’ll get new information faster than anyone else.
---
WTI DEMAND LEVEL BELOW|LONG|
✅WTI OIL is retracing sharply toward a demand zone after drawing sell-side liquidity beneath short-term lows, setting up an ICT-style bullish reaction point. If demand holds, price is poised to rebalance upward into the inefficiency near the target zone. Time Frame 2H.
LONG🚀
✅Like and subscribe to never miss a new idea!✅

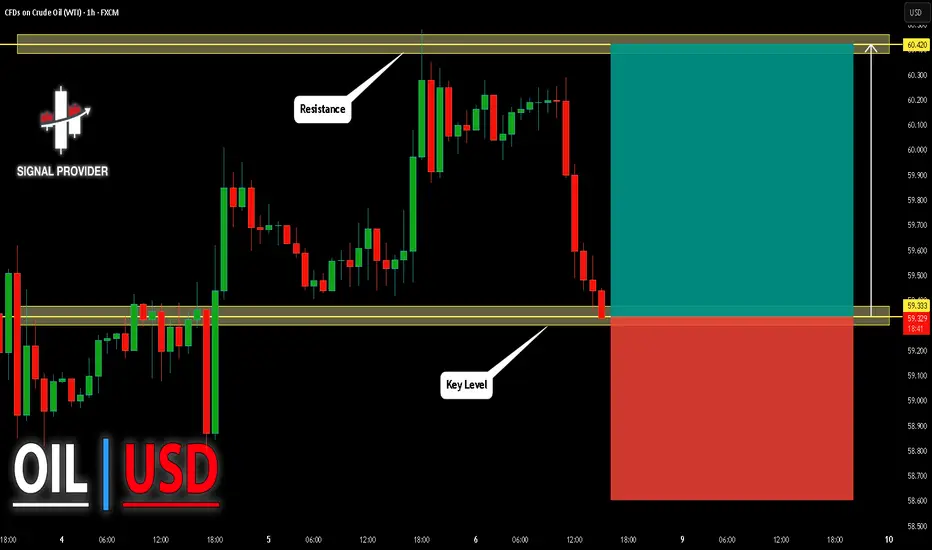
USOIL Will Go Up From Support! Buy!
Here is our detailed technical review for USOIL.
Time Frame: 1h
Current Trend: Bullish
Sentiment: Oversold (based on 7-period RSI)
Forecast: Bullish
The market is approaching a significant support area 59.333.
The underlined horizontal cluster clearly indicates a highly probable bullish movement with target 60.420 level.
P.S
Overbought describes a period of time where there has been a significant and consistent upward move in price over a period of time without much pullback.
Like and subscribe and comment my ideas if you enjoy them!
USOIL H1 | Bullish Bounce Off Pullback SupportMomentum: Bullish
The price is falling towards the buy entry which is slightly below the 61.8% Fibonacci retracement which adds a significant strength to this level.
Buy entry: 58.22
Pullback support
Slightly below the 61.8% Fibonacci retracement
Stop loss: 57.75
Pullback support
Aligns with the 78.6% Fibonacci retracement
Take profit: 59.48
Overlap resistance
High Risk Investment Warning
Stratos Markets Limited (tradu.com ), Stratos Europe Ltd (tradu.com ):
CFDs are complex instruments and come with a high risk of losing money rapidly due to leverage. 70% of retail investor accounts lose money when trading CFDs with this provider. You should consider whether you understand how CFDs work and whether you can afford to take the high risk of losing your money.
Stratos Global LLC (tradu.com ): Losses can exceed deposits.
Please be advised that the information presented on TradingView is provided to Tradu (‘Company’, ‘we’) by a third-party provider (‘TFA Global Pte Ltd’). Please be reminded that you are solely responsible for the trading decisions on your account. Any information and/or content is intended entirely for research, educational and informational purposes only and does not constitute investment or consultation advice or investment strategy. The information is not tailored to the investment needs of any specific person and therefore does not involve a consideration of any of the investment objectives, financial situation or needs of any viewer that may receive it. Past performance is not a reliable indicator of future results. Actual results may differ materially from those anticipated in forward-looking or past performance statements. We assume no liability as to the accuracy or completeness of any of the information and/or content provided herein and the Company cannot be held responsible for any omission, mistake nor for any loss or damage including without limitation to any loss of profit which may arise from reliance on any information supplied by TFA Global Pte Ltd.

Did Natural Gas Just Top? Natural Gas got pummeled today falling over 9% on the commodity.
In our last Natural GAs video we prepared you for the short idea.
Our members were long KOLD and took monster profits today.
Natural Gas is coming into a weekly demand zone so we have to see if some buy pressure comes into this next area. There could very easily be a bounce very soon.
Surprisingly not all nat gas stocks sold off today.
AR remained very strong.

CRUDE OIL Bearish Breakout! Sell!
Hello,Traders!
CRUDE OIL has broken beneath the rising trendline and retested a supply cluster, confirming an SMC bearish shift as buy-side liquidity was swept before displacement pushed price lower. A continuation toward the target discount zone remains likely. Time Frame 2H.
Sell!
Comment and subscribe to help us grow!
Check out other forecasts below too!
Disclosure: I am part of Trade Nation's Influencer program and receive a monthly fee for using their TradingView charts in my analysis.

Crude Oil Weekly Outlook: Inventory Pressure and 59.7 Key levelBackdrop: The Crude Oil Narrative
The tone in crude oil has been largely defined by a tug-of-war between demand uncertainty and controlled supply. OPEC has maintained its view that global oil demand should continue growing into 2026, but at a modest pace. Despite this, the group has acknowledged noticeable inventory builds worldwide over recent months. That dynamic alone has kept sentiment cautious and has acted as a headwind for sustained rallies.
OPEC+ has also chosen to hold off on further production increases into early 2026. Instead of expanding output, the group is now focusing on capacity assessments and quota alignment among members. This shift signals discipline on the supply side, but also suggests that the group is aware of potential oversupply risk if demand fails to firm up.
Markets have been responding to this mixed backdrop. On one side, controlled supply helps prevent severe breakdowns. On the other, rising inventories and uneven demand expectations limit follow-through on the upside. As a result, price discovery has been driven less by strong directional conviction and more by rotation between value areas, bid blocks, and responsive supply zones. Recent price behavior reflects traders waiting for clearer demand signals before committing to a trend.
What the Market Has Done?
At the end of September the market sold off but found support around the 60.17 area. That initial drop appears to have been triggered by worries about economic growth and a stronger dollar undermining demand.
At the start of October sellers stepped down and held the 62.3 level, which corresponds to the Composite Value area LVN. From that zone prices continued to sell off to 56.0 by mid-October. The continued selloff seems to reflect growing bearish conviction as macro data added to demand fears and inventories remained elevated.
Buyers began to accumulate again, forming bid block 1. From there the market auctioned prices upward back to the 62.3 area where sellers were still present and defended that zone vigorously.
From the last week of October up until the third week of November offers steadily stepped down as the market grinded lower, auctioning price down back toward bid block 1. Buyers responded by stepping up bids and holding the top of bid block 1 range. Throughout the last week of November the market balanced between 59.0 and 57.3, forming bid block 2 with clear buyer accumulation in that area.
In the most recent week, the market balanced between 58.4 (roughly the midpoint of bid block 2) and 59.82 (17 November weekly VPOC). This shifted the weekly value area higher. Last Friday, the market managed a close above the previous week’s VAH, suggesting that buying strength may be gaining momentum.
What to Expect This Coming Week?
The key level to watch is 59.7, which was last week’s VAH.
Bullish scenario
If the market holds above 59.7, anticipate a possible move up toward the 61.0 area, which corresponds to a daily level 1 and the weekly 0.5 SD high.
Expect sellers to possibly defend 61.0.
If price breaks through that zone, the next target is 62.3 (Composite Low Value Area), which is confluent with the weekly 1 SD high.
Bearish scenario
If buyers cannot defend 59.7, the market could drop back through last week’s value area toward 59.0 (previous week’s VAL), confluent with the weekly 0.5 SD Low.
Expect buyers to possibly defend 59.0
Should that support fail, price could move further down toward 58.0 (24 November weekly VPOC), which is confluent with the weekly 1 SD low.
Neutral scenario
If sellers respond at the 61.0 area or if buyers step up at 58.0, the market could balance here and potentially shift value higher as buyers accumulate.
Conclusion
In summary crude oil has been trading under pressure from macroeconomic headwinds and demand concerns while finding support at key zones. The market has rotated between zones and recently shows signs of buyer strength. The key 59.7 level will likely dictate whether price heads toward 61.0 or returns toward 58.0.
What’s your outlook for Crude this week? Drop a comment and give this post a boost so more traders in the community can join the discussion! Thank you.
Disclaimer: This is not financial advice. Trade responsibly and manage your risk carefully.

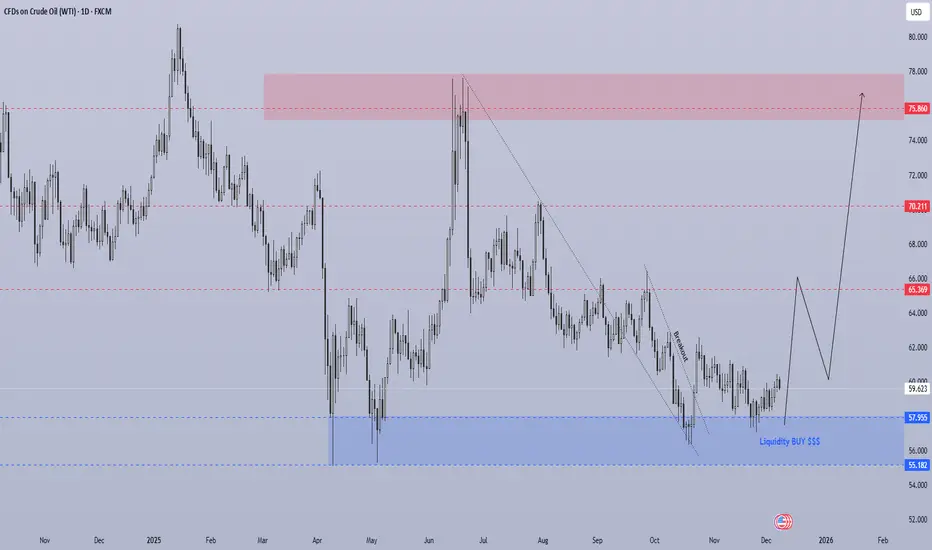
USOIL - WTI - D1Market Structure
Oil has been in a long-term downtrend, but the chart now shows a clear break of the descending trendline, signaling a potential trend reversal.
Price reacted strongly from the blue liquidity zone (55.18 – 57.95) — a major demand area where institutions often buy.
This zone has now formed a double bottom / accumulation structure, indicating strong bullish interest.
2. Key Zones
🔵 Demand Zone (Liquidity BUY Area)
55.18 – 57.95
Multiple liquidity sweeps below 58.00.
Strong reversal candles confirmed buyers.
This is the base for the upcoming bullish leg.
🔴 First Major Resistance / Target
65.36
Previously strong support → now resistance.
Likely first stop for the new bullish trend.
🔴 Second Target Zone (Medium-term)
70.21
Previous major swing level.
A strong resistance zone where partial profits make sense.
🔴 Final High-Probability Target Zone (Premium Supply)
75.86 – 78.00
Large supply area.
Strong reaction expected here.
Best area for large players to sell again.
3. Price Action Outlook
Main Scenario – Bullish Reversal (High Probability)
Price has broken out of the descending structure.
A clean retest or shallow pullback is expected above 58–60 USD.
Strong bullish leg toward:
✔ TP1: 65.36
✔ TP2: 70.21
✔ TP3: 75.86 – 78.00 (Major target zone)
Why bullish?
Break of trendline = momentum shift.
Liquidity sweep at major demand zone.
Multiple rejection wicks show strong buyer control.
No bearish continuation structure forming.
CRUDE OIL (WTI): Confirmed BoS
I see a confirmed bullish break of a significant daily structure
and a candle close above that on WTI Crude Oil.
With a high probability, the market will continue rising and
reach 60.65 resistance soon.
❤️Please, support my work with like, thank you!❤️
I am part of Trade Nation's Influencer program and receive a monthly fee for using their TradingView charts in my analysis.

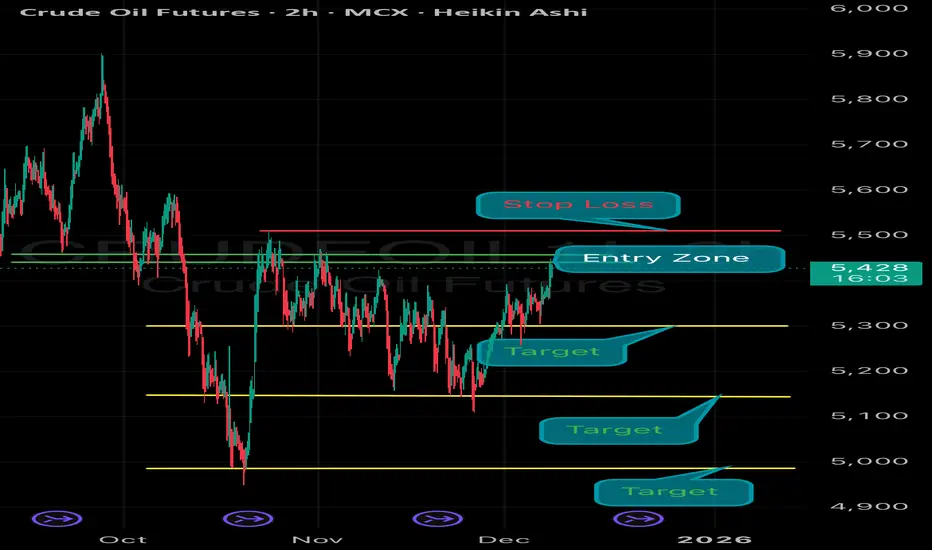
MCX Crude Oil Dec -Bearish Setup The chart has identified a Bearish Opportunity with a well-defined trade structure:
✅ Entry Zone: 5430 – 5440
🔒 Stop Loss: 5510 (Strict SL — no relaxation)
🎯 Target Zone: 5330 - 5200– 5100
⚠️ Risk Management Rule:
Once the trade achieves 1:1 Reward:Risk, immediately shift Stop Loss to Cost-to-Cost to secure the position and reduce downside exposure.
Stay disciplined. Follow levels precisely. 📊🔥
BRIEFING Week #49 : Watch Oil & USDJPYHere's your weekly update ! Brought to you each weekend with years of track-record history..
Don't forget to hit the like/follow button if you feel like this post deserves it ;)
That's the best way to support me and help pushing this content to other users.
Kindly,
Phil

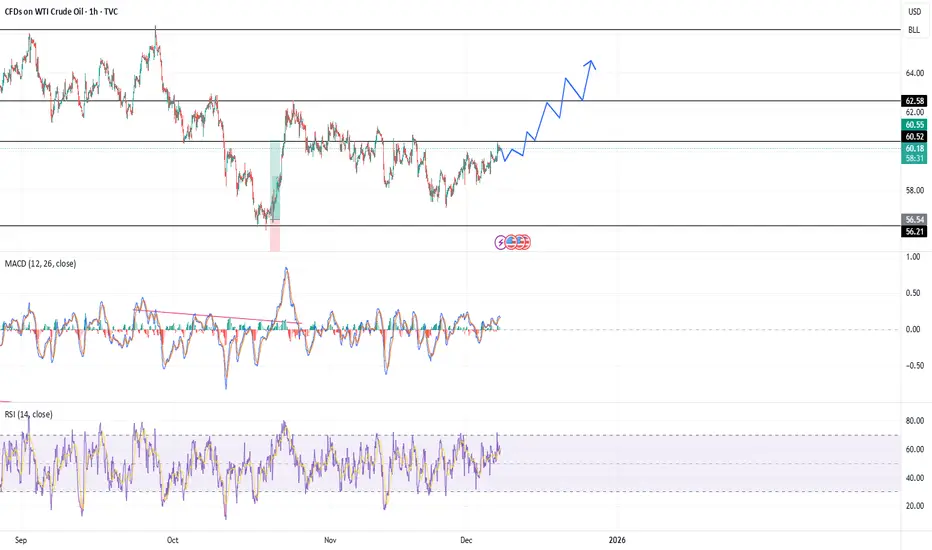
USOIL will have a reversal The price will be reversed based on MCAD line. the bearish trend is exhausted and price will move up probably.
Natural Gas Stock Forecast | Oil | Dollar | Silver | GoldNatural Gas Stock Forecast | Oil | Dollar | Silver | Gold
NYMEX:NG1! NYMEX:CL1! COMEX:GC1! COMEX:SI1!

QS: watching for one more leg downThis could come either via a direct breakdown from current levels or after a lower-high formation in the 13.70–14.60 zone.
Primary support target remains around 8.75
Chart:

07.12.25 Market AnalysisSorry for microphone, but i think i give you important levels of nasdaq, bitcoin, gold, usdjpy, wti and more.. Next week BOJ and FED will come with spicy news :) so be carefula about positions. Better smaller lots..
Thanks for now. Videos will come..
DYOR.
MEC

Will Crude Oil Rise or Fall?Crude Oil Futures (Jan 2026) - Market Analysis
Crude oil is trading at $58.39 per barrel, down 0.19%. Recent data show prices ranging from $58.12 to $58.62, indicating a period of consolidation. Key support is forming around $58.12, while resistance is at $58.62.
The overall momentum suggests limited near-term volatility, with the price hovering near its recent lows. Traders should watch for a breakout above resistance or a drop below support for the next directional move.
Stay tuned for further updates as market conditions evolve, and always manage risk
appropriately when trading futures.
#crudeoil #oilprices #trading #commodities #marketanalysis

Devon Energy 2025: Is the "Old Oil" Giant a Secret Tech Play?Devon Energy (DVN) presents a paradox in late 2025. While five-year investors enjoy triple-digit returns, recent entrants have watched the stock decouple from crude prices. But analyzing Devon through a simple "oil price" lens misses the structural transformation occurring beneath the surface.
M&A & Industry Trends: The Williston Fortress
Devon’s $5 billion acquisition of Grayson Mill Energy was not just about adding barrels; it was a defensive consolidation maneuver. By securing 307,000 net acres in the Williston Basin, Devon effectively locked down the premier remaining inventory in North Dakota.
* Scale: The deal cements Devon as a top-4 producer in the basin, adding 100,000 barrels per day.
* Strategy: This acquisition allows Devon to prioritize "short-cycle" cash flow over risky exploration, funding its massive shareholder return program.
Technology & Science: The AI Power Pivot
The most underreported catalyst for Devon is its aggressive entry into next-gen geothermal energy . Through its strategic partnership with Fervo Energy, Devon is deploying its drilling expertise to solve the AI industry’s biggest bottleneck: 24/7 clean power.
* The Cape Station Project: Located in Utah, this project utilizes Devon’s horizontal drilling patents to create geothermal reservoirs capable of powering hyperscale data centers.
* Innovation Culture: Devon’s internal "Innovate Challenge" operates like a corporate Shark Tank, actively soliciting employee patents for AI-driven drilling optimization.
Geopolitics & Geostrategy: The Trans-Atlantic Bridge
Devon has elevated its business model from selling molecules to selling national security . The 2025 operational landscape sees Devon executing on long-term LNG supply agreements, such as its deal with Centrica, the UK's energy giant.
* Energy Security: By linking US shale gas directly to European grids, Devon insulates itself from domestic Henry Hub price volatility while acting as a geopolitical hedge against Russian energy blackmail.
Macroeconomics & Financial Models: The Buyback Shift
In 2022, Devon was famous for its "variable dividend." In 2025, the strategy has matured. Management is now prioritizing share repurchases over variable payouts, signaling they believe the stock is undervalued.
* The Logic: With free cash flow yields hovering near 9%—double that of the S&P 500—repurchasing shares is mathematically more accretive than cash payouts.
* Balance Sheet: Proceeds from the Grayson Mill integration are also targeting debt reduction, creating a "fortress balance sheet" capable of weathering sub-$70 oil.
Cyber & Patent Analysis: The Digital Oilfield
Devon’s patent portfolio in 2025 reflects a shift toward Operational Technology (OT) defense and environmental surveillance.
* Methane Detection: New patents cover automated dump valve systems and drone-based leak detection, crucial for meeting 2025 EPA methane standards.
* Cyber Resilience: As operations become automated, Devon has increased investment in protecting its SCADA systems from state-sponsored cyber threats, treating data integrity as a tier-one safety metric.
Conclusion: A Strategic Infrastructure Play
Devon Energy is no longer just a proxy for WTI crude. It is a diversified infrastructure company feeding the two hungriest markets of the next decade: European energy security and AI data centers.
Key Takeaway: Investors looking at the lack of variable dividends in 2025 are missing the bigger picture. Devon is reinvesting in a tech-enabled moat that offers growth beyond the price of a barrel of oil.

USOIL Bearish Continuation After Trendline RejectionUSOIL Trade Setup (1H Chart)
Key Levels:
Resistance Trendline: Downward sloping
Support Zone: 59.00 – 59.50
Target Zone: 58.20 – 58.40
“WTI Crude Oil continues to trade within a clear bearish structure, marked by a consistent series of lower highs. The descending trendline shows strong seller control, as price repeatedly fails to break above it.
A major support zone is highlighted around 59.00 – 59.50, where price is currently moving toward after another rejection from the trendline. This reaction confirms the bearish continuation pattern.
If the support zone breaks, the next downside target lies near 58.20 – 58.40, where previous demand and liquidity accumulation occurred.
As long as price remains below the descending trendline, the bearish bias stays intact. Only a clean 1H close above the trendline would weaken this bearish setup.”
Trend: Strong bearish continuation
Bias: Sell below trendline
Support Zone: 59.00 – 59.50
Next Targets: 58.20 → 58.40
Invalidation: Breakout and close above the descending trendline
