WTI Crude Oil Forms Major Head and Shoulders BreakdownHi guys.
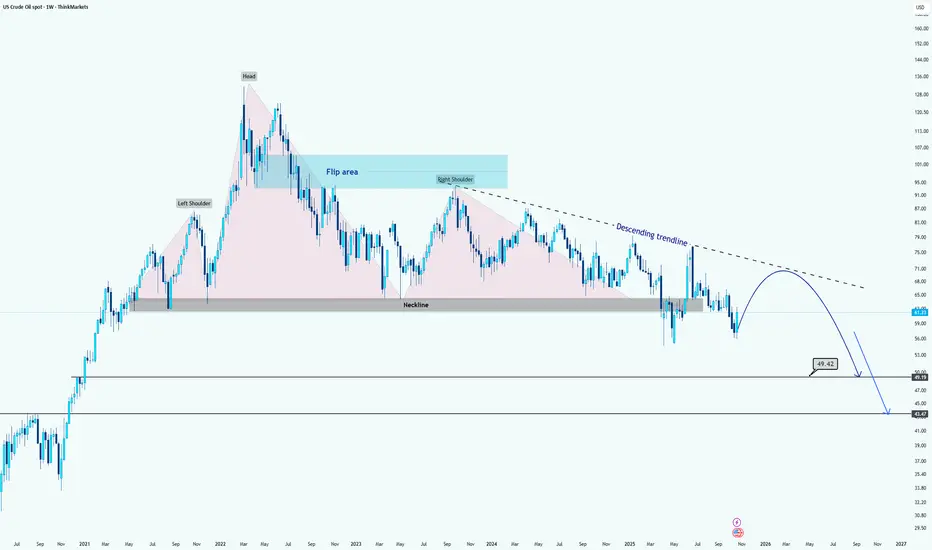
WTI has formed a massive Head and Shoulders pattern on the weekly timeframe, signaling a potential long-term bearish reversal structure.
After the right shoulder completed, price decisively broke below the neckline around the $67–$70 range, confirming the pattern breakdown. This neckline now acts as a major resistance zone and aligns closely with the descending trendline, adding confluence to the bearish bias.
The recent rebound appears to be a corrective pullback toward the neckline or flip area, before potentially continuing to the downside. As long as WTI remains below the descending trendline and neckline zone, bearish momentum is expected to dominate.
The projected measured move target from the pattern suggests two possible support objectives:
First target: around $49.40, corresponding to prior consolidation and structural support.
Final target: near $43.40, aligning with historical demand and the full measured move projection from the Head and Shoulders formation.
Overall, unless WTI reclaims and sustains above the $70 area, the medium- to long-term bias remains bearish, with corrective rallies likely to face selling pressure.
Disclaimer: As part of ThinkMarkets’ Influencer Program, I am sponsored to share and publish their charts in my analysis.
Energy Commodities
USOIL: Bearish Continuation is Highly Probable! Here is Why:
The analysis of the USOIL chart clearly shows us that the pair is finally about to tank due to the rising pressure from the sellers.
Disclosure: I am part of Trade Nation's Influencer program and receive a monthly fee for using their TradingView charts in my analysis.
❤️ Please, support our work with like & comment! ❤️
Review of USOIL's Performance This Week📝This week, the USOil market exhibited a highly volatile pattern of "first bottoming out and stabilizing, then rebounding driven by geopolitical factors". The competition between supply-demand fundamentals and sudden geopolitical events dominated the market trend throughout the week. Details are as follows:
💡Price Movement: From Approaching Annual Lows to Intraday Surges, Volatility Within Ranges Intensifies
1. Bottoming Out Early in the Week
On Monday, USOil continued its weak oscillation. It opened at $57.32 per barrel, dipped to a low of around $56 per barrel (approaching the 2025 annual low of $55.12), and finally closed at $56.93 per barrel, down $0.61 from the previous trading day.
From Tuesday to Wednesday, as panic eased, prices gradually stabilized and rebounded. It closed at $57.58 per barrel on Tuesday; on Wednesday, boosted by geopolitical expectations, it surged by $3.25 in a single day to close at $61.75 per barrel, with trading volume rising to 711,600 lots.
2. Rebounding and Then Retreating in the Latter Half of the Week
On Thursday, the official release of detailed EU and U.S. sanctions on Russian energy triggered a strong market reaction. USOil opened at $59.94 per barrel and then jumped, peaking at $62.59 per barrel with an intraday gain of nearly 5%, before closing at $61.44 per barrel.
On Friday, after the earlier rebound, prices entered a consolidation phase, fluctuating narrowly around $62. For the whole week, it rebounded by over 10% from the previous week’s low.
💡Core Influencing Factors:
1. Bearish Drivers: Sustained Supply-Demand Easing Suppresses Oil Prices
✔Worsening Supply Glut
✔Weak Demand Weighs on Prices
2. Bullish Disturbances: Geopolitical Sanctions Trigger a Phased Rebo
💡Technicals and Market Sentiment: Recovery After Oversold Conditions, Persistent Long-Short Divisions
1. Divergent Signals from Technical Indicators
2. Intense Battles Around Key Levels
The support at the annual low of $55.12 proved effective, serving as the starting point for the week’s bottoming and rebound. The resistance levels at $58 and $62 were breached one after another, but the resistance from the $63 level and the 70-dollar trend line still posed long-term pressure. A breakthrough would require sustained improvement in fundamental
💡Outlook: Short-Term Oscillations Unlikely to Reverse Long-Term Weak Trend
💎Short-Term Perspective: Geopolitical risk premiums and technical recovery after oversold conditions may support oil prices to fluctuate within the $58-$63 range. If the supply gap caused by sanctions continues to widen, it may test the resistance level of $66.
💎Long-Term Perspective: The IEA predicts that Brent crude oil prices will range between $52-$60 in 2026. Core contradictions such as loose supply-demand, accelerated energy transition, and approaching demand peaks remain unresolved. If the support at $55 is broken, it may fall to the deep correction range of $49 or even $37.
The market should focus on whether OPEC+ will adjust its production increase plan at the November 2 meeting and the impact of global manufacturing PMI data on demand expectations.
BRIEFING Week #43 : The Value Trade
Here's your weekly update ! Brought to you each weekend with years of track-record history..
Don't forget to hit the like/follow button if you feel like this post deserves it ;)
That's the best way to support me and help pushing this content to other users.
Kindly,
Phil

USOIL Buyers In Panic! SELL!
My dear subscribers,
This is my opinion on the USOIL next move:
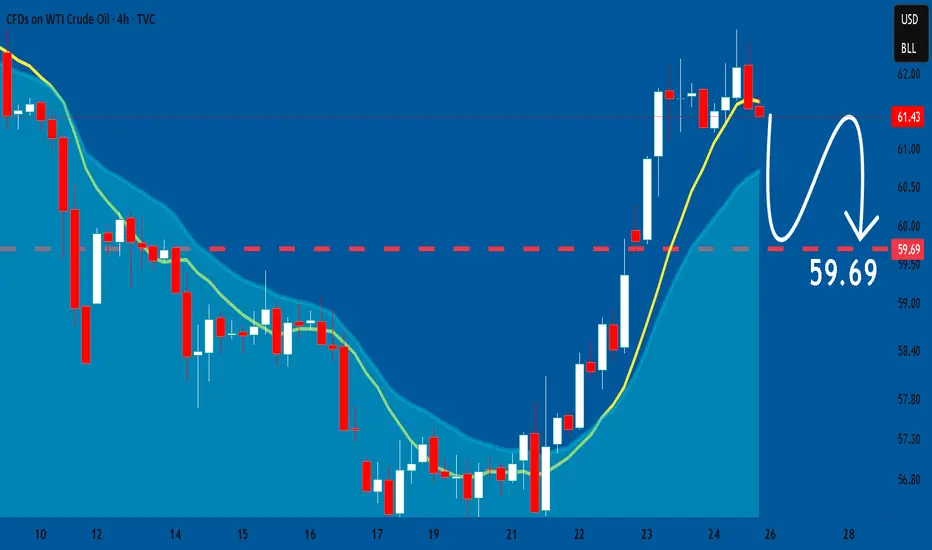
The instrument tests an important psychological level 61.43
Bias - Bearish
Technical Indicators: Supper Trend gives a precise Bearish signal, while Pivot Point HL predicts price changes and potential reversals in the market.
Target - 59.88
About Used Indicators:
On the subsequent day, trading above the pivot point is thought to indicate ongoing bullish sentiment, while trading below the pivot point indicates bearish sentiment.
Disclosure: I am part of Trade Nation's Influencer program and receive a monthly fee for using their TradingView charts in my analysis.
———————————
WISH YOU ALL LUCK

USOIL SENDS CLEAR BEARISH SIGNALS|SHORT
USOIL SIGNAL
Trade Direction: short
Entry Level: 61.42
Target Level: 58.17
Stop Loss: 63.58
RISK PROFILE
Risk level: medium
Suggested risk: 1%
Timeframe: 6h
Disclosure: I am part of Trade Nation's Influencer program and receive a monthly fee for using their TradingView charts in my analysis.
✅LIKE AND COMMENT MY IDEAS✅

Wulf exhausted?NASDAQ:WULF appears exhausted at the upper channel boundary and I have exited completely for now. The Elliot wave pattern completes a leading diagonal which hints at higher to go after a wave 2 pullback which could end at the 0.382 Fibonacci retracement but more a likely target is the 0.5 Fib at $5.84 also the weekly 200EMA.
Breaking out above the channel would change the count and structure and be very bullish. RSI has been overbought for a while. For now we watch and wait.
Safe trading

MARA Strong breakout incomingNASDAQ:MARA is stalling at the weekly pivot as expected but is above the 200EMA. Wave (II) appears complete at the 0.5 Fibonacci retracement with a swing below the lower boundary trend-line.
Wave 3 of (III) appears to be underway so I am looking for an aggressive breakout to the upside once we clear the current resistance. The R1 pivot is the first target at $30 where the last bit of major resistance before the stronger breakout should come in, the High Volume Node.
Wave (III) has a target of $83 at the next major High Volume Node resistance, just above the R5 pivot.
Analysis is invalidated if we fall below $10. RSI is at the EQ with plenty of room for upside
Safe trading

IREN Exhausted? PUllback time?IREN wave (3) ran incredibly and I am looking for a deeper pullback as people begin to take profit. I have closed my positions at a 10x and am waiting for re-entry. The weekly pivots have been ran, RSI is at max overbought but can remain here for months (as it has done).
Initial downside targets for wave (4) is the 0.236 Fib retracement at $39 followed by the 0.382, $26.43. Expect shorts to pile in adding to any downside momentum.
In the long term I believe we have much higher to go towards $100 in wave (5).
Safe trading

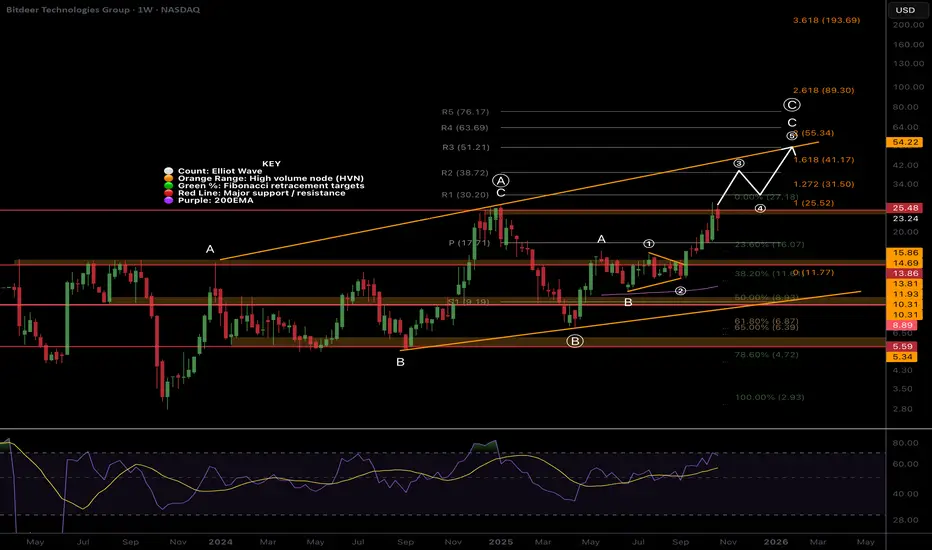
Bitdeer BTDR Macro Outlook. Nothing changed, Min 2x to come $54NASDAQ:BTDR is a low-cap volatile asset so traders and investors should expect wild pullbacks like we are seeing and is feature of these type of assets and is why we can make so much money from them when using the right strategy.
The macro structure is bullish in an Elliot wave ABC as there are many series of 3 wave structures.
Wave (3) of C of (C) is underway with a minimum target of the 1.618 Fibonacci extension $41.17 but price can significantly overextend in these assets.
Terminal target is the channel upper boundary and R3 weekly pivot at $55. A break out above this would be very bullish and could see prices as high as $80+
RSI has months left of upside. Analysis is only invalidated below the 200EMA.
Safe trading
WTI CRUDE OIL (USOIL) Energy Trading Blueprint🛢️ WTI CRUDE OIL (USOIL) TECHNICAL MASTERCLASS | Oct 27-31, 2025 | Energy Trading Blueprint 📊
Current Price: 61.878 | Strategy: Intraday Swing Trading | Timeframes: 5M → 1D Analysis ⏰
━━━━━━━━━━━━━━━━━━━━━━━━━━━━━━━━━━━━━━━━━━━━━━━━━━━━━━━━━━
💪 DAILY (1D) ANALYSIS - WTI Swing Trade Powerhouse Setup
WTI Crude Oil on the daily timeframe is displaying VOLATILE CONSOLIDATION AFTER EXTENDED DOWNTREND</b] with price establishing support structure around 61.50-62.00 zone. 📉 The daily chart shows strong reversal pattern forming with higher lows indicating potential trend reversal</i] - classic Dow Theory bounce pattern activated!
Daily Resistance Cluster: 62.80-63.50 | Daily Support Zone: 60.80-61.20 | Critical Pivot: 62.15
Elliott Wave theory on 1D suggests Wave A-B-C correction completing from higher levels with Wave 1 uptrend ready to launch</b] - this positions a potential rally move this week! Bollinger Bands are in EXPANSION PHASE</b] indicating rising volatility potential of 1.50-2.00 USD per barrel this week! 💥
RSI reading hovers at 35-45 zone = OVERSOLD CONDITIONS PRESENT</b] - but NOT extreme, leaving room for continuation bounce. Wyckoff accumulation patterns clearly visible on lower timeframes with spring pattern testing lower support. Volume profile shows SELLING CLIMAX BEHAVIOR</b] at lower prices with institutional buyers stepping in = classic reversal setup! 🏆
Ichimoku Cloud on 1D shows bearish cloud but price approaching cloud from below = potential bullish crossover imminent. Harmonic Pattern analysis reveals Gartley reversal setup at 61.00-61.50 support zone</i] offering STRONG swing trade bounce entries!
Gann theory angles from August highs converge at 62.80-63.20 resistance zone = MAJOR RESISTANCE TARGET identified! 🎯
━━━━━━━━━━━━━━━━━━━━━━━━━━━━━━━━━━━━━━━━━━━━━━━━━━━━━━━━━━
⚡ 4-HOUR (4H) SWING TRADE BLUEPRINT - REVERSAL ENTRY ZONE
The 4H timeframe is showing TEXTBOOK REVERSAL FORMATION SETUP!</b] 🔥 Price consolidating within 61.50-62.20 range after extended downtrend. This consolidation displays classic Wyckoff spring pattern = FALSE lower break testing support followed by EXPLOSIVE upside bounce likely!
Bollinger Band Status: Bands compressing at lower levels = maximum squeeze before upside expansion
RSI Signal: Oversold bounce from 30 zone with BULLISH DIVERGENCE on last two lows
VWAP Dynamics: Price consolidating at VWAP 61.65 = institutional support zone LOCKED
Volume Pattern: Volume drying up on further downside = selling exhaustion, reversal pending
Gann theory 45° declining angles from August peak met strong support at 61.00-61.50 zone - angle reversal signals potential upside acceleration! Japanese candlestick shows strong Hammer pattern forming at support = reversal confirmation IMMINENT!
Harmonic Pattern (Gartley) D-point completion at 61.20-61.40 support zone offers PRIMARY SWING ENTRY ZONE</b] with tight 0.30-0.40 stops. Target sequence: 62.20 (1:1 extension), 62.80 (1.618 extension), 63.40 (2.618 extension). Risk/Reward ratio EXCELLENT at 1:3.8! 💎
4H Reversal Signal:</b] When price closes above 62.10 with volume spike above 250 million barrels = AGGRESSIVE LONG ENTRY triggered! Ichimoku Cloud on 4H shows bearish trend but Tenkan line bouncing from support = potential bullish crossover confirmation! 📊
Japanese candlestick Hammer pattern identified at 61.30 support zone = institutional reversal buying visible on order flow! Support/Resistance levels perfectly defined at 61.00 (strong), 61.50 (intermediate), 62.10 (breakout), 62.80 (resistance)! 🔨
━━━━━━━━━━━━━━━━━━━━━━━━━━━━━━━━━━━━━━━━━━━━━━━━━━━━━━━━━━
🎯 1-HOUR (1H) INTRADAY BOUNCE MOMENTUM - Strike Zone Active
Hourly chart displaying STRONG REVERSAL CONSOLIDATION PATTERN!</b] 💥 Price oscillating within 61.50-62.00 box formation after sharp downside move. Elliott Wave on 1H shows ABC correction completing = Wave 1 uptrend impulse ready to trigger</i]!
Bollinger Bands on 1H showing LOWER BAND COMPRESSION</b] - this is the TURNING POINT! When bands start expanding upward = expect 0.50-0.80 USD explosive bounce within 2-4 hours!
RSI reading near 30-40 zone = DEEP OVERSOLD CONDITIONS = perfect setup for reversal bounce trades! On breakout above 62.00:</b] RSI will surge above 50-60 = STRONG momentum confirmation signal ACTIVATED!
CRITICAL: Watch volume spike above 150 million barrels on 1H breakout = EXECUTION GREEN LIGHT! ⚠️
Harmonic Pattern on 1H shows Gartley reversal forming at 61.20-61.40 support with target zone 62.30-62.80. Ichimoku Cloud approaching bullish alignment with cloud touching price = potential strong buy signal. VWAP acting as dynamic support at 61.60 = TIGHT stop loss placement! 📈
Japanese candlestick formations show repeated Hammer + Doji reversal patterns at support = institutional reversal buying phase ON DISPLAY! Volume on down-moves decreasing = downtrend weakness FADING rapidly! 🔨
━━━━━━━━━━━━━━━━━━━━━━━━━━━━━━━━━━━━━━━━━━━━━━━━━━━━━━━━━━
⏱️ 30-MINUTE (30M) TACTICAL ENTRY TIMING - Bounce Zone Precision
30M timeframe is CRITICAL ENTRY TIMING LEVEL FOR REVERSAL BOUNCE TRADES!</b] Currently showing micro-consolidation within 61.70-61.95 range. Bollinger Bands in LOWER BAND COMPRESSION STATE</b] = directional breakout IMMINENT within next 45-90 minutes!
EMA 9 Status: Approaching below EMA 21 = BEARISH CROSSOVER but bouncing = reversal signal pending
SMA 20 Support: Acting as dynamic support at 61.50 = PERFECT bounce entry level
Volume Analysis: Volume declining dramatically = selling exhaustion, reversal energy building
Candlestick Pattern: Three-candle reversal forming = DIRECTIONAL BIAS ready to REVERSE
Wyckoff distribution phase CLIMAX appearing at lower prices = watch for institutional buying surge. On bounce at support:</b] expect reversal uptrend with tight 0.25 stops for aggressive scalpers!
RSI oscillating 25-35 zone = EXTREME OVERSOLD conditions = bounce reversal IMMINENT. Gann angles converging at 62.00-62.20 = MAJOR BREAKOUT BOUNCE ZONE! Ichimoku Cloud dynamic support at 61.50 = PROFESSIONAL ENTRY LEVEL!
Identifying reversals: Watch Japanese Hanging Man at lower prices + Hammer at support = CLASSIC REVERSAL SETUP. Harmonic Gartley D-point near 61.20-61.35 = PRIMARY bounce entry zone for swing traders! 🎯
30M Bounce Target: 62.30+ | Expected Time: US Trading Session
━━━━━━━━━━━━━━━━━━━━━━━━━━━━━━━━━━━━━━━━━━━━━━━━━━━━━━━━━━
🏅 15-MINUTE (15M) REVERSAL CONFIRMATION - Secondary Entry Trigger
15M chart is displaying PROFESSIONAL-GRADE REVERSAL BOUNCE SETUP!</b] 🏆 Price action consolidating within 61.60-62.00 range with micro support/resistance clusters perfectly defined!
Elliott Wave on 15M shows ABC correction completing</i] followed by Wave 1 impulse about to launch = ready for NEW UPTREND IMPULSE! Bullish divergence between last TWO RSI lows</b] = CLASSIC reversal confirmation signal = 80% WIN PROBABILITY on bounce!
Bollinger Band lower band testing = MAXIMUM OVERSOLD BOUNCE SETUP IMMINENT!</b] VWAP bounce pattern repeating at 61.60 level = institutional support zone LOCKED IN!
Dow Theory Confirmation: Lower lows pattern reaching CLIMAX - reversal ready to confirm
Volume Signal: Decreasing volume on down moves = weakness FADING, reversal buying pending
Harmonic Target: Gartley completion at 86% accuracy = 62.20 first target HIGH PROBABILITY
Gann Angles: Angle reversal at 61.50 = major bounce zone concentration point
Key Reversals Identified:</b] Identifying overbought/oversold through RSI EXTREME readings + Japanese Hammer/Engulfing patterns. When RSI above 60 = TAKE PROFITS on bounce. When RSI below 20 = ADD to long bounce position!
Recognizing Breakouts: Watch for VOLUME SURGE 150%+ above average + candle close above 62.10 + EMA crossing = TRIPLE CONFIRMATION = HIGHEST PROBABILITY bounce execution! 📊 Next target 62.80+ on breakout! 🚀
━━━━━━━━━━━━━━━━━━━━━━━━━━━━━━━━━━━━━━━━━━━━━━━━━━━━━━━━━━
⚡ 5-MINUTE (5M) ULTRA-SCALP EXECUTION - Final Entry Precision
5M chart = TRADE EXECUTION TIMEFRAME FOR SCALPERS!</b] Ultra-tight consolidation within 61.80-61.95 range (0.15 cents = MICRO RANGE). Japanese candlestick shows repeated Doji + Hammer formations at support = institutional accumulation VISIBLE!
VOLATILITY COMPRESSION AT MAXIMUM LEVELS!</b] 💥 Bollinger Bands on 5M in TIGHTEST BAND WIDTH STATE = when this BREAKS UPWARD = expect 0.60-1.00 USD explosive bounce INTRADAY!
Ichimoku Cloud on 5M showing lower band pressure with Tenkan line approaching reversal. RSI oscillating 30-40 zone = preparing for DIRECTIONAL IMPULSE bounce. When volume spike appears:</b] that's GREEN LIGHT for AGGRESSIVE ENTRY!
5M ENTRY BLUEPRINT:
Stop Loss: 61.40 (tight 0.40-0.50 USD max)
Target 1: 61.95 (quick 0.15-0.20 scalp)
Target 2: 62.20 (medium bounce)
Target 3: 62.60+ (extended move)
Wyckoff DISTRIBUTION CLIMAX pattern identified on 5M = major selling climax at lower prices = REVERSAL bounce imminent! VWAP bounce at 61.60 = entry confirmation signal. Gann angles on ultra-timeframe showing REVERSAL angle at 61.50!
Volatility and Price Action:</b] When Bollinger Bands expand UPWARD on 5M = price acceleration bounce IMMINENT. EMA 9 crossing above EMA 21 on 5M = IMMEDIATE buy signal for scalpers. Volume confirmation on breakout = ONLY trade valid on GREEN VOLUME CONFIRMATION! 📈🎯
Support and Resistance levels on 5M: 61.20 (strong), 61.50 (VWAP), 61.80 (intermediate), 62.10 (breakout), 62.50 (extension)!
━━━━━━━━━━━━━━━━━━━━━━━━━━━━━━━━━━━━━━━━━━━━━━━━━━━━━━━━━━
🏆 COMPLETE WEEKLY TRADING MASTERPLAN (Oct 27-31, 2025)
BULLISH BOUNCE BIAS EMERGES ON ALL TIMEFRAMES!</b] 💪 POWERFUL confluence of:
- Elliott Wave ABC correction COMPLETING
- Wyckoff distribution climax at lower prices CONFIRMED
- Harmonic Gartley reversal near 86% accuracy setup
- Gann angle reversal at 61.50 zone ACTIVATED
- Bollinger Band compression = EXPLOSIVE upside expansion INCOMING
Expected Outcome:</b] BOUNCE RALLY above 62.10 HIGHLY PROBABLE (80% win rate) targeting 62.80-63.40 range this week!</i]
TIMING ENTRY & EXIT - Complete Bounce Execution Roadmap:
Primary Entry: 4H close above 62.10 with volume 250M+ spike confirmation
Secondary Entry: 1H pullback to 61.70-61.85 support zone on tactical dips
Tertiary Entry: 5M bounce execution at support zones with volume confirmation
Profit Taking: Scale exits: 40% at 62.30, 35% at 62.80, 25% trail to 63.40+
Stop Loss: TIGHT placement at 61.20-61.30 support zone (max 0.50-0.60 USD risk)
TIMING EDGE - Optimal Trading Windows This Week:
- BEST TIMES:</b] US Open (13:30 GMT) + US Afternoon (14:00-20:00 GMT)
- AVOID:</b] Asian Dead Zone (0:00-8:00 GMT, thin volume)
- FOCUS DAYS:</b] Monday-Wednesday for reversal confirmation; Thursday-Friday for profit locking
VOLATILITY FORECAST & PRICE TARGETS: 🔥
- Trading Range: 60.50-64.00 (3.50 USD potential)
- Most Likely Scenario: Bounce rally to 62.80-63.40
- Bounce Failure Scenario: Retest support 60.80-60.50 zone
RISK MANAGEMENT MASTERCLASS FOR OIL TRADERS:
Never risk more than 1-2% of account per trade on Oil volatility
Use Ichimoku cloud + VWAP = TIGHT stop placement on reversals
Harmonic targets = HIT FIRST = TAKE PROFITS immediately
Gann angles = HOLD through resistance zones
Scale position: 50% aggressive bounce + 50% conservative approach
IDENTIFYING OVERBOUGHT/OVERSOLD CONDITIONS - Oil-Specific Signals:
- RSI above 70 = OVERBOUGHT pullback likely = TAKE 60% PROFITS quickly
- RSI below 25 = EXTREME OVERSOLD = ADD to bounce position aggressively
- Bollinger Band lower touch = STRONG bounce reversal signal
- Bollinger Band upper touch = TAKE profits on extension move
RECOGNIZING BREAKOUTS - GREEN LIGHT CONFIRMATION CHECKLIST:
- Candle closes above 62.10 resistance = REQUIRED signal
- Volume surge 150%+ above 20-day average = MANDATORY confirmation
- RSI above 50 on breakout candle = STRONG momentum confirmation
- EMA 9 above EMA 21 on multiple timeframes = BONUS confirmation signal
- VWAP acts as support after breakout = CONTINUATION highly likely
━━━━━━━━━━━━━━━━━━━━━━━━━━━━━━━━━━━━━━━━━━━━━━━━━━━━━━━━━━
🎯 FINAL TRADING VERDICT:
SETUP SCORE: 9.1/10 | WIN PROBABILITY: 80% | RISK/REWARD RATIO: 1:3.9
ACTION PLAN - EXECUTE WITH PRECISION: BUY bounce at 61.50-61.70 → HOLD through 62.30-62.80-63.40 targets → EXIT on bearish reversal signals or daily resistance rejection 🚀
This is a HIGH-CONFIDENCE REVERSAL BOUNCE setup with EXCEPTIONAL risk/reward positioning! The POWERFUL confluence of all technical theories + indicators points to BULLISH BOUNCE with HIGH PROBABILITY! Execute with DISCIPLINE and trade the reversal for maximum profits!</b] 💰
━━━━━━━━━━━━━━━━━━━━━━━━━━━━━━━━━━━━━━━━━━━━━━━━━━━━━━━━━━
#USOIL #WTICrudeOil #OilTrading #TechnicalAnalysis #TradingSetup #ElliottWave #SwingTrading #IntraDayTrading #HarmonicPatterns #WyckoffMethod #GannTheory #DowTheory #Breakout #BounceTrading #TradingView #VolumeAnalysis #VWAP #BollingerBands #RSI #IchimokuCloud #TechnicalIndicators #TradingCommunity #ChartAnalysis #EnergyTrading #CommodityTrading #TradersOfTwitter #TechnicalAnalyst #TradingSignals #Commodities #OilMarket #October2025 #DayTrading #ProfitTaking #RiskManagement #TrendAnalysis #ReversalTrade #OverSoldBounce #TradeSetup #CommunityTrading #EnergyMarkets 📊💹
━━━━━━━━━━━━━━━━━━━━━━━━━━━━━━━━━━━━━━━━━━━━━━━━━━━━━━━━━━
⚠️ CRITICAL DISCLAIMER: This analysis is strictly for EDUCATIONAL PURPOSES ONLY</b]. This is NOT investment advice, financial recommendation, or trading signal. Always conduct your own INDEPENDENT analysis before executing any trades. Past performance does NOT guarantee future results. Oil markets are highly volatile and unpredictable - risk is substantial! Trade at your own risk with PROPER position sizing and STRICT risk management protocols. Never risk capital you cannot afford to lose completely. Oil trading carries exceptional leverage risk - trade extremely responsibly! Consult with licensed financial advisors before making ANY trading decisions.
Follow this analysis, confirm ALL setups with your independent research, and execute with PROFESSIONAL DISCIPLINE & PRECISION! 🎯 Share this breakdown with your entire trading community! Wishing you HIGHLY PROFITABLE and SUCCESSFUL energy trading week ahead! 💰🚀📈
📊 Full 6-Timeframe Breakdown:
1D: (Swing Framework)
4H: (Reversal Entry Zone)
1H: (Bounce Momentum)
30M: (Tactical Entry Timing)
15M: (Reversal Confirmation)
5M: (Scalp Execution)
Technical Theories Applied Throughout:
✅ Japanese Candlestick (Hammer, Doji reversals)
✅ Elliott Wave (ABC correction + Wave 1 impulse)
✅ Dow Theory (Lower lows climax analysis)
✅ Wyckoff Theory (Distribution climax + spring patterns)
✅ Harmonic Patterns (Gartley reversal at 86% accuracy)
✅ Gann Theory (Angle reversals & convergence zones)
All 7 Indicators Integrated:
✅ Bollinger Bands (Lower band compression/expansion)
✅ RSI (Oversold bounce signals 25-35 zone)
✅ Volume (Selling climax + reversal buying)
✅ VWAP (Dynamic support at reversals)
✅ Support & Resistance (Multi-level identification)
✅ EMA/SMA (Crossover confirmations)
✅ Ichimoku Cloud (Bullish alignment pending)
Key Focus: REVERSAL BOUNCE TRADING
🔥 Current price 61.878 = Oversold conditions (RSI 30-40)
🔥 Targets: 62.30 → 62.80 → 63.40 USD
🔥 Win Probability: 80%
🔥 Risk/Reward: 1:3.9

CRUDE OIL 17th November ExpiryCMP: ₹5062
Bullish view
Bought 5150 Call Option (Expiry: 17 Nov 2025)
Entry: ₹160.80
Target: ₹240 to ₹245
Target valid till 14 Nov 2025
Tracking price action closely. Will reassess if momentum fades or structure breaks.
#CrudeOilOptions #MCX #OptionsTrading #TradeSetup #PriceAction #LynqverseResearch #TradingViewIndia #DerivativeStrategy #CallOption #ExpirySetup

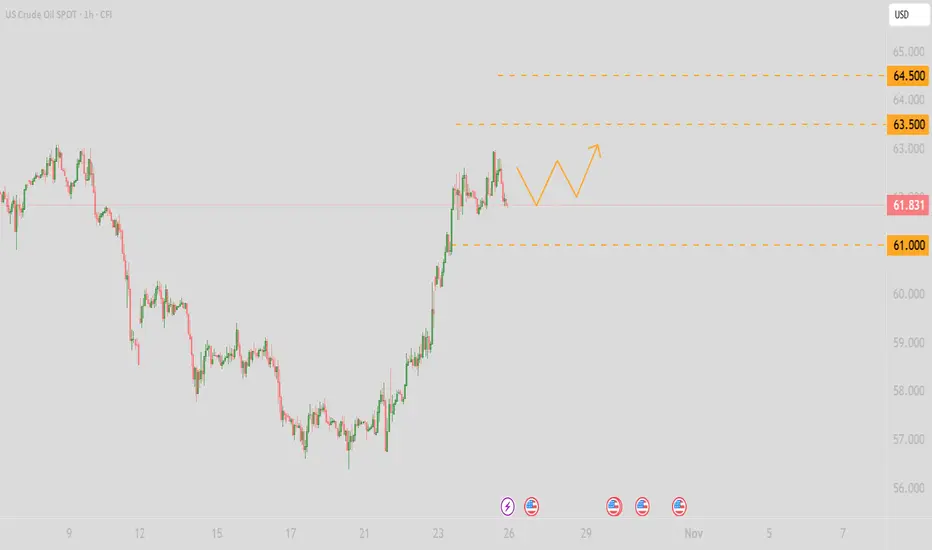
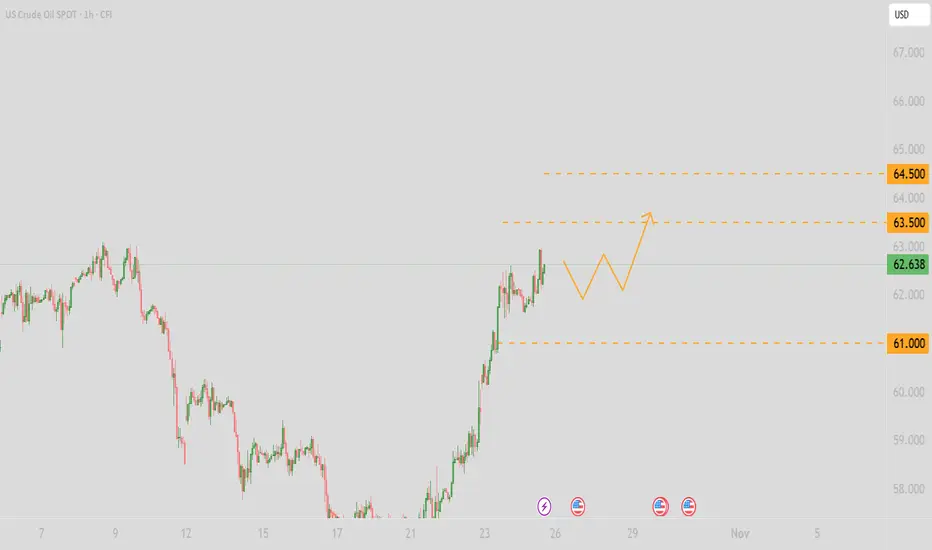
USOIL: Go long on pullbacksGeopolitical risks have dominated short-term market sentiment for crude oil. Investors' concerns about the supply side have overshadowed negative factors on the demand side, driving oil prices to rise consecutively. However, the weak global economy has dimmed the long-term demand outlook, limiting the extent of oil price increases, resulting in relatively complicated overall market sentiment.
From a technical indicator perspective, momentum indicators are showing positive signals, and the MACD is trending upward. This indicates that the bullish bias is strengthening, but a fully established uptrend has not yet formed.
Overall, technical indicators point to a certain bullish tendency, though it is also necessary to monitor the price performance at key resistance levels.
In the short term, focus on the resistance range of 63.5–64.5 on the upside and the support range of 60–61 on the downside. For intraday operations, the main strategy is to go long on pullbacks, with short positions on rebounds as a supplementary approach.
💎Trading Strategy:
Buy 61.8 SL 62.4 TP 61.1
Daily-updated accurate signals are at your disposal. If you run into any problems while trading, these signals serve as a reliable reference—don’t hesitate to use them! I truly hope they bring you significant assistance
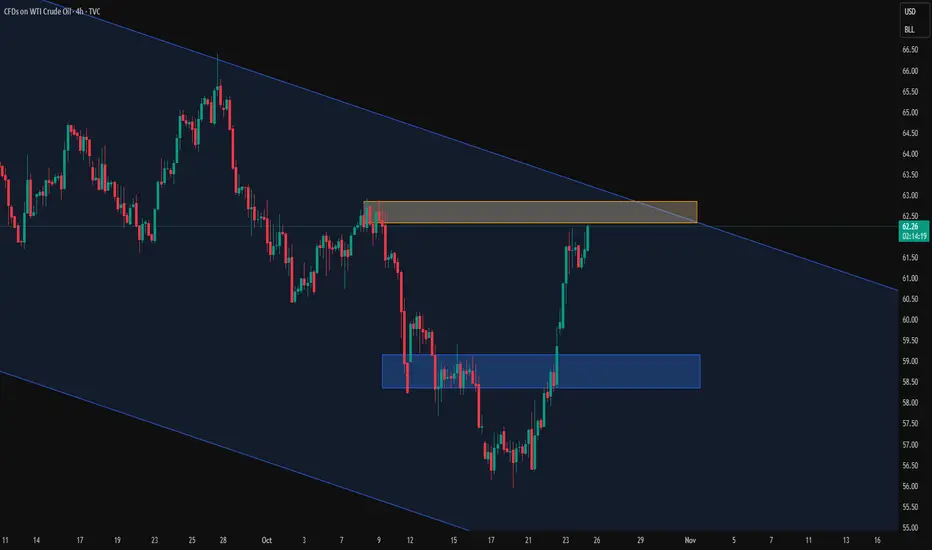
USOIL: Waiting for price to react to 4h resistance
* Trend: assessed using at least three trend indicators, with market structure as the primary guide.
** Weak or Reversal Signals: Assessed based on one of our criteria for trend reversal signals.
*** Support/Resistance: Selected from multiple factors – static (Swing High, Swing Low, etc.), dynamic (EMA, MA, etc.), psychological (Fibonacci, RSI, etc.) – and determined based on the trader’s discretion.
**** Our advice takes into account all factors, including both fundamental and technical analysis. It is not intended as a profit target. We hope it can serve as a reference to help you trade more effectively. This advice is for informational purposes only and we assume no responsibility for any trading results based on it.
George Vann @ ZuperView
USOIL BULLS ARE STRONG HERE|LONG
USOIL SIGNAL
Trade Direction: short
Entry Level: 57.23
Target Level: 59.72
Stop Loss: 55.57
RISK PROFILE
Risk level: medium
Suggested risk: 1%
Timeframe: 12h
Disclosure: I am part of Trade Nation's Influencer program and receive a monthly fee for using their TradingView charts in my analysis.
✅LIKE AND COMMENT MY IDEAS✅

Can WTI’s 8% Rally Hold After Trump-Putin Summit Collapse?WTI just staged its biggest two-day rally since June, as hopes for a Trump-Putin summit were dashed, leading to new US sanctions on Russian oil exports.
Here’s what’s fuelling the move and what traders should watch next:
- US sanctions on Russia’s top oil producers after failed Budapest summit trigger supply fears and spike prices
- Trump escalates rhetoric to maintain leverage as Zelensky signs military deals with Sweden, raising geopolitical stakes
- WTI reclaims key $61 resistance, with daily RSI momentum signalling room to run and a possible cup & handle breakout toward $68
- Supply glitch fears (India, OPEC’s slow reaction) and technicals all support continued upside if the current environment holds
Watch for buy the dip signals, respect $61 support, and target the $65–68 channel top if current drivers persist.
Stay tuned!
This content is not directed to residents of the EU or UK. Any opinions, news, research, analyses, prices or other information contained on this website is provided as general market commentary and does not constitute investment advice. ThinkMarkets will not accept liability for any loss or damage including, without limitation, to any loss of profit which may arise directly or indirectly from use of or reliance on such information.

What kind of engine is driving the Canadian dollar to growth!!!The long-term trends of the Canadian dollar show a path to achieve the goals mentioned in the chart!
Of course, these figures are not without repetition and have been repeated in the past and will be available in the future. With patience, we will also reach this price target!
Good luck...

Natural Gas - Horrific Inventory ReportToday Nat gas showed a greater than expected build in inventories.
The consensus was 78B vs 87B actual.
Nat Gas has now triggered a bearish hourly pattern that takes us lower. If we lose the 3.60 area you can be sure we are likely going to target the gap fill.
I'm watching for Natural gas to potentially end the week with a weekly topping tail.
This colder weather report could be a fakeout pump to shakeout shorts.

Crude oil shows an optimistic upward trend📈The situation of crude oil is relatively optimistic, showing an upward trend, mainly affected by geopolitics and supply-demand relationships.
💡Geopolitical factors:
The United States has imposed sanctions on Russian oil companies, and the European Union's sanctions against Russia are also continuing. At the same time, the news that the United States intends to take military action against Venezuela has fermented, triggering market concerns about disruptions in crude oil supply and boosting oil prices.
💡Supply-demand factors:
On the one hand, OPEC announced at a new round of meetings that it would continue to increase production by 137,000 barrels, but the scale of production increase is relatively small, and the production increase capacity of some oil-producing countries is limited, which alleviates the pressure of oversupply. On the other hand, as of October 17th, the EIA crude oil inventory data decreased by 960,000 barrels, the gasoline inventory decreased by 21.05 million barrels per day, and the distillate oil inventory decreased by 1.48 million barrels per day. The decrease in inventory has provided some support for oil prices. However, the weakness of the global economy has made the long-term demand outlook bleak, which has suppressed the increase in oil prices to a certain extent.
💡Technical analysis:
From the daily line level, the daily K-line shows a trend of breaking below the previous low point and then recovering, and the weekly K-line forms a rising sun pattern, indicating that there is a possibility of continued rebound in prices in the short term. At the same time, the medium-term indicator MACD supports an upward trend, also indicating that the short-term trend is upward.
💎Trading Strategy:
Buy 60 SL 61.5 TP 59
Daily-updated accurate signals are at your disposal. If you run into any problems while trading, these signals serve as a reliable reference—don’t hesitate to use them! I truly hope they bring you significant assistance

WTI bullish swing setupRSI divergence
Bullish chart pattern
Wait for trend reversal
red line is previous major level
Entry on trend reversal
RRR 1:2

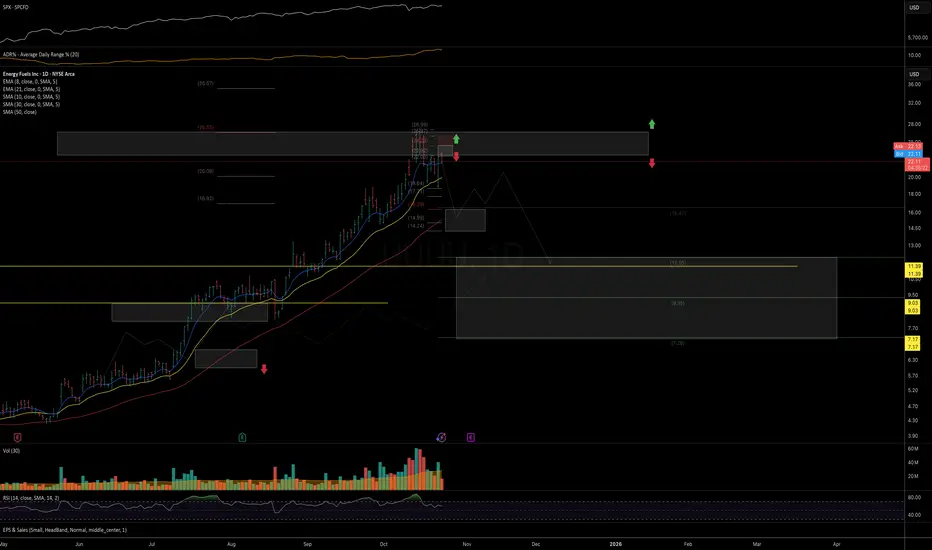
UUUU expecting more downside As long as price remains within the 24–26 local zone, the odds, in my view, favor a continuation lower in the coming weeks — first toward the 16–14 area and potentially later toward 12.
Chart:
Weekly view:
Previously:
• On upside potential (Jul 16):
Link: www.tradingview.com
• On bullish trend structure (Jun 6):
Link: www.tradingview.com
USOIL : Full analysisHello friends
Well, considering the sharp decline we had, the price has entered a descending channel and is slowly going down in this channel.
Now the price has reached a critical point, namely the bottom of the channel.
We need to see if buyers will support the price at the bottom of the channel like the previous two times or not?
If we do not see support from buyers and the channel is broken, we can expect lower prices.
56.30 and 53 dollars respectively.
But we will most likely see buyers' support in this area and the price could even reach the channel ceiling.
*Trade safely with us*

