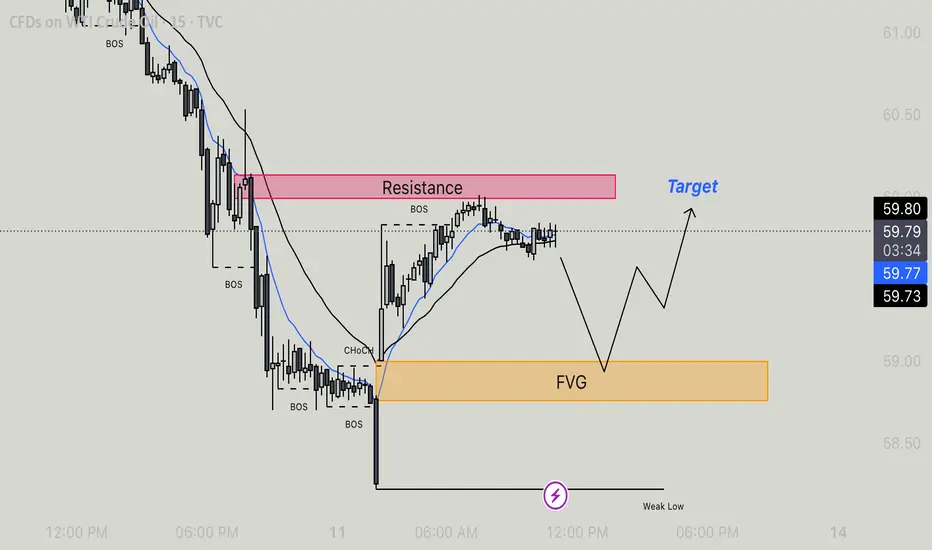
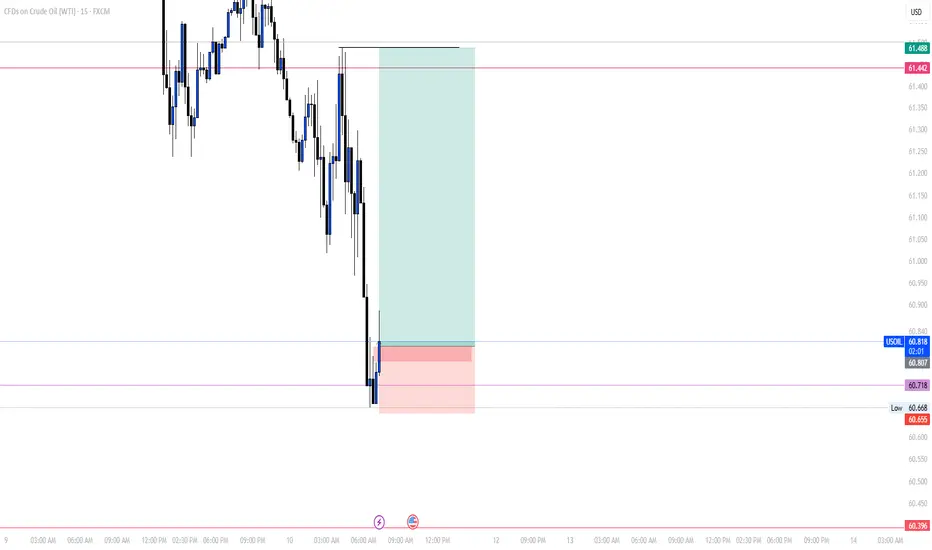
Usoil - Retracement to FVG Before Bullish ContinationMarket Structure & Key Levels
Resistance Zone: Price reacted from this supply area, showing short-term rejection after BOS (Break of Structure) to the upside.
FVG (Fair Value Gap): Price is expected to retrace into this imbalance zone for demand before resuming higher. Watch for bullish price action here.
Weak Low: If price breaks this low, the bullish scenario becomes invalid and deeper downside may follow.
Structure Highlights:
BOS (Break of Structure): Several BOS points confirm previous bearish trend and recent short-term bullish correction.
CHoCH (Change of Character): Marked at the base of reversal near FVG zone, indicating possible trend shift.
EMA Confluence: Price hovering around short EMAs, showing possible slowdown and setup for a pullback.
Trade Scenario
Expected Move:
Price could retrace to the FVG zone (imbalance fill) before a bounce.
From there, bullish momentum may resume toward the target zone above resistance.
Bullish Confirmation:
Look for price to tap into the FVG, form bullish structure (e.g., BOS, CHoCH), and engulfing patterns or lower-timeframe entries.
Target would be near recent highs or break above resistance at ~$59.90–60.00.
Invalidation:
Break below the Weak Low would invalidate this bullish setup and open room for further downside.
Energy Commodities
Gold | Oil | Dollar | Silver | Natural Gas Price ForecastGold | Oil | Dollar | Silver | Natural Gas Price Forecast
COMEX:GC1! COMEX:SI1! NYMEX:CL1! AMEX:UNG

BRIEFING Week #41 : Havoc on CryptosHere's your weekly update ! Brought to you each weekend with years of track-record history..
Don't forget to hit the like/follow button if you feel like this post deserves it ;)
That's the best way to support me and help pushing this content to other users.
Kindly,
Phil

Profit Blueprint on XNG/USD! Is This the Bullish Energy Move?😎 Steal the Show with XNG/USD: The "Thief" Day Trade Blueprint! 🚨
Asset: XNG/USD (Natural Gas CFD) - Energies MarketVibe: A cheeky, calculated heist to snag profits with a slick Ichimoku breakout strategy! 💰
📜 The Master Plan: Ichimoku Kijun Line Breakout
🎯 Confirmed Bull Trend: The price has broken above the Ichimoku Kijun-Sen line, signaling a bullish move in the Natural Gas CFD market. This breakout is our green light to execute the "Thief Strategy" with precision!
🕵️♂️ Entry: The Thief’s Layered Approach
🔍 How It Works: The "Thief Strategy" uses a layering method with multiple buy limit orders to scale into the trade safely, protecting your capital while maximizing profit potential. No fear, just finesse! 😎
Buy Limit Layers:
🥉 2.960
🥈 2.980
🥇 3.000
🏆 3.020
💡 Pro Tip: Add more layers based on your risk appetite and account size for extra flexibility!
Alternative Entry: If you prefer a single entry, jump in at the current market price after the Kijun-Sen breakout confirmation. Your call, Thief OG! 😏
🛑 Stop Loss: Protect Your Loot!
🚨 Thief Stop Loss: Set at 2.900, just below the breakout level to guard against reversals.
Customize It: Adjust your stop loss based on your risk tolerance and strategy. This is your heist—own it!
Note: Dear Thief OG’s (Ladies & Gentlemen), I’m not dictating your stop loss. Manage your risk and keep your profits safe! 💪
🎯 Target: Escape Before the Trap!
🏃♂️ Profit Target: Aim for 3.150, where strong resistance, overbought conditions, and a potential trap await. Cash out before the "police" (market reversal) catch you!
Note: You’re the mastermind here. Take profits at your own discretion—don’t let me cap your gains! 💸
🔗 Correlation & Related Markets to Watch
Natural Gas (XNG/USD) often correlates or reacts with:
ICMARKETS:XBRUSD (Crude Oil Brent) – Energy sector movements can impact gas demand.
FOREXCOM:USOIL (Crude Oil WTI) – Supply/demand shocks in oil can spill into gas pricing.
OANDA:XAUUSD (Gold) – Inflation hedge & safe-haven flows can influence energy sentiment indirectly.
TVC:DXY (US Dollar Index) – A stronger/weaker dollar impacts commodity pricing.
SP:SPX (S&P 500 Index) – Risk-on/risk-off sentiment across markets.
Keeping an eye on these pairs helps confirm energy market momentum and macro sentiment.
Key Correlation Point: Natural Gas prices often lead or lag other energy markets due to supply/demand dynamics and seasonal factors. Confirm your trade with cross-asset analysis for a sharper edge! 📊
🧠 Why This Setup Rocks
Ichimoku Precision: The Kijun-Sen breakout is a reliable signal for short-term bullish momentum.
Layered Entry Safety: The Thief Strategy’s multiple limit orders spread risk and allow scaling without overcommitting.
Risk Management: Clear stop loss and target levels keep your heist disciplined and profitable.
Market Context: Energy markets are volatile, but this setup leverages technical confirmation to ride the wave. 🌊
✨ If you find value in my analysis, a 👍 and 🚀 boost is much appreciated — it helps me share more setups with the community!
#ThiefStrategy #XNGUSD #NaturalGas #Ichimoku #DayTrading #EnergyMarkets #TradingView

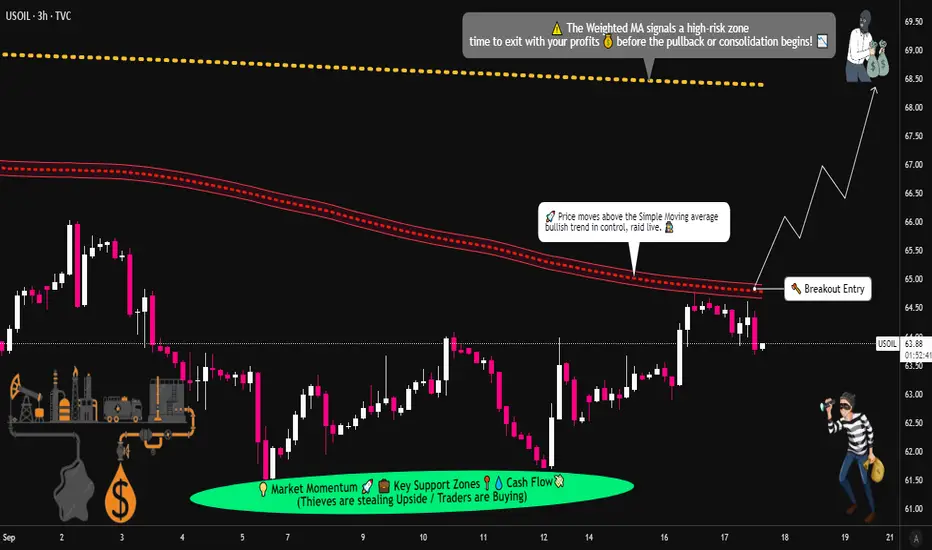
Can USOIL Break Higher? SMA Breach & Target at $68🛢️ USOIL Energy Market | Cash Flow Management Strategy (Swing/Day Trade)
📌 Trading Plan:
👉 Bias: Bullish (pending order setup)
👉 Confirmation: When Simple Moving Average (SMA) is breached by buyers, trend confirmation is valid.
👉 Entry Style: Layered buy-limit entries after breakout confirmation (Thief Strategy 🕵️♂️ = multi-layer entry).
📥 Layered Buy Limit Orders (example setup):
64.00 ✅
64.50 ✅
65.00 ✅
65.50 ✅
(You can increase the number of layered entries based on your own style — flexibility is the thief’s edge!)
⚠️ Important: Buy-limit layers are only valid AFTER breakout confirmation. Do not jump in without confirmation.
🎯 Risk Management (SL & TP):
📌 Stop Loss (Protective Level)
Example stop placement: 63.50
(🔑 Note: This is my style. Manage risk in your own way — never copy-paste without adapting!).
📌 Target Zone
Projected resistance near 68.00, aligned with:
Weighted Moving Average (WMA) resistance
Overbought conditions
Possible “trap” zone ⚠️
💡 Best approach: Secure profits step by step. Escape once the target region is approached.
📢 Note for Traders (Thief OG’s):
I’m not recommending only my SL or my TP. This is just a framework. You’re responsible for your own money management, profits, and exits. Trade at your own risk, and take the bag when you feel it’s right. 💰
🔗 Correlation & Related Pairs to Watch:
Energy markets are heavily correlated across multiple assets:
🛢️ TVC:USOIL / BLACKBULL:WTI – Main setup
🛢️ BLACKBULL:BRENT – Moves in sync with USOIL, watch for confirmation
💵 TVC:DXY – Stronger USD often pressures crude oil prices
💹 AMEX:XLE (Energy Sector ETF) – Tracks US energy stocks, gives indirect flow confirmation
🪙 FX:NGAS – Energy sector cousin, can sometimes give early signals of demand shifts
Keep an eye on these related pairs/assets for flow confirmation and stronger conviction.
🧾 Key Points Recap:
✔️ SMA breach = buyers’ control confirmed
✔️ Layered entries (Thief Strategy 🕵️♂️)
✔️ Stop loss = personal choice (mine @63.50)
✔️ Target = 68.00 escape zone
✔️ Risk & reward = your own responsibility
✔️ Watch related assets for confirmation
✨ “If you find value in my analysis, a 👍 and 🚀 boost is much appreciated — it helps me share more setups with the community!”
#USOIL #WTI #CrudeOil #EnergyMarkets #SwingTrade #DayTrade #TradingStrategy #PriceAction #ThiefStrategy #LayeredEntries #XLE #BRENT #DXY #NGAS
WTI Oil Shorting Opportunity | Technical + Macro Confirm📌 WTI CRUDE OIL | Money-Making Thief Plan 🛢️ (Swing/Day Trade)
🗡️ Thief Strategy Plan (Bearish Bias)
Plan: Bearish setup confirmed — sellers in control after MA rejection of bulls 📉
Entry (Layered Style):
63.000 🔪
62.500 🔪
62.000 🔪
61.500 🔪
(You may increase or adjust layers based on your own plan)
Stop Loss (Thief SL): @64.000 ❌
⚠️ Adjust SL according to your risk & strategy
Target (Thief TP): Key resistance zone + overbought trap @4.6700 🎯
Note: Dear Ladies & Gentlemen (Thief OG’s) — I don’t recommend locking only my TP. Take your profits wisely & manage risk responsibly. 💰
❓ Why This Plan?
Moving average rejection confirms sellers’ dominance ⚔️
Technical indicators showing strong sell bias 📉
Layered entry strategy helps in catching moves efficiently 🎯
Oversupply risk + weak demand = bearish fuel 🔥
Retail & institutions both leaning short-side heavy 🐻
🔍 Market Analysis (Technical + Fundamental + Macro + Sentiment)
📊 Real-Time Price Action - Sep 05
Daily Change: -1.03%
Monthly Change: -2.84%
Yearly Change: -8.44%
😊 Retail & Institutional Sentiment
Retail Traders: 35% 🐂 | 55% 🐻 | 10% 😐
Institutional Traders: 30% 🐂 | 60% 🐻 | 10% 😐
🌡️ Fear & Greed Index
Current: 25/100 — Fear 😟
Mood: Cautious, driven by oversupply fears + weak demand
⚒️ Fundamental Score: 40/100 (Bearish)
U.S. crude inventories unexpectedly +2.42M vs. -2.19M expected 📈
OPEC+ considering production increase 🌍
Weak China demand signals 📉
🌐 Macro Score: 35/100 (Bearish)
Fed rate cut expectations (25bp likely in September) 💸
Global slowdown fears 🌎 (Europe + Asia weak data)
Geopolitical risks (Russia-Ukraine) limited impact 🚨
🏁 Overall Market Outlook: Bearish (Short Bias) 🐻
Declining prices + rising inventories + OPEC+ supply hike risk
Technicals = Strong Sell (daily/weekly)
Sentiment favors sellers across the board
🔮 Key Takeaway
WTI/USOIL remains heavy under supply pressure + demand weakness.
Market sentiment is fearful, with both retail & institutions leaning short.
⚡ Keep eyes on U.S. jobs data + OPEC+ decisions for any trend shifts.
📌RELATED PAIRS TO WATCH
BRENT CRUDE ( TVC:UKOIL ): $66.42 (-1.8% daily)
NATURAL GAS ( FX:NGAS ): $2.84 (-0.7% daily)
ENERGY ETFS: XLE, USO, UCO
OANDA:CADJPY : Oil-correlated currency pair
ENERGY STOCKS: NYSE:XOM , NYSE:CVX , NYSE:COP , NYSE:SLB
✨ “If you find value in my analysis, a 👍 and 🚀 boost is much appreciated — it helps me share more setups with the community!”
#USOIL #WTI #CrudeOil #ThiefTrader #EnergyMarkets #Commodities #OPEC #SwingTrade #DayTrade #OilAnalysis

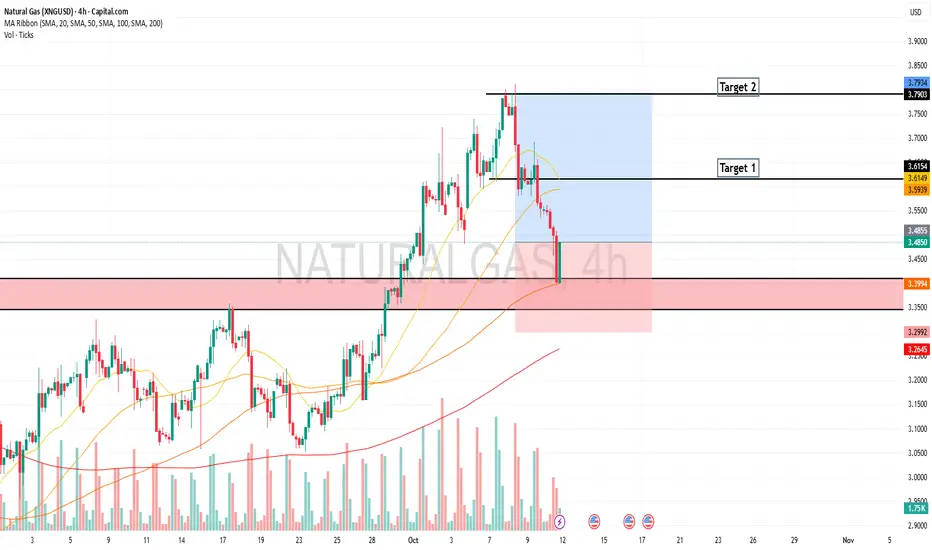
The Natural Gas Will Jump from a Support LevelHello Traders
In This Chart Natural Gas HOURLY Forex Forecast By FOREX PLANET
today Natural Gas analysis 👆
🟢This Chart includes_ (Natural Gas market update)
🟢What is The Next Opportunity on Natural Gas Market
🟢how to Enter to the Valid Entry With Assurance Profit
This CHART is For Trader's that Want to Improve Their Technical Analysis Skills and Their Trading By Understanding How To Analyze The Market Using Multiple Timeframes and Understanding The Bigger Picture on the Charts
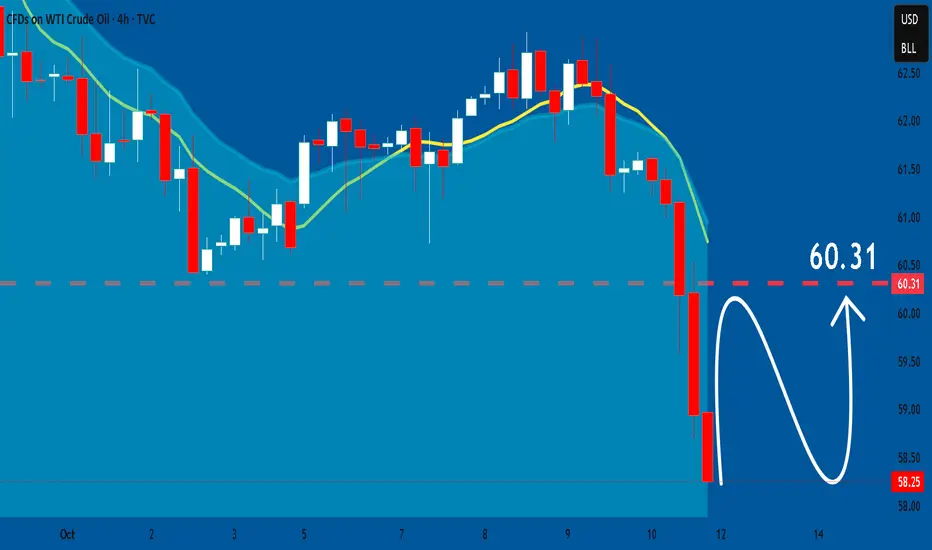
USOIL LONG FROM SUPPORT
USOIL SIGNAL
Trade Direction: long
Entry Level: 58.26
Target Level: 60.45
Stop Loss: 56.80
RISK PROFILE
Risk level: medium
Suggested risk: 1%
Timeframe: 1h
Disclosure: I am part of Trade Nation's Influencer program and receive a monthly fee for using their TradingView charts in my analysis.
✅LIKE AND COMMENT MY IDEAS✅

THE FALL OR REST OF THE METAL-XAUUSDThe Prime minister of the market, GOLD has proven over the past weeks of ITs "SAFE HAVEN STATUS"
The shutdown in USA economy an added advantage as investors reroute the money into the metal creating multiple ALL TIME HIGHS (ATH) historically
However despite this impressive rise, a dumb, retracement or entirely change in trend is likely on the map technically,
The new week would sweep the early sellers and their SL before the fall my bias.

USOIL: Bullish Forecast & Outlook
The analysis of the USOIL chart clearly shows us that the pair is finally about to go up due to the rising pressure from the buyers.
❤️ Please, support our work with like & comment! ❤️
WTI with bearish momentum dominatingDue to a larger-than-expected increase in crude oil inventories, WTI prices fell. From the daily chart perspective, oil prices have broken below the lower edge of the trading range, and the medium-term objective trend is downward. Currently, oil prices are fluctuating near the lower edge of this range. The fast and slow lines of the MACD indicator are below the zero line, with bearish momentum dominating. It is expected that the probability of oil prices moving in an oscillating downward pattern in the medium term is relatively high.
Sell 60 - 60.2 TP 59 - 59.5 SL 60.5
Daily-updated accurate signals are at your disposal. If you run into any problems while trading, these signals serve as a reliable reference—don’t hesitate to use them! I truly hope they bring you significant assistance

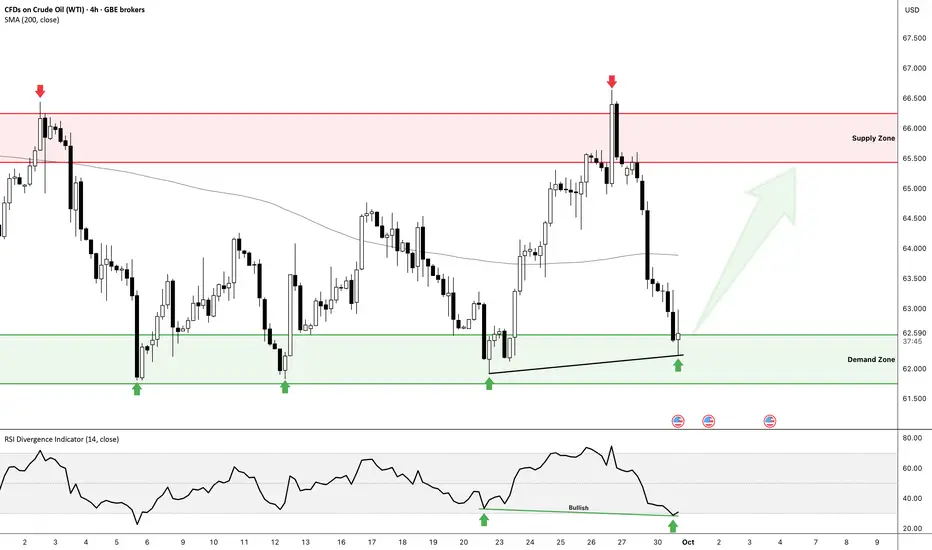
OIL Set for another bounce - 65 Target in Play📊 NFX GBEBROKERS:USOIL Chart Update
Fresh setup spotted:
Price tapped into demand zone and bounced cleanly.
Bullish RSI divergence confirmed → momentum shift to the upside.
Eyeing the supply zone above as the next key test.
🎯 Bias:
As long as demand holds, I’m favoring longs into supply.
Break below demand = setup invalidated.
Stay disciplined - this is a textbook demand-to-supply play.
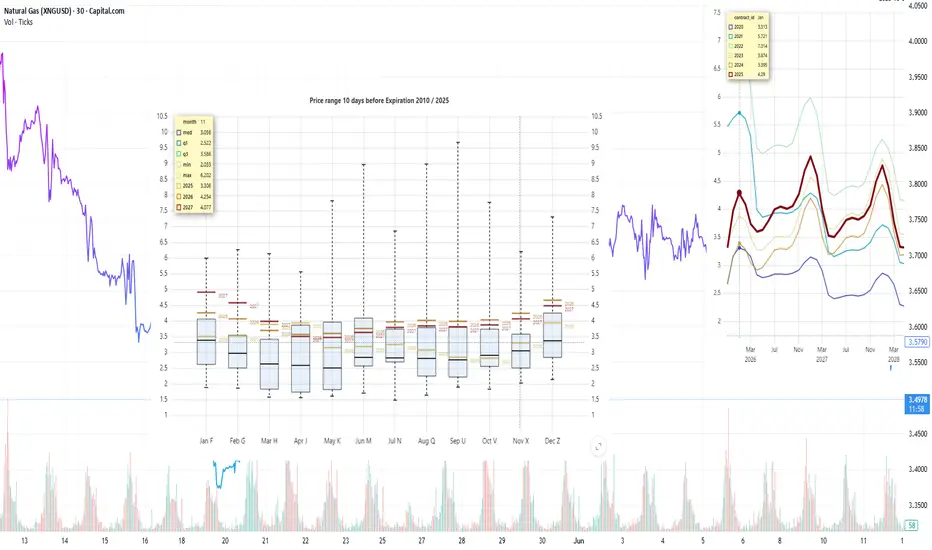
LNG Week 41: 89 BCF Storage Surge Drives Mild Weather Trends*Due to the platform's features, the charts are arranged in sequence from left to right, from the first to the Eighth chart. The charts were created by our team and based on an analysis from Bloomberg and the EIA data.
Current prices compared to price dispersion 10 days before expiration by month since 2010
The NGX25 contract is trading above its 10-day average and showing increased volatility during this period. Quotes for 2026 winter contracts remain above the upper limit of the interquartile range.
Forward curve compared to 2020-2025
The shape of the forward curve in 2025 demonstrates stability and converges even more closely with the configurations recorded in 2023 and 2024 for comparable dates. This trend is particularly evident in contracts with delivery in three years or more, where prices are converging steadily toward historical levels.
Current stocks and forecast for next week compared to 2019-2024
According to the forecast for week 40 (September 29 – October 5), gas reserves in underground storage facilities will increase by +89 BCF, reaching 3,560 BCF, which exceeds the figure for the same period last year. The growth in reserves is supported by high production volumes and mild weather conditions.
Weekly HDD+CDD sum based on current NOAA data and forecast for the next two weeks compared to 1994-2024
In week 40 of this year, HDD+CDD indicators for the continental United States are still below the average values for the last 30 years of observations, but there has been a significant increase compared to last week's forecast, which is clearly visible in the graph for 2025. The forecast for week 41 also indicates that this trend will continue: a further decline in values relative to historical levels is expected, which may ease pressure on prices by increasing demand and energy prices.
Explanation of the graph: the candles represent quantiles for 30 years from 1994 to 2024. Red dots represent 2024, green dots represent 2025, and blue dots represent the 2025 forecast.
Weekly HDD+CDD sum based on current NOAA data and forecast for the next two weeks compared to 1994-2024 by region
A steady trend is observed in the leading regions: HDD+CDD values in 2025 remain below the historical averages for 1995–2024 in virtually all areas. The lag in indicators corresponds to the generally mild weather of the season and reduced energy demand for heating and cooling, which is recorded in all major regions, but there is an upward trend that has been growing from revision to revision over the last 6 days.
Weekly total supply/demand difference compared to 2014-2024
This week, the difference between supply and demand in 2025 is at the average for 2014–2024, but lower than in 2024.
Number of days of supply from storage facilities
The graph shows the number of days of supply from storage facilities alone, based on current consumption levels. In 2025, February–March reserves will be at 10–18 days, which is comparable to or slightly below average. From May to August, stocks will increase to 25–35 days, which is slightly below the 10-year average. By the beginning of October 2025, the number of days of consumption from stocks will increase to 35 days, which is at the lower end of the IQR. The moderate level of storage adequacy to meet current demand creates a fundamentally tighter market, where even moderate production disruptions or minor spikes in demand can cause disproportionate price reactions, especially in late winter and early spring.
Anomalies in weather (HDD+CDD) and fundamental factors
Overall, fundamental factors and weather anomalies are within the expected range, with no systemic deviations, except for isolated declines in LNG exports from 07-10 caused by technical work at the Sabine terminal.
*This analysis was conducted in cooperation with Anastasia Volkova, analyst of LSE.
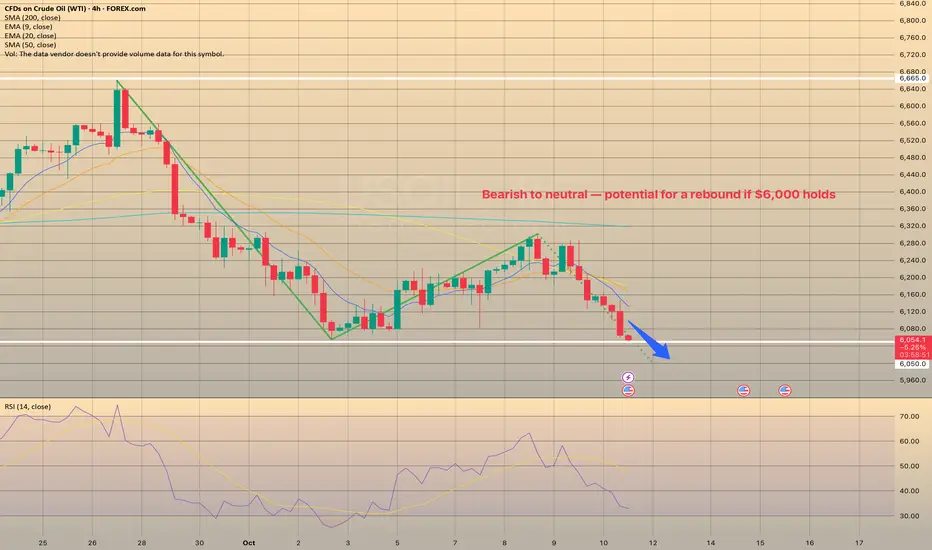
Oil Market: Bearish to neutral — potential for a rebound if $6,0Oil Market: Bearish to neutral — potential for a rebound if $6,000 holds
Crude and gasoline prices fell on Oct. 9 as market sentiment shifted amid rising supply expectations.
OPEC+ agreed to raise output by 137,000 bpd starting November, well below expectations of a 500,000 bpd hike. The group continues to unwind earlier cuts, aiming to restore 1.66 million bpd of production by year-end. OPEC’s September output rose 400,000 bpd to 29.05 million bpd, a 2.5-year high.
On Oct. 10 supply concerns eased after Israel accepted a U.S.-brokered cease-fire deal in Gaza, reducing geopolitical risk premiums. Still, new U.S. sanctions on Iran—targeting over 50 entities linked to oil and LPG trade—helped limit further losses.
Russian supply disruptions remain a supportive factor after drone attacks forced shutdowns at key refineries, while floating storage volumes fell 7% week-on-week to 82.8 million barrels, signaling tighter near-term supply.
Meanwhile, Iraq’s plan to resume Kurdish exports (up to 500,000 bpd) could weigh on prices, offsetting some of the geopolitical support.
EIA data showed U.S. crude inventories 4.5% below the 5-year average, with production up 0.9% w/w to 13.63 million bpd, near record highs. Active U.S. oil rigs slipped by two to 422, just above the four-year low.
Outlook:
Crude oil continues to display a bearish short-term structure, extending its recent downtrend after failing to sustain above the $6,300–$6,350 resistance zone. The price has now revisited the local support area around $6,050–$6,000, which has acted as a key pivot level in recent sessions.
ANZ Research expects near-term downside risks amid higher OPEC+ supply and weaker refinery demand, though low stockpiles outside China may cushion prices into 2026.
A clean rebound from $6,000 could trigger a short-covering move toward $6,200–$6,300.
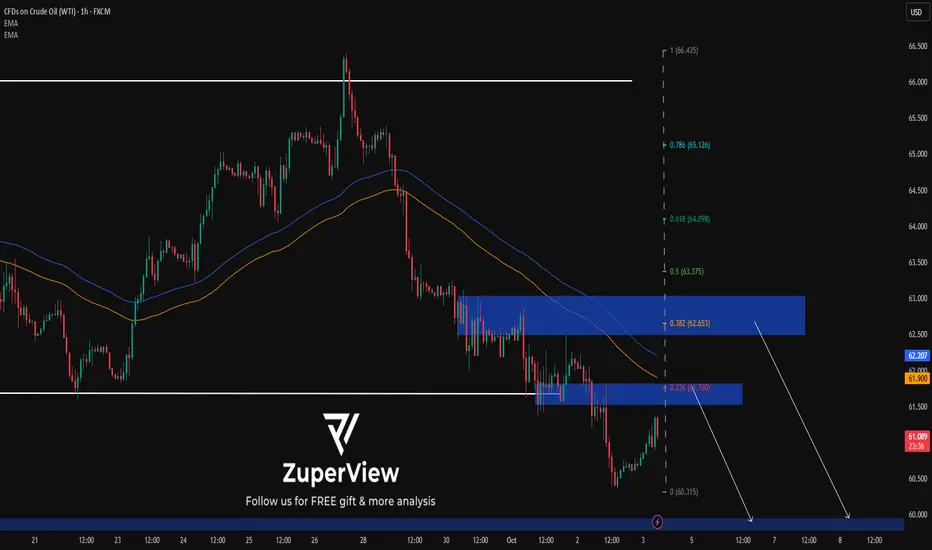
USOIL: Price breaks out of sideways – sell on pullbackTo better understand my current outlook on USOIL, please refer to my previous higher-timeframe and fundamental analyses.
This could be a position trade in anticipation of a larger downtrend on the daily timeframe, but there's risk involved due to the upcoming Non-Farm Payrolls (NFP) report this Friday.
* Trend: assessed using at least three trend indicators, with market structure as the primary guide.
** Weak or Reversal Signals: Assessed based on one of our criteria for trend reversal signals.
*** Support/Resistance: Selected from multiple factors – static (Swing High, Swing Low, etc.), dynamic (EMA, MA, etc.), psychological (Fibonacci, RSI, etc.) – and determined based on the trader’s discretion.
**** Our advice takes into account all factors, including both fundamental and technical analysis. It is not intended as a profit target. We hope it can serve as a reference to help you trade more effectively. This advice is for informational purposes only and we assume no responsibility for any trading results based on it.
Please like and comment below to support our traders. Your reactions will motivate us to do more analysis in the future 🙏✨
George Vann @ ZuperView
CRUDE OIL REBOUND AHEAD|LONG|
✅WTI OIL has tapped into the demand level after a sharp decline, showing signs of accumulation. A reaction from this discount area could drive price higher toward 61.10$, where liquidity above minor highs is resting. Time Frame 2H.
LONG🚀
✅Like and subscribe to never miss a new idea!✅

BUY USOILOur trade today on USOIL is bullish, you can buy following the same levles as mine.
We bought after that the market did a liquidity sweep and gave us a reversal.
Follow for more!
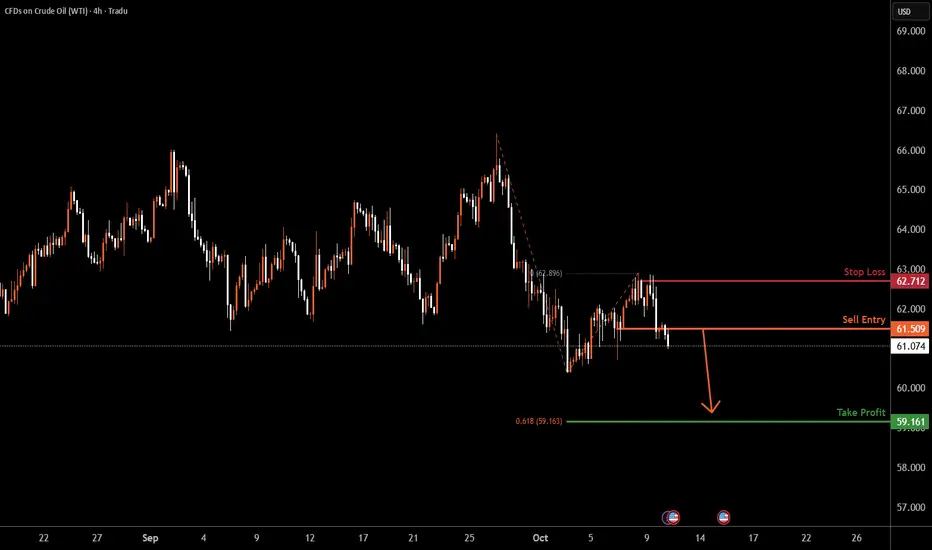
USOIL H4 | Bearish Drop OffUSOIL is reacting off the sell entry, which is a pullback resistance and could drop from this level to the downside.
Sell entry is at 61.50, which is a pullback resistance.
Stop loss is at 62.71, which is a pullback resistance.
Take profit is at 59.16, which lines up with the 161.8% Fibonacci extension.
High Risk Investment Warning
Trading Forex/CFDs on margin carries a high level of risk and may not be suitable for all investors. Leverage can work against you.
Stratos Markets Limited (tradu.com ):
CFDs are complex instruments and come with a high risk of losing money rapidly due to leverage. 65% of retail investor accounts lose money when trading CFDs with this provider. You should consider whether you understand how CFDs work and whether you can afford to take the high risk of losing your money.
Stratos Europe Ltd (tradu.com ):
CFDs are complex instruments and come with a high risk of losing money rapidly due to leverage. 66% of retail investor accounts lose money when trading CFDs with this provider. You should consider whether you understand how CFDs work and whether you can afford to take the high risk of losing your money.
Stratos Global LLC (tradu.com ):
Losses can exceed deposits.
Please be advised that the information presented on TradingView is provided to Tradu (‘Company’, ‘we’) by a third-party provider (‘TFA Global Pte Ltd’). Please be reminded that you are solely responsible for the trading decisions on your account. There is a very high degree of risk involved in trading. Any information and/or content is intended entirely for research, educational and informational purposes only and does not constitute investment or consultation advice or investment strategy. The information is not tailored to the investment needs of any specific person and therefore does not involve a consideration of any of the investment objectives, financial situation or needs of any viewer that may receive it. Kindly also note that past performance is not a reliable indicator of future results. Actual results may differ materially from those anticipated in forward-looking or past performance statements. We assume no liability as to the accuracy or completeness of any of the information and/or content provided herein and the Company cannot be held responsible for any omission, mistake nor for any loss or damage including without limitation to any loss of profit which may arise from reliance on any information supplied by TFA Global Pte Ltd.
The speaker(s) is neither an employee, agent nor representative of Tradu and is therefore acting independently. The opinions given are their own, constitute general market commentary, and do not constitute the opinion or advice of Tradu or any form of personal or investment advice. Tradu neither endorses nor guarantees offerings of third-party speakers, nor is Tradu responsible for the content, veracity or opinions of third-party speakers, presenters or participants.
13, here we comeLooks bullish and can hit 13. It may have massive pullbacks before it hits 13. Play safe and diversify.
Not a financial advise.

Plug - Hear me outProposing a trade on a shit-co like plug may earn some laughs but hear me out for a second.
In the right light and with enough alcohol, she could pass for a strong six. I'd do her.
Jokes, aside, due to the frantic rush to solve AI datacenter energy problem, power companies have been getting a lot of play lately, some have real growth potential, while others may be the speculative dream of degenerates like myself.
A 25 year old company, about to hit the figurative wall (DiCapiro joke...slaps knee), has suddenly seen an influx of buying activity and what looks to be increasing volume following a look below and fail of a weekly box.
According to box rules, I can't ignore this trade. Plug has been in an area of consolidation for years. It's completed atleast two look above and look below and fails of the larger boxed range.
I'm not saying that this stock is going to the moon, but if It can reclaim the top of the mini weekly box and hold the midpoint of the larger box then $8 seems like a realistic target to me.
Now, this stock would easily revert back to the volume point of control (VPOC) around $2 or lbaf again or simply fail miserably below the boxes...then all you degens will be living in boxes.
If we do see 2.50 - $2 again, I'd love to take an entry there (a lbaf of vpoc would be nice too). Otherwise, I'll be monitor this name for the mentioned trades.
My posts are for shits and giggles. I'm just a guy with an interest and a celcius addiction.
~The Villain

Natural Gas Pummeled on Inventories Natural gas saw continued heavy selling today off the inventory report.
Inventories came in at 80B which is 4Billion higher than the estimate.
This is showing a little bit less of demand pull.
The Weekly 200 MA was the technical rejection zone for Nat Gas.
We will be live trading Nat Gas tomorrow if we see another sell day in the commodity.
I'm watching for a liquidity sweep of the daily 200 MA.
Nat Gas Bulls need to defend the 20 MA at minimum.

CLSK Breaking out!CLSK continues with momentum closing above the macro triangle upper boundary trend-line and now testing the last resistance before a breakout! This will coincide with a break above wave D and flip the macro structure bullish bringing in more capital!
Daily RSI is overbought with slight bearish divergence but can remain this way for weeks in a strong uptrend!

USOIL – Buy SetupTimeframe: H1
Current price: 62.40 USD/barrel
Trade idea:
Buy USOIL 62.30–62.40
🎯 Target: 63.90
🛑 Stop loss: 61.74
📈 R:R ≈ 1:3
Technical basis:
Price retested the breakout trendline and held above SMA89 (bullish confirmation).
Strong rebound from Fib 0.236 zone (62.28).
Momentum building toward 63.9 resistance area.
Comment:
Short-term rebound expected after correction. Maintain buy bias while price >61.8.
