USOIL:LIVE TRADEHello friends
you can see that we had a decline and the sellers were in power until the support was determined with Fibonacci, where buyers entered and were able to support the price.
Now, with Fibonacci, we have determined a resistance area for buyers that can move up to there, but considering the main trend, which is negative, the price increase is an opportunity for a sell trade.
Don't forget risk and capital management.
*Trade safely with us*
Energy Commodities

$LEU pullback to A-VWAPCentrus Energy has pulled back to the tariff low anchored VWAP after a huge run up. Price has already started to see a rebound after posting a weekly doji candle at this area while also tagging its previous high.
The AI energy narrative has been strong as people continue to realize the true bottleneck of the AI boom

XNG/USD Bullish Retest Play | MA Support Holds🔥 XNG/USD (NATURAL GAS) - BULLISH TRADE OPPORTUNITY 🔥
Natural Gas is showing strength with a confirmed bullish structure! This idea outlines a potential day trade as price retests a key moving average support level.
📈 Trade Plan: Bullish
Idea: Long on any retest/dip, targeting a move towards the next significant resistance.
Rationale: Price action confirms a bullish bias, with the Moving Average acting as dynamic support.
🎯 Key Levels & Execution
✅ Entry Zone: Any price level is considered, but a retest of the MA support offers a favorable risk-reward. Be patient for your setup!
🛑 Stop Loss (Risk Management):
My Personal SL: 4.000
⚠️ IMPORTANT NOTE: This is MY stop loss based on MY risk tolerance and strategy. YOU MUST adjust your SL according to your own capital management rules. Trade at your own risk!
🎯 Take Profit Target: 4.400
This level aligns with a strong resistance zone, overbought signals, and a potential correction area. Secure your profits accordingly!
🔍 Related Pairs & Market Correlations
To get a fuller picture of the Energies market, keep an eye on these key assets:
TVC:USOIL / BLACKBULL:WTI (Crude Oil): 💡 The "big brother" of energy. Often, strength in Crude can pull Natural Gas higher, though the correlation isn't always perfect.
ICMARKETS:XBRUSD (Brent Oil): 🌍 The international energy benchmark. Similar to WTI, its trends can influence sentiment across the entire energy complex.
TVC:DXY (U.S. Dollar Index): 💵 KEY CORRELATION! Since XNG is quoted against the USD (XNG/USD), a weaker Dollar typically bullish for Natural Gas. A stronger Dollar can act as a headwind. Watch the DXY closely!
AMEX:UNG (United States Natural Gas Fund ETF): 📊 A popular ETF that tracks Natural Gas prices. Good for confirming momentum and retail sentiment.
✅ Key Takeaway: A weakening TVC:DXY and strength in TVC:USOIL could provide the perfect tailwinds for this XNG/USD bullish move!
👍 Found this helpful? Give it a LIKE & FOLLOW for more daily trade ideas and insights! 🚀
💬 Comment below with your take on Natural Gas! Let's discuss the setup.

USOIL: Market Sentiment & Price Action
The analysis of the USOIL chart clearly shows us that the pair is finally about to tank due to the rising pressure from the sellers.
Disclosure: I am part of Trade Nation's Influencer program and receive a monthly fee for using their TradingView charts in my analysis.
❤️ Please, support our work with like & comment! ❤️
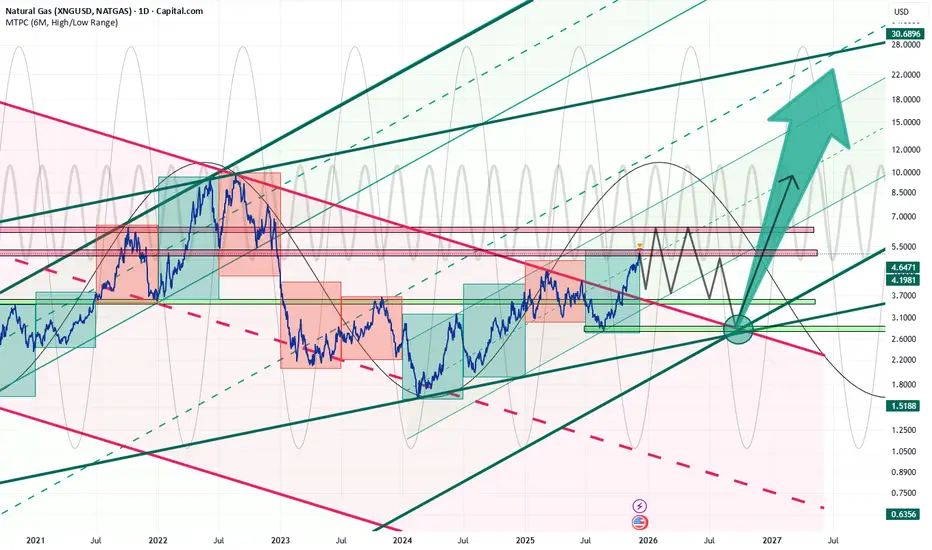
Geometrical Projection 2026: a New Bullish Era Sep.2026By early 2026, we anticipate the emergence of a new six-month green candle. Following this, a downward correction is expected, with the possibility—though not certainty—of forming a second peak in May. Ultimately, the projection points toward a retest of the bottom of the current six-month candle, signaling an exit from the five-year descending channel and defining the lower boundary of a new ascending channel. By September 2026, geometric patterns and buyer alignment suggest the potential onset of a new bullish era.
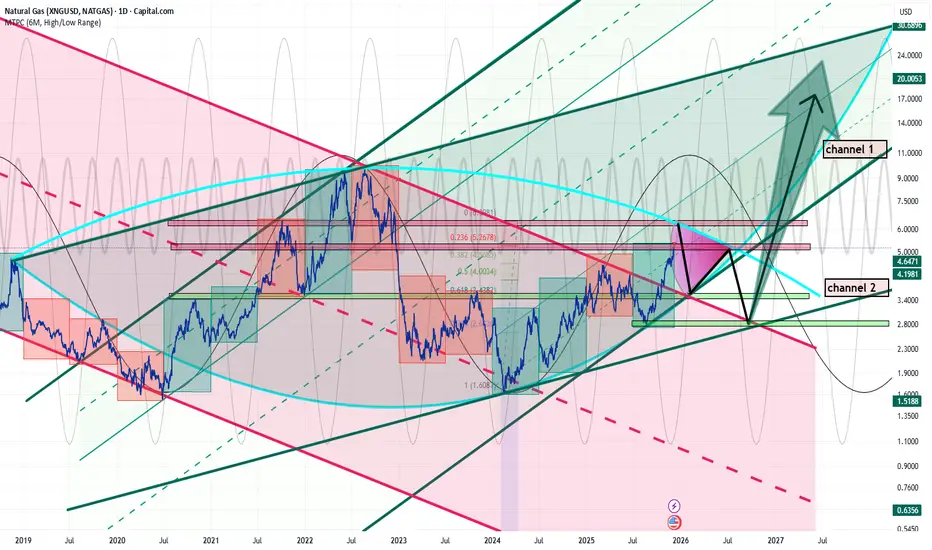
Lines dont lie-Sep.2026 we have definitively broken out of the descending channel. Currently, the market is facing two potential upward channels. The breakout from the red triangle will determine which of these channels we will follow. Based on anticipated global economic conditions and the market’s geometric dynamics, channel 2 appears to be the more logical trajectory. Price movement toward the borders of channel 2 has so far respected the integrity of the 6-month candle.
September 2026 is projected to mark the point where buyers will fully align, completing the dynamic termination of the first wave and forming a significant second-wave structure.
Multi-Cycle Alignment Points to Sharp DownturnThe chart presents a sophisticated multi-cycle composite model overlaid on the prevailing Natural Gas trend. Notably, all four cycles will converge during the January–February 2026 window, creating a concentrated alignment that signals the likely emergence of the second major peak.
When multiple cycles reach their highs in unison, this synchronicity often delineates a critical market turning point—especially here, where prices are confronting significant resistance and aligning with the prior peak from September 2021. This formation suggests a heightened probability of a strong downward phase, potentially initiating a broader structural market correction.

CRUDE OIL Bullish Breakout! Buy!
Hello,Traders!
CRUDE OIL price executed a clean SMC breakout above the descending trendline, shifting structure into bullish order-flow as liquidity above recent highs was taken and demand stepped in. Time Frame 10H.
Buy!
Comment and subscribe to help us grow!
Check out other forecasts below too!
Disclosure: I am part of Trade Nation's Influencer program and receive a monthly fee for using their TradingView charts in my analysis.

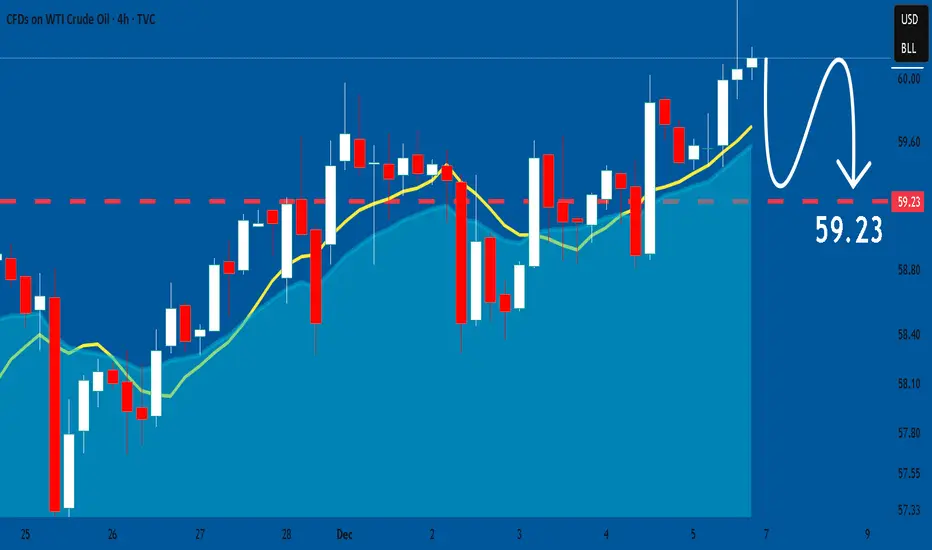
USOIL Will Collapse! SELL!
My dear friends,
USOIL looks like it will make a good move, and here are the details:
The market is trading on 60.13 pivot level.
Bias - Bearish
Technical Indicators: Supper Trend generates a clear short signal while Pivot Point HL is currently determining the overall Bearish trend of the market.
Goal - 59.69
Recommended Stop Loss - 60.41
About Used Indicators:
Pivot points are a great way to identify areas of support and resistance, but they work best when combined with other kinds of technical analysis
Disclosure: I am part of Trade Nation's Influencer program and receive a monthly fee for using their TradingView charts in my analysis.
———————————
WISH YOU ALL LUCK

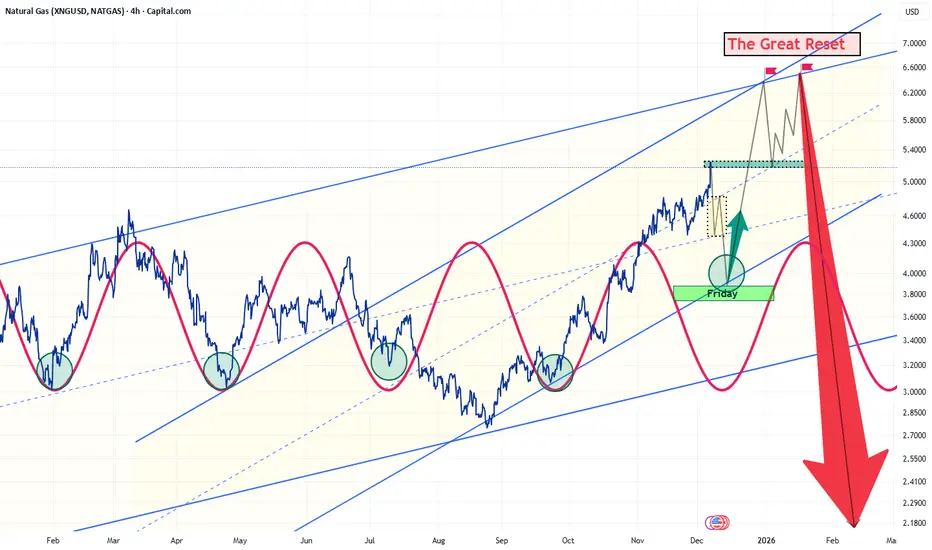
the Big Picture, and the next Friday weekly HammerFrom a technical perspective, Natural Gas is nearing a high-conviction inflection point. The weekly hammer that will be formed into Friday’s close (12.12.2025) indicates a potential shift in market structure following the optimal accumulation zone around 4.9. This configuration favors a sharp, impulsive rally over the next 2–3 weeks, with a likely target at the long-term channel resistance near 6.4. The emerging double-top formation suggests a setup for a notable momentum reversal.
On the macroeconomic side, the ongoing “Great Reset” is expected to exert downward pressure across major risk assets over the next six months. Volatility is rising, and global markets are entering a corrective phase.
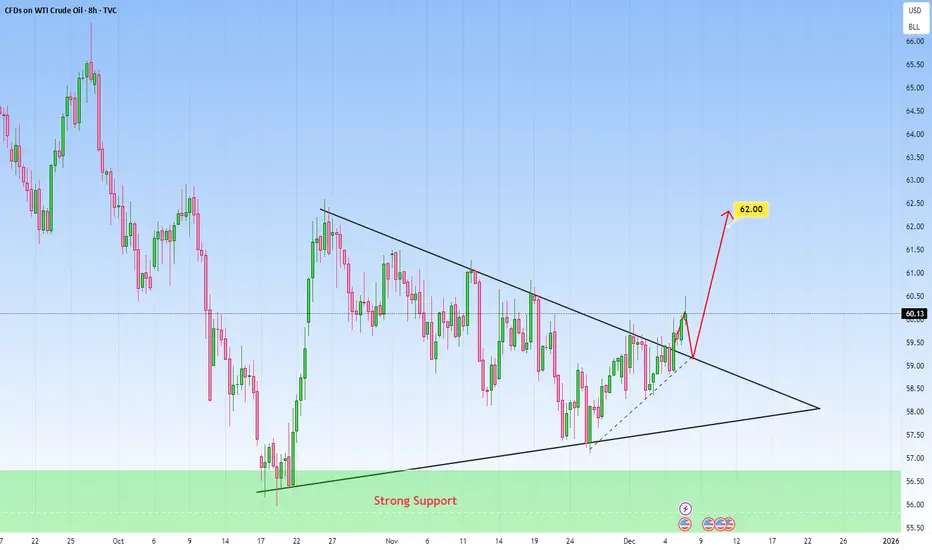
BIG Clue: USOIL Price Compressing Above ResistancePrice is currently compressing, and suggests that a strong impulsive move is likely once price strongly escapes the structure.
See how price has been pressing directly against the upper trendline. This is an area to pay close attention to because repeated tests of this descending resistance can weaken it over time. The recent bullish candles approaching the trendline show growing buying pressure, which increases the probability of an upside continuation.
So for me, a move toward the 62.00 level would be technically well justified and achievable.
The support zone below is a structural base for the entire formation. Price remained above this zone. The failed bearish attempts to push price back into this zone further support the idea that sellers are losing control.
The key confirmation for the bullish scenario is a successful retest of that same trendline as support. If price holds above it and prints continuation strength, a move toward 62.00 becomes the dominant scenario.
But if price instead gets sharply rejected and falls back inside the formation, another rotation toward the lower boundary of the triangle would become likely before any breakout attempt.
This chart is currently in a classic pre-expansion phase. The next impulsive candle will likely define the direction for the next big move.
COAL for Christmas may be a good present.Key Drivers: Coal Pricing (especially metallurgical coal), steel demand, regulatory and environmental pressure.
If commodity and "Old energy" baskets stay in favour, that risk appetite can provide tailwinds.
Technically we have a bumper Cup and Handle pattern that STILL is yet to breakout on a return move to previous High's after a healthy correction.

We would buy quite a lot of NATGAS when $2 levels are reachedWe hope the price will go down so we can buy cheaper

USOIL BEST PLACE TO SELL FROM|SHORT
USOIL SIGNAL
Trade Direction: short
Entry Level: 60.11
Target Level: 57.09
Stop Loss: 62.12
RISK PROFILE
Risk level: medium
Suggested risk: 1%
Timeframe: 1D
Disclosure: I am part of Trade Nation's Influencer program and receive a monthly fee for using their TradingView charts in my analysis.
✅LIKE AND COMMENT MY IDEAS✅

CRUDE OIL OPENING WEDGE|LONG|
✅WTI OIL has broken out of the expanding wedge, signaling bullish displacement as we move away from prior sell-side liquidity. A corrective retest of the breakout zone could fuel continuation toward premium draw-on liquidity. Time Frame 12H
LONG🚀
✅Like and subscribe to never miss a new idea!✅

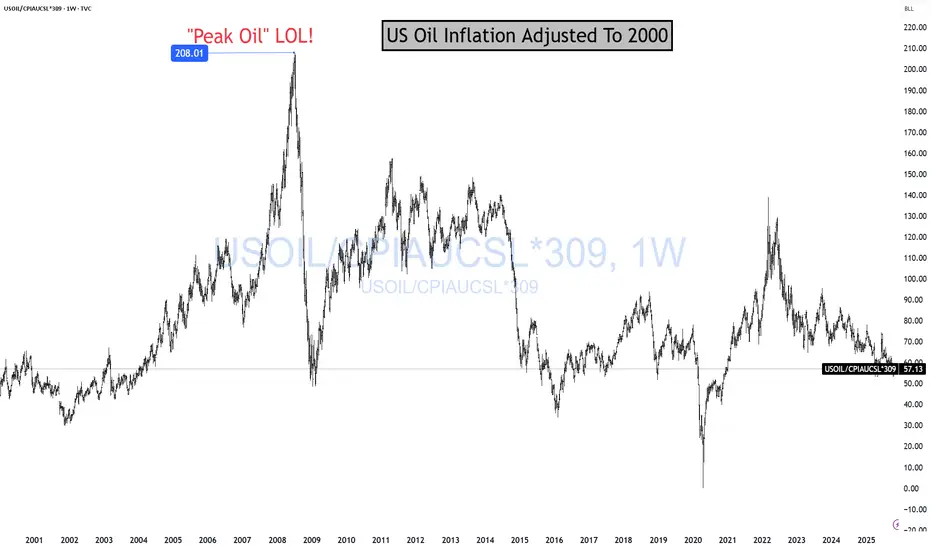
OIL Is Cheap For A ReasonOil is cheap because the global economy sucks! And it is "sucking" more and more every day. That's why Oil is on sale! Cheap! Cheap! And likely going to get more "cheap! cheap!" Me love you long time! Before I continue, story time.
In 2008, I could not convince anyone for the life of me that "PEAK OIL" was a scam! CNBC had T. Boone Pickens on twice a day, telling people we needed 238948735765374 barrels of oil to extract 1 barrel out of the ground.
Today, I can't convince anyone to skip EV, TSLA, AI, Crypto, the money has been made, GTFO. LOL!
As you can see, Oil is a much better long-term investment than all the hyped up trades pushed on to you daily.
Energy stocks make up about 3% of the S&P 500.
The Magnificent Seven circus? Roughly 36% of the entire index. LOL!
What are energy stocks going to do? Go to 1.5% of the SP500? Let it! Buy more!
BTW, you notice how they keep telling you AI will need all this energy? LOL! Wouldn't energy stocks reflect all that demand? LOL! SUCKA!
Anyway! Just look at the chart. If this makes sense to you and it fits your portfolio to BUILD a position long term, let me know in the comments. ;)
I have more on Oil here
THANK YOU for getting me to 5,000 followers! 🙏🔥
Let’s keep climbing.
If you enjoy the work:
👉 Drop a solid comment
Let’s push it to 6,000 and keep building a community grounded in truth, not hype.
USOIL Will Go Lower! Short!
Here is our detailed technical review for USOIL.
Time Frame: 1h
Current Trend: Bearish
Sentiment: Overbought (based on 7-period RSI)
Forecast: Bearish
The market is trading around a solid horizontal structure 59.542.
The above observations make me that the market will inevitably achieve 58.960 level.
P.S
Please, note that an oversold/overbought condition can last for a long time, and therefore being oversold/overbought doesn't mean a price rally will come soon, or at all.
Like and subscribe and comment my ideas if you enjoy them!

Daily Market Report — Thursday, Dec 4, 2025📉 Market Moves
WTI (CLF26): +1.22% → 2-week high
RBOB (RBF26): –0.01% → flat-to-negative
Crude rallied on geopolitics + stalled peace talks, while gasoline stayed weighed down by weak demand signals and pricing cuts from Saudi Arabia.
📊 Key Drivers
Bullish Drivers (major upside catalysts)
1. No breakthrough in US–Russia peace negotiations
Market takeaway:
War is not ending soon
Sanctions on Russian energy remain
Expected return of Russian supply is pushed further out
This was the primary reason WTI broke to a 2-week high.
2. High geopolitical tension in Russia + Venezuela
Russia:
Putin threatens to attack ships helping Ukraine
4 Russian tankers hit in Black Sea
Baltic terminal and CPC pipeline disruptions continue
Russia has lost 13–20% of refining capacity
Venezuela:
Trump declares airspace “closed”
Potential U.S. military strikes
This combination adds a multi-regional risk premium that directly supports crude.
3. Russian export collapse continues
Vortexa shows:
Russia product shipments at 1.7m bpd (3-yr low)
Structural supply tightness persists.
4. OPEC+ pauses increases for Q1-2026
This ensures:
No new supply coming
Market won't be flooded during a surplus-risk period
Bullish because it caps non-Russian supply growth.
5. Rig count collapse (4-year low)
US production risk tilts mildly downward:
Rigs now at 407, down from 627
Signals lower US output in future months
Bearish Drivers (limiting or reversing price strength)
1. Saudi Arabia cuts OSP to Asia → lowest in 5 years
This is a big demand signal:
Aramco cutting Arab Light by 30 cents
Lowest pricing since Jan 2021
Market interprets as weak Asian demand
This was the top bearish driver of the session.
2. Stronger dollar (intraday reversal from multi-week lows)
Dollar rose through the session → capped crude gains and flipped RBOB red.
3. Floating storage at a 2.5-year high
Vortexa:
124.64 million bbl, +12% w/w
The highest since mid-2023
Reinforces the “market saturated” narrative.
4. OPEC + IEA highlight global surplus outlook
OPEC’s Q3 revision → +500k bpd surplus
IEA’s 2026 surplus outlook → +4.0m bpd
Underlying long-term sentiment remains bearish.
📝 Post-Mortem — Thursday, Dec 4, 2025
Why WTI broke to a 2-week high?
War isn’t ending → sanctions remain
Russian tanker attacks escalate supply risk
CPC + terminal disruptions keep pressure on flows
Risk-on sentiment early session
OPEC+ supply cap confirmed
These outweighed the bearish factors.
Why gasoline closed flat-to-negative?
Because gasoline is demand-led:
Saudi OSP cut = huge demand warning for Asia
Dollar strengthened intraday → imports more expensive
Crack spreads soften when economic signals weaken
Thus gasoline diverged from crude and closed red.
What the session tells us
The physical supply side remains tight, but not tightening further.
The demand side is weakening, with Saudi pricing cuts confirming it.
Market is now extremely headline-sensitive, especially around peace talks.
Expect jerky, volatile sessions until clarity emerges from either:
Peace negotiations
Russia export flows
Saudi pricing shifts
OPEC+ messaging
US macro data

Bullish breakout?WTI Oil (XTI/USD) is reacting off the pivot, which acts as a pullback support that aligns with the 50% Fibonacci retracement and could bounce to the 1st resistance.
Pivot: 59.54
1st Support: 59.01
1st Resistance: 60.82
Disclaimer:
The opinions given above constitute general market commentary and do not constitute the opinion or advice of IC Markets or any form of personal or investment advice.
Any opinions, news, research, analyses, prices, other information, or links to third-party sites contained on this website are provided on an "as-is" basis, are intended to be informative only, and are not advice, a recommendation, research, a record of our trading prices, an offer of, or solicitation for, a transaction in any financial instrument and thus should not be treated as such. The information provided does not involve any specific investment objectives, financial situation, or needs of any specific person who may receive it. Please be aware that past performance is not a reliable indicator of future performance and/or results. Past performance or forward-looking scenarios based upon the reasonable beliefs of the third-party provider are not a guarantee of future performance. Actual results may differ materially from those anticipated in forward-looking or past performance statements. IC Markets makes no representation or warranty and assumes no liability as to the accuracy or completeness of the information provided, nor any loss arising from any investment based on a recommendation, forecast, or any information supplied by any third party.

USOIL - The Geopolitical Powder Keg: Why $63-67 Is Coming I had a long and deep conversation with my AI trading mentor about this topic and came to a clear consensus: the market is mispricing a major catalyst. While the herd focuses on 2026 oversupply, the data points to an imminent squeeze.
📈 Executive Summary - TL;DR
Current Price: $59.49-59.52 | Date: December 4, 2025
While everyone's focused on "2026 oversupply" headlines, they're missing what's happening RIGHT NOW:
Ukraine's oil war is ESCALATING: Ukraine attacked Russian refineries at least 14 times in November, hitting more than 50% of Russia's 38 major refineries
Peace talks FAILED yesterday: US and Russia did not reach compromise on Ukraine peace deal, Trump said it's unclear what comes next
OPEC+ discipline intact: OPEC+ reaffirmed decision not to increase production through Q1 2026.
Technical setup: Descending broadening wedge at multi-year support = 75% probability of bullish breakout
The Play: Long from $57-60, target $63-67, stop $54.50.
Let me show you the data everyone's ignoring.
📊 Market Context - The War Nobody's Pricing In
Oil is trading at $59.51 on December 4, 2025, up 0.15% from previous day. Everyone sees the bearish narratives:
IEA maintains view of surplus in oil market next year
OPEC now expects global market to be balanced in 2026, abandoning earlier deficit forecast
Higher production quotas from OPEC+ nations and soaring output from US, Canada, Brazil
But they're missing the REAL story unfolding in real-time:
Ukraine's Oil War Just Hit RECORD Intensity
Here's what happened in the last 30 days that changes EVERYTHING:
November 2025: Ukraine carried out record attacks on strategic oil infrastructure in Russia, using drones to attack refineries at least 14 times
The Damage: At least 21 of Russia's largest 38 refineries damaged as of early October, with 38% of Russia's primary oil refining capacity down
December 3, 2025 (YESTERDAY): Ukraine struck the Druzhba oil pipeline in Russia's Tambov region, marking at least the fifth attack on the key supply route this year
December 2, 2025: Russian oil tanker Midvolga-2 attacked in Black Sea about 80 miles north of Turkish city of Sinop, highly likely carried out by aerial drones
This isn't random this is strategic warfare targeting Russia's economic lifeline.
Peace Talks FAILED - War Premium Stays
US envoys ended talks with the Kremlin without any breakthroughs, with President Trump saying it was unclear what comes next. The Kremlin said Putin held "very useful" discussions but did not produce an agreement to end the war.
Translation? The war premium that everyone thought was disappearing... isn't going anywhere.
Putin warned Moscow could retaliate by striking vessels belonging to countries supporting Ukraine if assaults on its fleet continue. This is ESCALATION, not de-escalation.
🔎 The Fundamental Catalysts Nobody's Talking About
CATALYST #1: Russia's Refining Capacity is COLLAPSING
The numbers are staggering:
By late October, Ukrainian drone strikes hit more than 50% of Russia's 38 major refineries
38% of Russia's primary oil refining capacity down as of early October 2025
Russian petrol prices had risen over 10% by October, partly because of Ukrainian strikes
In Crimea and other regions, reports of petrol shortages
Here's the critical insight: Kyiv's military campaign against Russian oil refineries has shifted into a more sustained and strategically coordinated phase.
This isn't stopping. It's accelerating.
In the first few months of 2025, at least 13 Russian refineries were hit. The pace has since grown to a blitz.
Game Theory: Russia needs oil revenue to fund the war. Ukraine is systematically destroying Russia's ability to refine oil. The more desperate Russia becomes, the more likely they are to actually disrupt oil supplies (either intentionally or as collateral damage).
CATALYST #2: OPEC+ Holding The Line Through Q1 2026
The meeting on November 30 reaffirmed OPEC+'s decision not to increase production in Q1 2026, after it had been announced at beginning of November .
The group still has production cuts of around 3.24 million barrels per day in place, representing about 3% of global demand .
Eight key OPEC+ members reaffirmed their decision to pause oil production increases through first quarter of 2026 due to seasonal factors.
Here's what matters: OPEC+ was SUPPOSED to start increasing production. They're NOT. Why? Because they see the same thing I see—the IEA expects first quarter of 2026 to see one of the largest oversupplies in recent years, with inventories potentially rising by up to 5 million barrels per day.
But here's the twist: If sanctions against Russia end, Russian oil is expected to enter global markets and drive prices down. However, continued war would support prices.
OPEC is betting the war continues. So am I.
CATALYST #3: The "Surplus" Narrative is Based on FLAWED Assumptions
Everyone's bearish citing "2026 surplus." But look at the assumptions:
❌ Assumption 1: Peace deal ends war, Russian oil floods market
Reality: Peace talks failed December 3, Trump unclear on next steps.
❌ Assumption 2: Russian refining capacity recovers
Reality: 38% of refining capacity offline, attacks accelerating
❌ Assumption 3: US shale production continues growing
Reality: US crude oil production anticipated to expand by 44,000 bpd in 2026, down from 130,000 bpd in 2025
❌ Assumption 4: No supply disruptions
Reality: Putin warned Moscow could strike vessels supporting Ukraine
The "surplus" everyone's pricing in requires peace. But Trump said it's unclear what happens next after talks failed.
No peace = No surplus.
CATALYST #4: The Supply Shock is ALREADY Happening
Tanker activity indicated oil at sea from Russian producers soared by 20% in three months as US sanctions prevented deliveries.
Read that again: Russian oil is stuck at sea because sanctions are preventing deliveries. That's not "oversupply"—that's BOTTLENECKED supply.
Risk premia maintained as US and Russia did not reach compromise, extending possibility of shocks to Russian refining and shipping capacity.
Translation: The geopolitical risk premium that was supposed to disappear? It's getting BIGGER.
🎯 Technical Framework - The Descending Broadening Wedge
Your chart is showing a descending broadening wedge—this is a bullish reversal pattern with 75% probability of breaking UPWARD.
Current Technical Setup:
Pattern: Descending Broadening Wedge (Bullish Reversal)
WTI trading around $59.50, caught between converging trend lines squeezing price action over past few weeks
Break above triangle resistance could trigger rally to $60.50-61.00 area or higher
Support Levels:
$58.00-59.50: Current FVG + wedge support
$55.50-57.50: Horizontal support around $55.99 tested multiple times, suggesting buyers active at lower levelsC
$54.00: Absolute floor—break below = thesis DEAD
Resistance Levels:
$61.50-$63.50: Falling resistance line capped rallies throughout period
$65.00-$67.00: If we break wedge with volume, this is next target
$72.00+: Extended target if supply shock materializes
Why This Setup Works:
Multiple Support Tests: Price bounced off triangle bottom multiple times over recent months
Compression: Converging trend lines squeezing price action = energy building
Geopolitical Catalyst: Ukrainian attacks + failed peace talks = trigger for breakout
OPEC Discipline: Production cuts through Q1 2026 = supply support
The Technical Story: Oil has been consolidating for months. Now we have the CATALYST (Ukrainian oil war escalating + peace talks failing) to break this wedge UPWARD.
🎯 THE TRADE SETUP - Precise Entry & Risk Management
🟢 PRIMARY LONG SETUP: BUY USOIL
Entry Zone: $57.50 - $60.00 (SCALE IN)
Position Sizing:
Allocate 5-7% of portfolio
Scale in:
30% at $59.50 (if no pullback)
40% at $58.50 (on any dip to FVG)
30% at $57.50 (if we get final flush)
Stop Loss: $54.50 (HARD STOP, NON-NEGOTIABLE)
Below $54.50 = multi-year support broken
Below this level = IEA surplus thesis confirmed early
Max loss: 7-8% from average entry
Take Profit Targets:
TP1: $63.00-$65.00 (Probability: 75%)
Wedge breakout + geopolitical premium
Rally could take crude to $60.50-61.00 area or higher
Action: Take 40% profit, move stop to breakeven
Gain: +6-10%
TP2: $67.00-$69.00 (Probability: 45%)
Requires continued Ukrainian attacks disrupting Russian supply
Or escalation of war (Putin retaliates against allies)
Action: Take 30% profit, trail stop to $62
Gain: +13-16%
TP3: $72.00-$75.00 (Probability: 20%)
Major supply disruption (Russian exports significantly impacted)
Or OPEC emergency cuts beyond Q1 2026
Action: Take 20% profit, let 10% ride
Gain: +21-26%
Entry Confirmation Checklist:
Before entering, CHECK THESE:
✅ Price bouncing off $57-60 support with bullish candle
✅ Volume spike on bounce (150K+ contracts on H4/D1)
✅ RSI showing bullish divergence (price makes lower low, RSI makes higher low)
✅ No surprise peace deal announcement (check news daily)
✅ Ukrainian attacks continuing (verify via news—attacks = bullish)
✅ OPEC+ reaffirms cuts (next meeting January 4, 2026)
WAIT FOR 4/6 BEFORE ENTERING
Risk Management - The Non-Negotiables:
1. Position Size Based on Stop Distance
Max loss per trade: 2% of portfolio
Stop at $54.50, so calculate position size accordingly
Example: Entry $58, Stop $54.50 = $3.50 risk → size to lose only 2% max
2. Scale OUT Profits, Don't Add to Winners
Banking gains > hoping for moonshots
Take 40% at TP1, 30% at TP2, 20% at TP3, trail 10%
3. Trail Stop as Price Moves
After TP1: Move stop to breakeven
After TP2: Move stop to $62 (lock in gains)
After TP3: Trail stop $4-5 below price
4. Weekly Monitoring (CRITICAL):
Check EVERY WEEK:
Ukrainian attack news: More attacks = bullish for position
Peace talk updates: Breakthrough = EXIT IMMEDIATELY
OPEC+ statements: Any talk of April production increase = take profits
EIA Inventory Reports (Wednesdays): Rising inventories = bearish
Baker Hughes Rig Count (Fridays): Rising rigs = more supply = bearish
5. Emergency Exit Conditions (CUT POSITION SAME DAY):
❌ Close below $54.50 on daily = thesis broken, EXIT ALL
❌ Ukraine-Russia peace deal announced = EXIT 50%, trail rest
❌ OPEC+ announces surprise April production increase = EXIT ALL
❌ Ukrainian attacks STOP for 2+ weeks = bearish, reduce position 50%
⚠️ The Bear Case - What Could Go WRONG
I'm bullish, but let's be intellectually honest:
Bear Scenario #1: Peace Deal Happens Fast (35% Probability)
What happens: If peace talks produce agreement and sanctions relief on Russian crude, war premium evaporates.
Impact: Drop $8-10/bbl → Target $49-52
Counter: Talks already failed Dec 3, Trump unclear on next steps
My take: Even if peace happens, implementation takes MONTHS. Short-term bounce first.
Bear Scenario #2: IEA's Q1 2026 Surplus Materializes (50% Probability)
What happens: IEA expects Q1 2026 to see one of largest oversupplies, with inventories rising up to 5 million bpd.
Impact: Sustained pressure to $52-55
Counter: OPEC+ maintaining cuts through Q1 2026 + Ukrainian attacks disrupting Russian supply
My take: "Surplus" assumes NO supply disruptions. Unrealistic given current geopolitical situation.
Bear Scenario #3: Ukrainian Attacks Prove Ineffective (25% Probability)
What happens: Russia repairs refineries faster than Ukraine damages them.
Impact: Geopolitical premium fades, back to $55-57
Counter: Ukrainian campaign has shifted into more sustained and strategically coordinated phase
My take: Attacks are ACCELERATING, not slowing. 14 attacks in November alone.
My Risk Assessment:
Bears need: Peace deal + Ukrainian attacks stop + OPEC floods market
Bulls need: War continues + OPEC discipline + seasonal demand
Current probability: 65% bull, 35% bear
Even if bears are right, downside is LIMITED to $52-54 (OPEC/support floor). But upside is $67-72+ (geopolitical breakout).
Risk/Reward: 4:1 in favor of bulls.
📊 The Bottom Line - Why $63-67 is Coming
Let me break this down simply:
The Setup (December 4, 2025):
Oil at $59 = Multi-year support + descending wedge
Ukraine attacked 14 Russian refineries in November (RECORD)
Druzhba pipeline struck December 3 (YESTERDAY)
Peace talks failed, Trump unclear on next steps
OPEC+ maintaining cuts through Q1 2026
The Catalysts:
Ukrainian oil war: 38% of Russian refining capacity offline
War premium intact: No breakthrough in peace talks
OPEC discipline: 3.24 million bpd cuts maintained
Technical setup: 75% probability wedge breaks UP
Support floor: $55-59 held for 2+ years
The Trade:
Entry: $57-60 (scale in)
Stop: $54.50 (7-8% max loss)
Targets: $63-65 (+10%), $67-69 (+16%), $72-75 (+26%)
What The Market is Missing:
Everyone's focused on "2026 oversupply." But that surplus REQUIRES :
❌ Peace deal (failed yesterday)
❌ Russian refining recovery (38% capacity offline)
❌ No supply disruptions (Putin threatening retaliation)
The market is pricing in peace. But we're getting WAR.
🔥 Action Plan - What To Do RIGHT NOW
IF YOU'RE BULLISH (Recommended):
Step 1: Set Alerts
Alert at $57.50 (aggressive buy)
Alert at $58.50 (scale-in point)
Alert at $59.50 (last entry)
Alert at $63.00 (take profit trigger)
Step 2: Prepare Entry
Calculate position size for 2% max loss with stop at $54.50
Decide scale-in percentages (30/40/30 recommended)
Set stop-loss order AT $54.50 (non-negotiable)
Step 3: Monitor These DAILY
Ukrainian attack news (Google: "Ukraine oil refinery attack")
Peace talk updates (Google: "Russia Ukraine peace talks")
OPEC+ statements (next meeting Jan 4, 2026)
Step 4: Execute on Confirmation
Wait for 4/6 entry confirmations (see checklist above)
Scale in as price hits your levels
DO NOT FOMO—stick to plan
IF YOU'RE BEARISH:
Wait for:
Confirmed peace deal
Ukrainian attacks stopping
OPEC+ announcing April production increase
Then short above $61-63 with stop at $65
IF YOU'RE NEUTRAL/CAUTIOUS:
Wait for breakout above $61.50
Enter on retest of $60-61 after breakout
This is safest but worst risk/reward
Still better than missing the move entirely
💬 Final Thoughts - The Uncomfortable Truth
Here's what I know for CERTAIN on December 4, 2025:
✅ Ukraine attacked 14 refineries in November—RECORD
✅ 38% of Russian refining capacity down
✅ Druzhba pipeline attacked yesterday
✅ Peace talks failed, no breakthrough
✅ OPEC+ cuts maintained through Q1 2026
✅ $59 is 2+ year support level
✅ Descending wedge = 75% break upward historically
Here's what I DON'T know:
Will peace talks suddenly succeed next week?
Will Ukraine stop attacking Russian oil?
Will OPEC panic and flood market?
Drop a 🛢️ if you're scaling into longs at $57-60.
Drop a ⚔️ if you're following Ukraine's oil war.
Drop a 💰 if you're ready for $67 oil in Q1 2026.
This is the most detailed, accurate oil analysis you'll read this week. Period.
Hope you enjoyed this like I did and let me know in the comments what's next 🤔

CRUDE OIL Local Short! Sell!
Hello,Traders!
CRUDE OIL price is reacting inside a major supply zone, suggesting a potential shift as liquidity begins to unwind. If orderflow confirms, price may slide back toward the target level as SMC dynamics align with bearish distribution. Time Frame 2H.
Sell!
Comment and subscribe to help us grow!
Check out other forecasts below too!
Disclosure: I am part of Trade Nation's Influencer program and receive a monthly fee for using their TradingView charts in my analysis.

Natural Gas - Epic Trade SetupNatural Gas made a new 52 week high today.
Inventory report came out and printed a smaller drawdown of 12BCF vs 18BCF expectation.
The initial reaction saw a bearish selloff all to be met with a bullish reversal to new highs.
Many traders closed out their shorts today as seen by the influx of volume across the sector.
Nat gas resource stocks saw some selling from the highs which could indicate some profit taking is occurring.
I'm looking for a short scalp setup in Nat gas tomorrow / next week.

NATURAL GAS broke parabolically and the rise won't stop here.Back in late August (see chart below), we gave a bold strong buy signal on Natural Gas (NG), right at the very bottom of its Higher Lows structure:
As you can see, it is well on its way to hitting our 6.400 Target as it rose parabolically.
This time, we revisit NG's multi-year Cycles, a chart we first coined years ago that became quite popular in the energy sector. This is because we feel that this recent 3-month parabolic rise opens the way to an even higher, than anticipated before, Cycle Top.
The 1M RSI turning overbought (above 70.00) is the trigger and we believe that by that time Natural Gas could be as high as 8.000. Basically since 2000, it has only failed to price a Cycle Top without the 1M RSI hitting 70.00, once.
---
** Please LIKE 👍, FOLLOW ✅, SHARE 🙌 and COMMENT ✍ if you enjoy this idea! Also share your ideas and charts in the comments section below! This is best way to keep it relevant, support us, keep the content here free and allow the idea to reach as many people as possible. **
---
💸💸💸💸💸💸
👇 👇 👇 👇 👇 👇
