UKOIL H4 | Based on the H4 chart analysis, we could see the price fall to the buy entry which is a pullback support that aligns with the 50% Fibonacci retracement and could bounce from this levle to the upside.
Buy entry is at 68.47, which is a pullback support that aligns with the 50% Fibonacci retracement.
Stop loss is at 67.17, which is a pullback support that is slightly above the 78.6% Fibonacci retracement.
Take profit is at 70.53, which is a swing high resistance.
High Risk Investment Warning
Trading Forex/CFDs on margin carries a high level of risk and may not be suitable for all investors. Leverage can work against you.
Stratos Markets Limited (tradu.com ):
CFDs are complex instruments and come with a high risk of losing money rapidly due to leverage. 65% of retail investor accounts lose money when trading CFDs with this provider. You should consider whether you understand how CFDs work and whether you can afford to take the high risk of losing your money.
Stratos Europe Ltd (tradu.com ):
CFDs are complex instruments and come with a high risk of losing money rapidly due to leverage. 66% of retail investor accounts lose money when trading CFDs with this provider. You should consider whether you understand how CFDs work and whether you can afford to take the high risk of losing your money.
Stratos Global LLC (tradu.com ):
Losses can exceed deposits.
Please be advised that the information presented on TradingView is provided to Tradu (‘Company’, ‘we’) by a third-party provider (‘TFA Global Pte Ltd’). Please be reminded that you are solely responsible for the trading decisions on your account. There is a very high degree of risk involved in trading. Any information and/or content is intended entirely for research, educational and informational purposes only and does not constitute investment or consultation advice or investment strategy. The information is not tailored to the investment needs of any specific person and therefore does not involve a consideration of any of the investment objectives, financial situation or needs of any viewer that may receive it. Kindly also note that past performance is not a reliable indicator of future results. Actual results may differ materially from those anticipated in forward-looking or past performance statements. We assume no liability as to the accuracy or completeness of any of the information and/or content provided herein and the Company cannot be held responsible for any omission, mistake nor for any loss or damage including without limitation to any loss of profit which may arise from reliance on any information supplied by TFA Global Pte Ltd.
The speaker(s) is neither an employee, agent nor representative of Tradu and is therefore acting independently. The opinions given are their own, constitute general market commentary, and do not constitute the opinion or advice of Tradu or any form of personal or investment advice. Tradu neither endorses nor guarantees offerings of third-party speakers, nor is Tradu responsible for the content, veracity or opinions of third-party speakers, presenters or participants.
Energy Commodities

Crude Oil (WTI) Technical OutlookCrude Oil (WTI) has recently tested a critical resistance zone around $65, showing strong upside momentum after weeks of consolidation. The chart structure suggests a potential bullish breakout, with price action forming higher lows and pressing against a key supply level.
If WTI holds above $65, the next upside targets lie at:
$67.80 – intermediate resistance
$68.98 – major technical level aligned with previous supply
$70.50 – $71.00 – key psychological resistance and prior swing high
A short-term retest of $65 may act as confirmation before continuation toward the $70+ region. Failure to hold above $64.50 could invalidate the bullish scenario and open a move back toward $62.
This analysis highlights institutional order flow dynamics and key liquidity levels, indicating that crude oil may be setting up for a significant directional move. Traders should watch for clean breaks and retests at major support/resistance zones before positioning.
📌 Summary:
Bias: Bullish above $65
Targets: $67.80 → $68.98 → $70.50+
Risk: Breakdown below $64.50

Gold | Oil | Dollar | Silver | Natural Gas Price ForecastGold | Oil | Dollar | Silver | Natural Gas Price Forecast
AMEX:UNG AMEX:BOIL AMEX:KOLD COMEX:SI1!

PSX | Oil and Gas is on the Rise | LONGPhillips 66 engages in the processing, transportation, storage, and marketing of fuels and other related products. The company operates through the following segments: Midstream, Chemicals, Refining, Renewable Fuels, Marketing and Specialties, and Corporate and Other. The Midstream segment provides crude oil and refined products transportation, terminal, and processing services, as well as natural gas, natural gas liquids, and liquefied petroleum gas transportation, storage, processing, and marketing services. The Chemicals segment produces and markets petrochemicals and plastics worldwide. The Refining segment refines crude oil and other feedstocks into petroleum products such as gasoline, distillates, and aviation fuels. The Marketing and Specialties segment purchases for resale and markets refined petroleum products such as base oils and lubricants, and power generation operations. The Renewable Fuels segment processes renewable feedstocks into renewable products at the Rodeo Renewable Energy Complex (Rodeo Complex) and at Humber Refinery. The company was founded in 1875 and is headquartered in Houston, TX.

USOIL: Bears Will Push
The analysis of the USOIL chart clearly shows us that the pair is finally about to tank due to the rising pressure from the sellers.
Disclosure: I am part of Trade Nation's Influencer program and receive a monthly fee for using their TradingView charts in my analysis.
❤️ Please, support our work with like & comment! ❤️

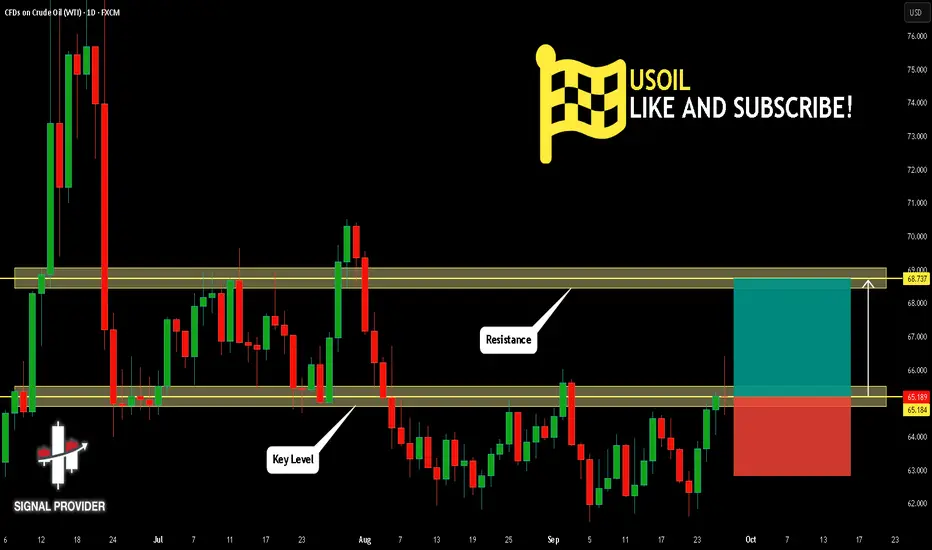
USOIL Is Bullish! Long!
Please, check our technical outlook for USOIL.
Time Frame: 1D
Current Trend: Bullish
Sentiment: Oversold (based on 7-period RSI)
Forecast: Bullish
The market is approaching a significant support area 65.184.
The underlined horizontal cluster clearly indicates a highly probable bullish movement with target 68.737 level.
P.S
Please, note that an oversold/overbought condition can last for a long time, and therefore being oversold/overbought doesn't mean a price rally will come soon, or at all.
Like and subscribe and comment my ideas if you enjoy them!
Crude Oil (WTI) Short Setup Bearish Reversal from Rising ChannelAsset: CFDs on Crude Oil (WTI)
Timeframe: 1 Hour (1H)
Pattern: Rising channel (ascending parallel channel)
Trade Type: Short (Sell) Setup
Risk/Reward: The trade is planned based on a channel breakdown, targeting a move down to the base of the move.
📊 Key Trade Levels
Type Price Level
Entry 6,709.7 – 6,711.0 (near upper channel resistance)
Stop Loss 6,762.0 – 6,762.3 (above recent highs)
Target 6,353.6 – 6,353.8 (near recent support)
🧠 Trade Rationale
Rising Channel Break: Price is currently within a rising channel, but recent candles show rejection at the upper boundary.
Fakeout Trap: There's a sketched projection suggesting a false breakout to the upside, followed by a sharp reversal into a short move.
Entry Zone: The trade is planned if price retests the upper zone (entry area), which aligns with the top of the channel.
Target Zone: The projected target is around the bottom of the channel or just below, implying a full retracement of the previous bullish leg.
Risk Management: Stop loss is placed slightly above the upper boundary to avoid getting stopped out by minor wicks.
📈 Technical Insights
Bearish Momentum Potential: If price fails to hold above the channel and re-enters with strong bearish volume, it supports a short entry.
Volume Analysis Needed: A confirmation with increasing volume on the breakdown would strengthen the setup.
Trend Reversal Signal: This setup may be hinting at a trend reversal or at least a significant pullback from the current upward trend.
✅ Conclusion
This is a high-probability short trade setup based on:
A break/retest of an ascending channel.
A potential false breakout trap.
Defined entry, stop loss, and take profit levels offering a solid risk/reward ratio.

Q4 2025 Oil Market Outlook: WTI and Brent Crude Analysis**September 27, 2025**
## **Executive Summary**
As the global energy landscape enters the final quarter of 2025, the oil market remains delicately balanced between oversupply pressures and persistent geopolitical risks. West Texas Intermediate (WTI) and Brent Crude—two of the world’s most closely watched benchmarks—are trading in a narrow range, reflecting cautious sentiment among traders and investors. This report provides a comprehensive analysis of current market dynamics, evaluates key drivers, and offers a professional forecast for Q4 2025.
---
## **Current Market Snapshot**
- **WTI Crude (as of September 26, 2025):** $65.37/bbl
- **Brent Crude:** $69.72/bbl
- **YTD Performance:** WTI down ~14.8% from 2022; Brent down ~12.3%
Both benchmarks have shown resilience in recent weeks, supported by seasonal demand and inventory drawdowns, but face headwinds from rising global supply and economic uncertainty.
---
## **Fundamental Drivers**
### **1. Supply-Side Dynamics**
- **OPEC+ Production Increases:** OPEC+ has announced a phased increase of 547,000 barrels per day starting in September , with further adjustments planned for October. This marks the final unwinding of the 2.2 million bpd voluntary cuts initiated in late 2023.
- **Non-OPEC+ Output Growth:** U.S. production remains robust at 13.4 million bpd, with additional supply from Canada and Guyana contributing to a projected global surplus of 1.5% in Q4 .
### **2. Demand Outlook**
- **Global Demand Growth:** Forecasted to slow to ~1.1 million bpd in 2025, down from 1.8 million bpd in 2024.
- **Seasonal Trends:** Winter heating demand may offer temporary support, but overall consumption is expected to contract by 230,000 bpd in Q4.
### **3. Geopolitical Risks**
- **Russia-Ukraine Conflict:** Continued strikes on Russian energy infrastructure and renewed sanctions have injected volatility into the market.
- **Middle East Tensions:** Drone attacks and Red Sea disruptions have added risk premiums to Brent pricing.
- **U.S. Tariff Policy:** Aggressive energy tariffs and diplomatic pressure on European allies to reduce Russian imports have further complicated trade flows.
---
## **Technical Analysis & Market Sentiment**
### **WTI Crude**
- **Support Levels:** $62.90, $61.50
- **Resistance Levels:** $66.00, $68.00
- **Trend:** Neutral to mildly bearish; RSI hovering near 50.
### **Brent Crude**
- **Support Levels:** $67.00, $65.70
- **Resistance Levels:** $70.30, $72.00
- **Trend:** Consolidating in a symmetrical triangle; breakout potential remains.
---
## **Institutional Forecasts for Q4 2025**
Institution | WTI Forecast (Q4 2025) | Brent Forecast (Q4 2025)
------------------------|------------------------|---------------------------
EIA | $55.41 | $59.00
J.P. Morgan | $57.00 | $63.57
Goldman Sachs | $60.30 | $63.57
Trading Economics | $62.43 | $67.65
Reuters Poll | $64.65 | $68.20
---
## **Q4 2025 Price Forecast & Rating**
### **WTI Crude Oil**
- **Forecast Range:** $58.00 – $64.00
- **Base Case:** $60.00
- **Rating:** **Neutral to Bearish**
- **Key Risks:** Inventory builds, slowing demand, U.S. shale resilience
### **Brent Crude Oil**
- **Forecast Range:** $62.00 – $68.00
- **Base Case:** $65.00
- **Rating:** **Neutral**
- **Key Risks:** Geopolitical shocks, OPEC+ policy shifts, European demand softness
---
## **Strategic Implications for Stakeholders**
- **Investors:** Expect continued volatility; hedge positions via options and futures.
- **Producers:** Prepare for margin compression; focus on cost efficiency and capital discipline.
- **Policymakers:** Monitor inflationary impacts and energy security amid geopolitical tensions.
---
## **Conclusion**
The Q4 2025 oil market is poised for a cautious and potentially volatile close to the year. While geopolitical risks offer short-term support, the structural oversupply and weakening demand fundamentals suggest limited upside for both WTI and Brent. Market participants should brace for a range-bound environment with breakout risks tied to geopolitical developments and OPEC+ policy shifts.
---
Risk Disclaimer!
General Risk Warning: Trading on the Financial Markets, Stock Exchange and all its asset derivatives is highly speculative and may not be suitable for all investors. Only invest with money you can afford to lose and ensure that you fully understand the risks involved. It is important that you understand how Trading and Investing on the stock exchange works and that you consider whether you can afford the high risk of loss.

USOIL: 70$ BREAKOUT ROCKET FUELED! Black Gold Rally 🛢️ USOIL: 70$ BREAKOUT ROCKET FUELED! Black Gold Rally 📊
Current Price: $65.465 | Date: Sept 27, 2025 ⏰
📈 INTRADAY TRADING SETUPS (Next 5 Days)
🎯 BULLISH SCENARIO
Entry Zone: $65.20 - $65.60 📍
Stop Loss: $64.80 🛑
Target 1: $66.50 🎯
Target 2: $67.30 🚀
🎯 BEARISH SCENARIO
Entry Zone: $65.80 - $66.20 📍
Stop Loss: $66.60 🛑
Target 1: $64.70 🎯
Target 2: $64.00 📉
🔍 TECHNICAL ANALYSIS BREAKDOWN
📊 KEY INDICATORS STATUS:
RSI (14): 59.4 ⚡ Bullish Momentum Zone
Bollinger Bands: Mid-Band Breakout 🔥
VWAP: $65.35 - Acting as Springboard 💪
EMA 50: $64.80 ✅ Golden Cross Setup
Volume: Institutional Interest Rising 📊
🌊 WAVE ANALYSIS:
Elliott Wave: Wave 3 Impulse Loading 🌊
Fibonacci Target: $68.50 (161.8%) 🎯
🔄 HARMONIC PATTERNS:
Bullish Bat Completion at $64.90 ✨
ABCD Pattern targeting $67.20 🔄
⚖️ SWING TRADING OUTLOOK (1-4 Weeks)
🚀 BULLISH TARGETS:
Psychological: $70.00 🏆
Weekly Resistance: $68.80 🌙
Gann Level: $69.25 ⭐
📉 BEARISH INVALIDATION:
Weekly Support: $63.50 ⚠️
Critical Break: $62.00 🚨
🎭 MARKET STRUCTURE:
Trend: Ascending Triangle 💪
Momentum: Energy Building 🔥
Wyckoff Phase: Accumulation End 📈
Ichimoku: Bullish Cloud Entry 🟢
⛽ OIL MARKET DYNAMICS:
Supply Cuts: OPEC+ Extensions 🛢️
Demand Growth: Winter Season 🌨️
Inventory Draws: Bullish Data 📉
Geopolitical Premium: Risk-On ⚔️
⚡ RISK MANAGEMENT:
Max Risk per Trade: 2% 🛡️
R:R Ratio: Minimum 1:2 ⚖️
Breakout Confirmation: $66.00 hold 📏
🌍 FUNDAMENTAL CATALYSTS:
EIA Reports Supporting Bulls 📈
Middle East Tensions Premium 🌍
China Demand Recovery Signs 🏭
US Dollar Weakness Helping 💵
🔥 CRITICAL LEVELS TO WATCH:
Breakout Zone: $66.00-$66.30 💥
Support Cluster: $65.00 | $64.50 | $64.00 🛡️
Resistance: $66.50 | $67.50 | $68.00 🚧
🎯 FINAL VERDICT:
WTI primed for $70 EXPLOSIVE RALLY! 🚀
Black Gold showing institutional love! 💎
Supply-demand imbalance = bullish fuel! ⛽
Trade Management: Buy dips above $65.00 💰
Breakout Watch: $66.30 decisive level! 🔔
---
⚠️ Disclaimer: Commodity trading carries high risk. Use appropriate position sizing. Educational analysis only.
For individuals seeking to enhance their trading abilities based on the analyses provided, I recommend exploring the mentoring program offered by Shunya Trade. (Website: shunya dot trade)
I would appreciate your feedback on this analysis, as it will serve as a valuable resource for future endeavors.
Sincerely,
Shunya.Trade
Website: shunya dot trade
🔔 Follow Oil Market Updates | 💬 Drop Your $70 Oil Timeline

BRIEFING Week #39 : The Turning Point is HereHere's your weekly update ! Brought to you each weekend with years of track-record history..
Don't forget to hit the like/follow button if you feel like this post deserves it ;)
That's the best way to support me and help pushing this content to other users.
Kindly,
Phil

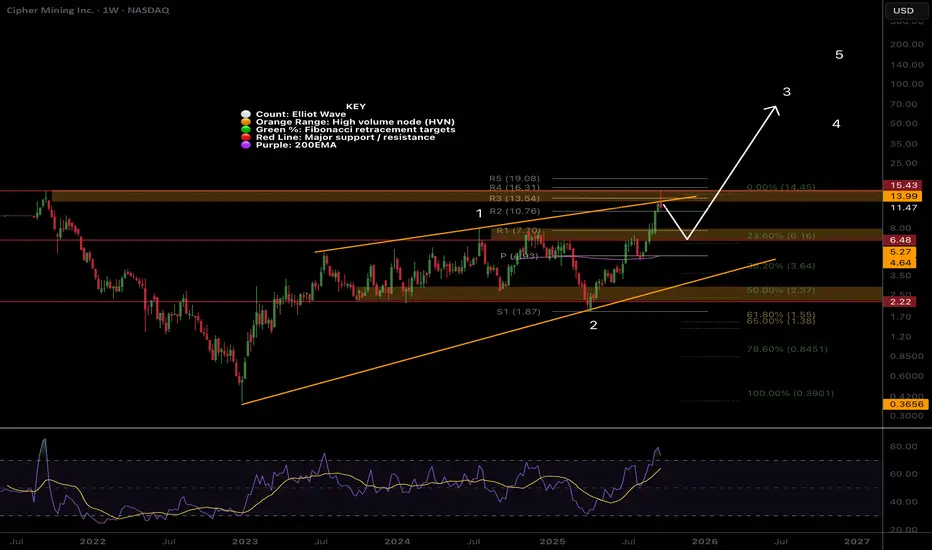
CIFR Ready for retracement...Wave 3 appears to be underway on NASDAQ:CIFR with wave (1) peaking with a pop into the all time high volume node as expected for wave 1 termination, trapping new traders and investors with the excitement!
Sentiment is very greedy on social and mainstream media suggesting a top is here!
Wave 2 retracement is expected to find support at the High Volume Node and 0.236 Fibonacci retracement $6.48 where it should find confluence with the weekly 200EMA and R1 pivot.
Weekly RSI is overbought with no divergence.
Wave 3 has an expected target of at least $50
Safe trading
IREN Wave 3 complete Wave 3 appears to be complete with a thrust above the weekly R5 pivot on NASDAQ:IREN .
Sentiment is extremely greed on social and mainstream media warning of a top.
Wave 4 has a target of the R3 pivot and 23.6 Fibonacci retracement at $28, new traders and investors will be trapped buying the hype...
I will look for new longs in this area as I think we go higher long term...
Safe trading

Oil Bulls Beware: 65.5 Could Be the Turning Point📲 NFX Oil Trade Alert – Quick View
GBEBROKERS:USOIL – Resistance Test in Play
📍 Current Level: 65.00
📈 Next Target: 65.45–65.90 (38.2% Fib + Supply-Demand Zone)
⚠️ RSI likely to hit overbought at this zone → potential short setup
📉 Bias: Bearish rejection at 65.5 (preferred scenario) → Target back to 62
🔎 Catalyst: Bullish ECONOMICS:USGPRO EIA report, but effect already priced in from Monday’s rally.
📊 Oil Trade Analysis – Detailed Breakdown
FX:USOIL tested 65.00 after breaking out of the 64.1–64.5 SR zone post–EIA report (23.6% Fib retracement). This marks the second bullish report in a row, but this one was weaker, and the reaction looks mostly priced in after the rally from Monday to today.
Currently, price is hovering around 65.00, which is acting as a minor support. While this level may hold temporarily, it’s unlikely to sustain against broader resistance at 65.5.
I’m expecting price to push further towards the 38.2% Fib retracement (65.45–65.90), which also aligns with a major supply-demand zone. At this level, RSI will likely flash overbought, making it my preferred area to look for shorts.
🔀 Scenarios
Path A – Bearish Rejection (Most Probable)
Resistance holds at 65.5 zone.
Expectation: Sharp rejection → price retraces back to 62 (lower band of range).
Path B – Extended Rally (Less Probable)
Price breaks and sustains above 65.9.
Would invalidate immediate short setup and open path towards higher Fib levels.
⚖️ Fundamentals
While the EIA report acted as a short-term catalyst, supply hike remains a heavy bearish overhang. Nothing has changed on the bigger picture.
💬 Game Plan
Watching closely for clear rejection at 65.5. That’s where I’ll be pulling the trigger for shorts.

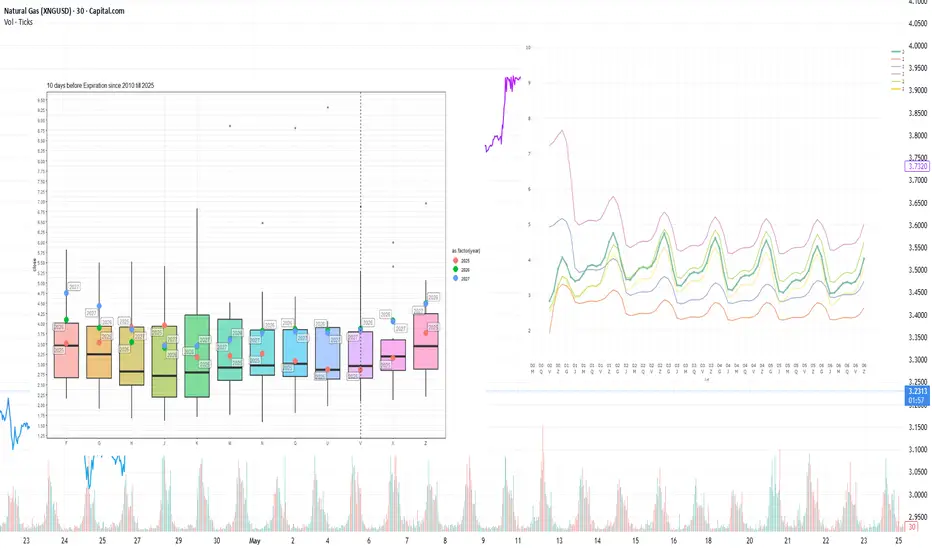
LNG:Storage Inventories Projected to Increase above 2024 Levels.*Due to the platform's features, the charts are arranged in sequence from left to right, from the first to the ninth chart.
Current prices vs. price spread 10 days before expiration by month since 2010
The expiration of the NGV25 contract is occurring near the 15-year median. The subsequent NGX25 contract is currently trading around the 10-day pre-expiration historical average, however, showing elevated volatility. Winter 2026 contract prices remain above the interquartile range.
Current forward curve vs. 2020-2024
The forward curve shape remains stable, increasingly resembling the configurations observed on comparable calendar dates in 2023 and 2024. This pattern is particularly evident in contracts with delivery three years from now or longer, where a pronounced convergence toward historical pricing levels is occurring.
Current inventory and forecast for next week compared to 2019-2024
During Week 38 (September 15–21), storage inventories are projected to increase by +76 BCF, reaching 3,509 BCF — already surpassing 2024 storage levels. Meanwhile, injection rates have slowed due to reduced cooling demand and now align with the five-year median pace. Elevated production remains the primary driver behind inventory growth.
Weekly HDD+CDD total from current NOAA data and forecast for the next two weeks comparing 1994-2024
Across the continent, the current year’s Week 39 is marked by HDD+CDD values significantly below the 30-year historical average. Forecasts for Week 40 suggest continued weakness in these metrics, which is expected to suppress demand further and may reignite downward pressure on prices.
Explanation of the chart: candles represent quantiles for 30 years from 1994 to 2024. Red dots 2024, green 2025, blue prediction 2025.
Weekly HDD+CDD total from current NOAA data and forecast for the next two weeks compared to 1994-2024 by region
Forecasts across key regions align with the broader trend: HDD+CDD values remain below the 30-year historical average.
Weekly cumulative supply/demand differentials compared to 2014-2024
Despite elevated inventory levels and robust production pace, the weekly aggregate supply-demand spread chart for the 2014–2024 period illustrates a key observation: the divergence between demand and supply has widened significantly above the decade-long average and now mirrors the level seen during the same week in 2024. The main factors sustaining strong demand include consistently high LNG exports, steady industrial consumption, and gas-fired power generation.
Number of Days for Deliveries from Storages
The chart illustrates the number of supply days equated to solely storage deliveries, assuming current consumption levels. In February–March 2025, inventories stood at 10–18 days — it’s comparable to or slightly below the historical average. From May through August, coverage increased to 25–35 days, which remains somewhat below the 10-year range. By September 2025, inventories rose to 33 delivery days, aligning with the median but still below the peaks observed in 2015–2016. This moderate level of storage adequacy creates a structurally tighter market, where even minor production disruptions or modest demand spikes can trigger disproportionate price reactions - especially during the late winter to early spring period.
Weather Anomalies (HDD+CDD) and Fundamental Factors
Overall, fundamental factors and weather anomalies are within the expected range, with no systemic deviations, except for isolated declines in LNG exports and Mexican exports, which may temporarily support prices.
Anomalies in Power Generation Sources
Core generation across most sources has evidently stabilized, with remaining key anomalies observed in coal, hydro, and solar output.
This analysis was conducted in cooperation with Anastasia Volkova, analyst of LSE.
CRUDE OIL (WTI): Strong Intraday Confirmation
A quick follow-up for the yesterday's analysis on WTI Crude Oil.
The price went up as I predicted.
The market managed to violate a resistance line of a bullish flag pattern
on an hourly time frame, providing a strong intraday confirmation.
The price will likely grow more and reach 65.58 level after a completion of a retracement.
❤️Please, support my work with like, thank you!❤️
I am part of Trade Nation's Influencer program and receive a monthly fee for using their TradingView charts in my analysis.

Natural Gas & Oil Rally...What You Need to KnowNatural gas price action made a bullish reversal on the daily chart.
Closing up 1.8% ahead of inventories is very aggressive trading by the bulls.
The last couple of inventory prints have been bearish.
Crude Oil inventories sent WTI crude higher.
Energy & oil stocks were very strong today on the drop in oil inventories.
September 19 week inventories dropped by about 3.5 Million barrels.
This is showing a greater demand for oil.
Crude is still chopping around in a very dangerous technical level. Hasn't broken out or down.

Blood in the streets...Is a Bear Market Starting? We discuss the technical obseravtion in the SPX / SPY.
Why was IWM so weak today?
What is happening with inflation & why are yields rallying?
Are tensions with Russia escalating?
Today we closed IWM 241 puts for 150% gain.
We took profits on many other short ideas & entered several new trades today.
Caution needs to be warranted since the Dollar and oil are rallying.

Resistance or Support What was once support has now become resistance.
Once again, the price is drawn to areas of greater recurrence, as that is where liquidity lies.
If you don't pay attention to the charts, you may miss the opportunity.
The strategy is simple: look at that big trend line that was generated, and you'll notice that it's the freshest liquidity there is. Keep your eyes on the screen!
Keep it simple!
If you liked it, don't forget to follow me.

Crude oil: Sell around 64.90, target 63.00-61.00Crude Oil Market Analysis:
The rise in crude oil prices has left many investors confused. Shouldn't they be selling crude oil? Why is it so strong again? A look at the 4-hour candlestick chart will show that the current rally is still within a range of fluctuations and hasn't broken out. Furthermore, the range-bound resistance level is approaching again. It's a good time to sell immediately. The overall trend for crude oil is bearish, and short-term volatility recovery is expected.
Fundamental Analysis:
Gold surged and then retreated, while the US dollar rebounded sharply after hitting a bottom. No major market data was released, and the Fed's policy has no sustained impact on the market in the short term.
Trading Recommendations:
Crude oil: Sell around 64.90, target 63.00-61.00

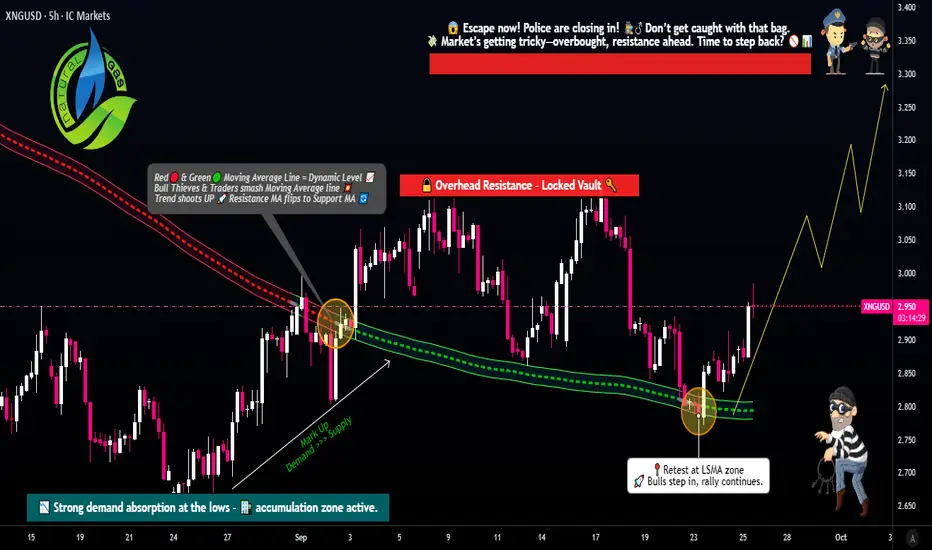
XNG/USD Swing Trade Plan – Entry, Stop, and Target Explained🚀 NATURAL GAS (XNG/USD) – Energies Market Wealth Strategy Map ⚡🔥
(Swing Trade Setup – Thief Layered Style)
📊 Plan
✅ Bullish confirmation spotted with LSMA pullback 🟢
✅ Thief’s unique layering entry strategy 🎭 — stacking multiple buy limit orders to sneak into the market like a pro.
Layered Entry Levels:
Buy Limit @ 2.800 🧩
Buy Limit @ 2.850 🧩
Buy Limit @ 2.900 🧩
Buy Limit @ 2.950 🧩
(Feel free to add more layers based on your own risk appetite.)
🛡️ Risk Management
Stop Loss (Thief SL): ⚠️ @ 2.750
(Note: Dear Ladies & Gentlemen – Thief OG’s – this SL is my style. Always set your own SL according to your risk.)
🎯 Target Zone
👮 Police Barricade spotted around 3.300 🚨
Here we have:
Strong resistance wall 🧱
Overbought signals 📈
Potential trap zone
👉 Take your profits before the market police catch you! Escape with your bags full 💼💨
(Note: Dear Ladies & Gentlemen – Thief OG’s – this TP is my style. Always set your own target according to your profit goals.)
🔍 Related Pairs & Correlations
FXOPEN:XNGUSD (Natural Gas) – our main thief play 🎭
BLACKBULL:WTI / TVC:UKOIL (Crude Oil & Brent) 🛢️ – often show energy sector momentum correlation
ICMARKETS:XBRUSD (Brent Crude) – watch for confirmation of energy strength 🔥
SP:SPX / TVC:DXY (S&P 500 & US Dollar Index) – dollar strength can pressure commodities
OANDA:XAUUSD (Gold) – safe haven vs energy volatility ⚡
Correlated markets can confirm direction or signal early reversals. Always watch the energy family together for big moves.
✨ “If you find value in my analysis, a 👍 and 🚀 boost is much appreciated — it helps me share more setups with the community!”
⚠️ Disclaimer: This is a thief-style trading strategy created just for fun & educational purposes. Not financial advice. Trade safe, trade smart.
#XNGUSD #NaturalGas #Commodities #SwingTrade #EnergyMarkets #LayeringStrategy #TradingCommunity #MarketThief #OGStyle
CRUDE OIL (WTI): More Growth Ahead
WTI Oil broke and closed above a strong rising trend line on a daily.
We see a pullback and a correctional movement now.
I think that growth will resume soon and the price will rise
to 65.55 level.
❤️Please, support my work with like, thank you!❤️
I am part of Trade Nation's Influencer program and receive a monthly fee for using their TradingView charts in my analysis.

Crude oil: go long on pullback to 63.8After crude oil rose yesterday, it gained upward momentum again during today's European session, with short-term trend biased toward bullish. Focus on going long when it pulls back to 63.80; if it breaks below 63.20, exit the position on the pullback. The target is 64.80. If it breaks below 63.20 during the US session, then focus on entering long positions again at the 0.5 and 0.618 support levels of the overall upward pullback later.
Daily-updated accurate signals are at your disposal. If you run into any problems while trading, these signals serve as a reliable reference—don’t hesitate to use them! I truly hope they bring you significant assistance

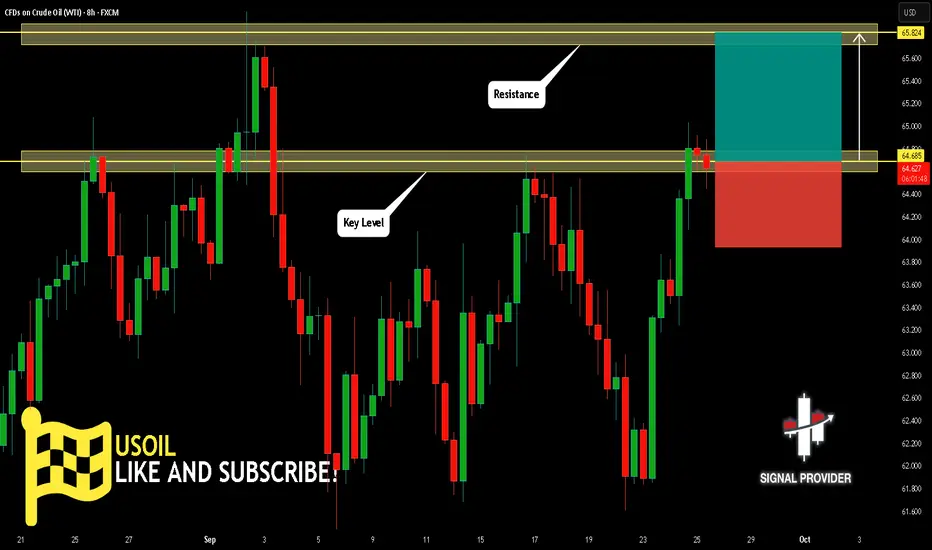
USOIL Is Bullish! Long!
Please, check our technical outlook for USOIL.
Time Frame: 8h
Current Trend: Bullish
Sentiment: Oversold (based on 7-period RSI)
Forecast: Bullish
The market is trading around a solid horizontal structure 64.685.
The above observations make me that the market will inevitably achieve 65.824 level.
P.S
The term oversold refers to a condition where an asset has traded lower in price and has the potential for a price bounce.
Overbought refers to market scenarios where the instrument is traded considerably higher than its fair value. Overvaluation is caused by market sentiments when there is positive news.
Like and subscribe and comment my ideas if you enjoy them!