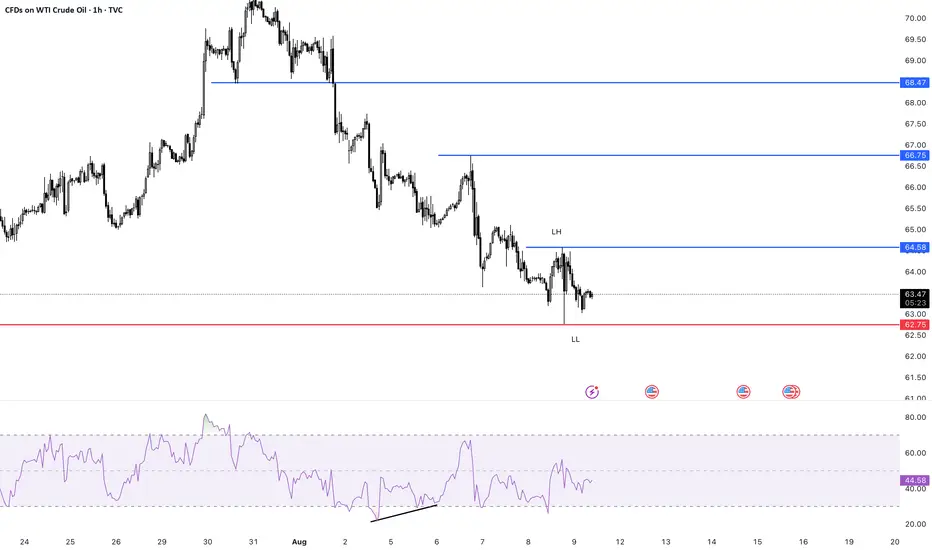
WTI Bull setupSwing trade
Bull points
- RSI div
- Wait for trend reversal
Put Buy stop on last Lower High or wait for HH and HL or reversal
RRR 1:1
Go for 1:2 manage your risk first...
Energy Commodities
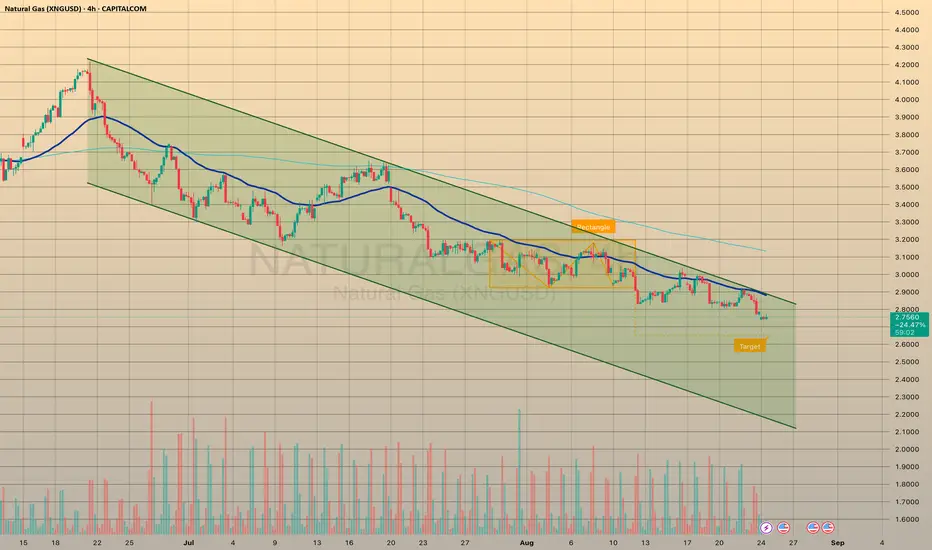
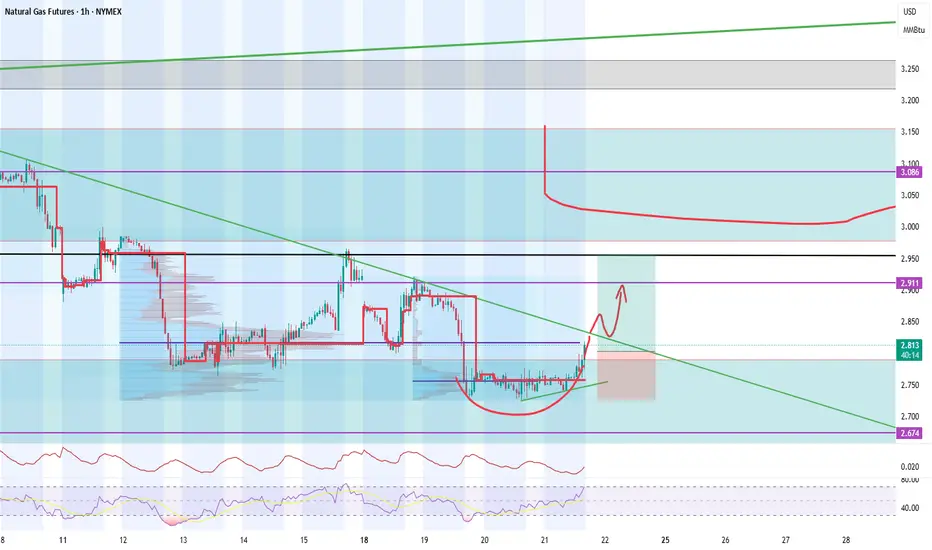
2 Month Descending ChannelSeptember natural gas futures plunged to a nine-month low on August 22, dropping 4.5% amid near-record output, ample storage, and cooler weather reducing demand. Despite a rebound in LNG exports, prices have fallen for five straight weeks, down 24% overall.
Record U.S. production in August averages 108.4 bcfd, while storage remains 6% above normal. Demand, including exports, is expected to ease in coming weeks, with LNG feedgas rising to 16.2 bcfd as plants recover from outages. Hurricane activity in the Atlantic poses no immediate threat to U.S. supply. Analysts expect U.S. LNG exports to grow about 10% annually through 2030.
BRIEFING Week #34 : The Rotation may have BegunHere's your weekly update ! Brought to you each weekend with years of track-record history..
Don't forget to hit the like/follow button if you feel like this post deserves it ;)
That's the best way to support me and help pushing this content to other users.
Kindly,
Phil

Gold | Oil | Dollar | Silver | Natural Gas Price Forecast Support & Resistance Guide
Natural Gas NYMEX:NG1! stock Bulls AMEX:UNG
USO NYMEX:CL1! Oil Stock price Forecast
DXY US dollar Stock analysis
Gold COMEX:GC1! XAUUSD Stock price Forecast
Silver XAGUSD stock analysis

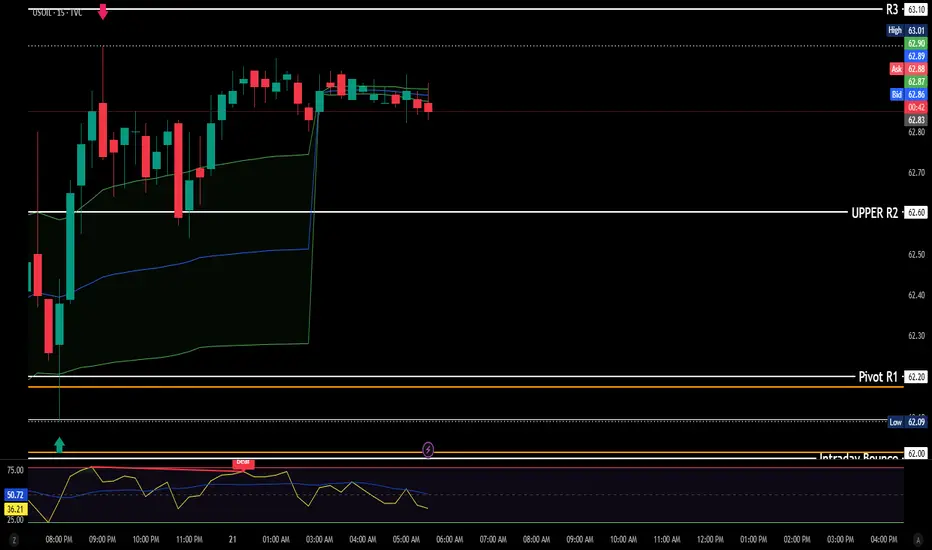
WTI Crude Oil · M15 · 24-Aug — “Buy the Dip into EMA/Donchian”🟢 Bias: Intraday long after spike, buy the dip into Donchian + EMA support.
Entry: $62.90 – $63.20
Stop-Loss: $61.95
Targets: TP1 $63.80 · TP2 $64.70 · TP3 $66.00
RRR (from $63.10): Risk $1.15 → TP3 +$2.90 = ~1:2.5 ✅
Why this works:
Confluence: Donchian support ($62.91) + 200 EMA M15 ≈ $62.38 (white).
Structure: Higher highs/lows since Aug-20; volume expands on pushes, compresses on pullbacks.
HTF context: H4 pressing toward 200 EMA ≈ $64.7–$65.0 (key pivot).
Execution: Look for a bullish rejection/engulfing inside the box + 8/21 EMA hold (orange/blue) above the 200 EMA (white).
Risk: ≤ 1%. Move SL→BE after TP1.
Trade Confidence: ⭐⭐⭐⭐ (High if retest holds and 8/21 maintain bullish structure)
🔒 Want more? The Prime version below adds: alternate short plan at $64.7–$65.0, management ladder, HL tight-stop variant (~4R), and a full execution checklist. Follow on Skool, link in profile!
⚠️ Trading involves risk. Manage exposure and trade responsibly.
💬 Thoughts on this setup?

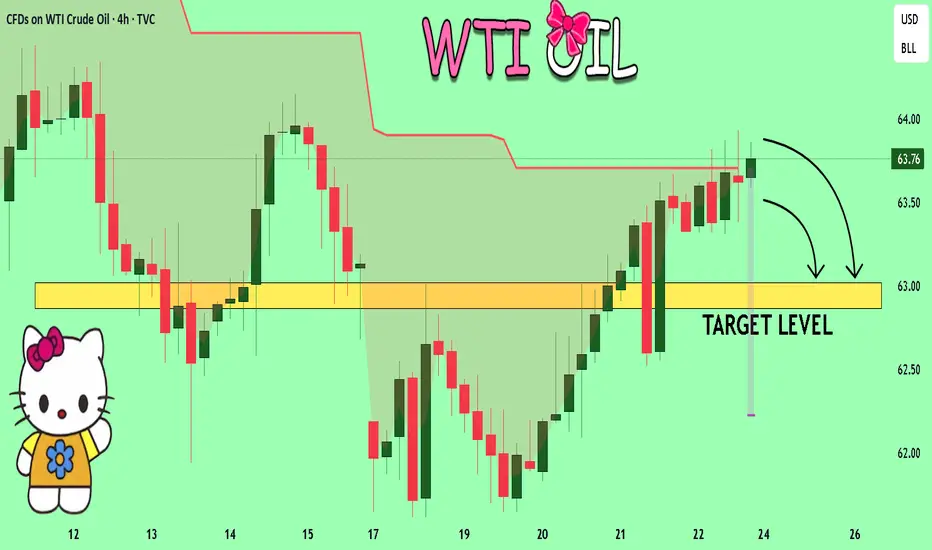
USOIL SENDS CLEAR BEARISH SIGNALS|SHORT
USOIL SIGNAL
Trade Direction: short
Entry Level: 63.73
Target Level: 61.24
Stop Loss: 65.36
RISK PROFILE
Risk level: medium
Suggested risk: 1%
Timeframe: 8h
Disclosure: I am part of Trade Nation's Influencer program and receive a monthly fee for using their TradingView charts in my analysis.
✅LIKE AND COMMENT MY IDEAS✅

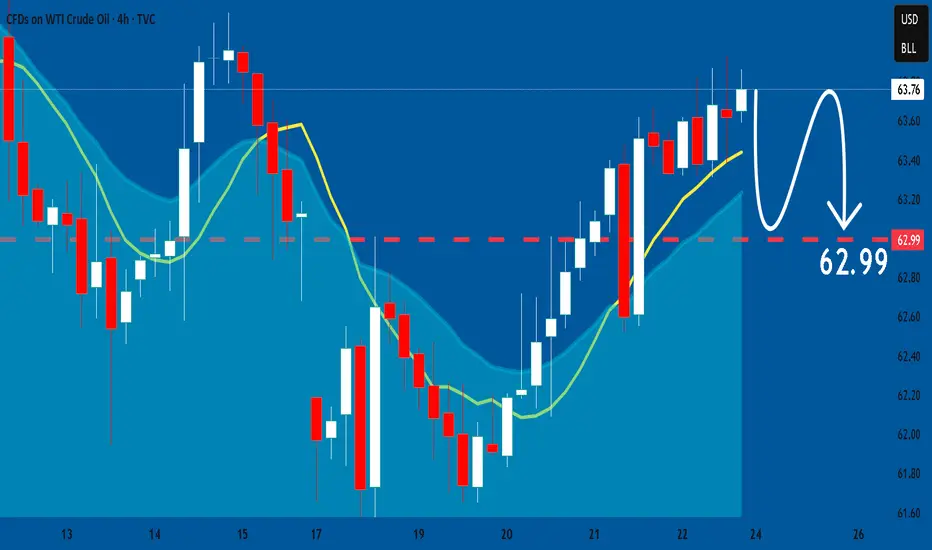
USOIL Set To Fall! SELL!
My dear subscribers,
This is my opinion on the USOIL next move:
The instrument tests an important psychological level 63.76
Bias - Bearish
Technical Indicators: Supper Trend gives a precise Bearish signal, while Pivot Point HL predicts price changes and potential reversals in the market.
Target - 63.02
About Used Indicators:
On the subsequent day, trading above the pivot point is thought to indicate ongoing bullish sentiment, while trading below the pivot point indicates bearish sentiment.
Disclosure: I am part of Trade Nation's Influencer program and receive a monthly fee for using their TradingView charts in my analysis.
———————————
WISH YOU ALL LUCK
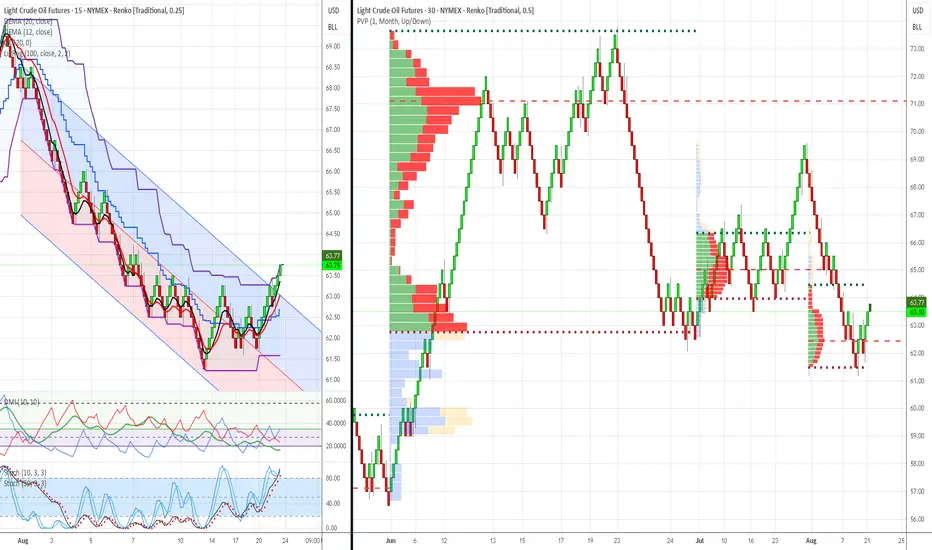
WTI Crude Oil Trading Analysis: June-August 2025 - 25-AugustWTI Crude Oil Trading Analysis: June-August 2025 Review & Week of August 25th Recommendations
Analysis Date : August 23, 2025
Market : WTI Crude Oil Futures (CL1!)
Methodology : Dual Renko Chart System ($0.25/15min + $0.50/30min)
Volume Profile : 3-Month Monthly Analysis (June-August 2025)
Executive Summary
Market Regime: Oil has completed a major corrective phase from $72 highs to $61 lows, establishing a clear bottoming pattern with strong institutional accumulation. Current setup presents high-probability bullish swing opportunity with excellent risk/reward characteristics.
Current Status : Bullish reversal confirmed with multiple technical confluences at critical support zone. Recommended positioning for upside targets with systematic risk management protocols.
3-Month Market Structure Analysis (June-August 2025)
Phase 1: Distribution & Breakdown (June-July)
Price Action: $72 → $61 (-15% decline)
June Peak: Heavy red volume distribution at $71-72 level indicated institutional selling
July Decline: Clean Renko downtrend with sustained selling pressure
Volume Profile: Minimal volume during decline, suggesting limited buying interest until $63-64 zone
Phase 2: Accumulation & Reversal Setup (Late July-August)
Price Action: $61 → $63.50 (+4% recovery)
Institutional Buying: Massive green volume accumulation at $63-65 level
Support Establishment: $62-63 zone showing strong buying interest
Technical Reversal: DEMA crossover confirmed bullish momentum shift
Volume Profile Key Levels (3-Month Analysis)
Major Support Zones :
$62-63: Primary institutional accumulation (heaviest green volume)
$60-61: Secondary support with moderate green volume
$58-59: Ultimate support level (limited historical volume)
Resistance Zones:
$66-67: First institutional resistance (mixed volume)
$69-70: Major distribution zone (heavy red volume from June)
$71-72: Ultimate resistance (peak selling pressure)
Current Technical Analysis (August 23, 2025)
Dual Chart Assessment
$0.50 Chart (Structure Analysis):
Trend: Clear bottoming pattern completed at $61 low
Current Position: Testing above major institutional accumulation zone
Volume Confirmation: Trading within heaviest 3-month green volume cluster
Structure: Higher lows pattern emerging since $61 bottom
$0.25 Chart (Execution Analysis):
DEMA Status: Bullish crossover confirmed (Black above Red at $63.00)
DMI/ADX: +DI gaining momentum, ADX rising through 25 level
Donchian Position: Price above basis, testing toward upper band
Recent Action: 3 consecutive green bricks confirming upward momentum
Technical Confluences Supporting Bull Case
Volume Profile: Massive institutional support at current levels
DEMA Crossover: Clear trend reversal signal confirmed
Momentum: DMI showing bullish shift with strengthening ADX
Structure: Higher low pattern vs. $61 bottom
Risk/Reward: Excellent positioning near major support zone
Market Context & Macro Considerations
Current Oil Market Dynamics
Supply: OPEC+ spare capacity at 5.9 million b/d (bearish)
Demand: China slowdown offset by US resilience (neutral)
Inventories: Below 5-year average (bullish)
Refining: Margins supporting crude demand (bullish)
Federal Reserve Impact
Policy Stance: Potential September rate cut (bullish for commodities)
Dollar Weakness: Could support oil prices
Inflation Expectations: Rising energy costs could influence policy
Seasonal Factors
Driving Season: Peak summer demand ending (bearish)
Hurricane Season: Atlantic activity potential (bullish)
Refinery Maintenance: September turnaround season (mixed)
Conclusion & Strategic Outlook
Near-Term Assessment (1-2 weeks): The current setup represents a high-probability swing trading opportunity with exceptional risk/reward characteristics. The combination of institutional volume support, technical reversal signals, and favorable market structure creates optimal conditions for bullish positioning.
Medium-Term Outlook (1-3 months): Successful navigation through the $66-68 resistance zone could establish a broader recovery toward $70-72 levels. However, macroeconomic headwinds and seasonal factors require careful position management and profit-taking discipline.
Risk Assessment: While the setup is compelling, traders must respect the institutional accumulation levels as ultimate support. Any violation of the $62 zone would invalidate the bullish thesis and require immediate position liquidation.
Strategic Advantage: The dual Renko chart system provides both structural clarity and tactical precision, enabling confident position sizing and systematic risk management. The monthly volume profile offers institutional-level insight typically unavailable to retail traders.
Document Classification: Trading Analysis & Recommendations
Risk Disclaimer: Past performance does not guarantee future results. All trading involves risk of loss.
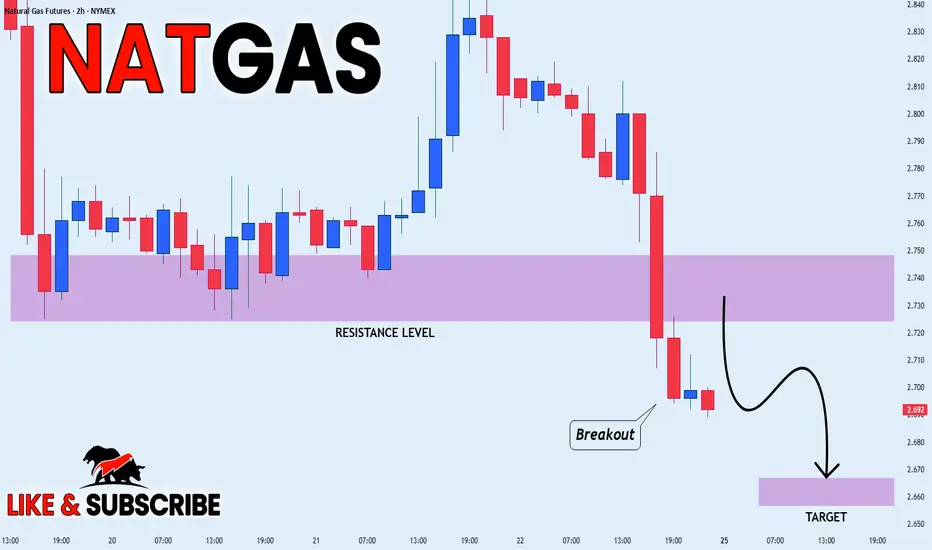
NATGAS WILL KEEP FALLING|SHORT|
✅NATGAS is going down currently
As the Gas broke the key structure level of 2.73$
Which is now a resistance, and after the pullback
And retest, I think the price will go further down
SHORT🔥
✅Like and subscribe to never miss a new idea!✅
CRUDE OIL Pullback Ahead! Sell!
Hello,Traders!
CRUDE OIL is etching closer
And closer towards the
Horizontal resistance of 64.60$
So as we are bearish biased
We will be expecting a local
Pullback on Monday
After the retest
Sell!
Comment and subscribe to help us grow!
Check out other forecasts below too!
Disclosure: I am part of Trade Nation's Influencer program and receive a monthly fee for using their TradingView charts in my analysis.

USOIL: Swing Trading & Technical Analysis
The recent price action on the USOIL pair was keeping me on the fence, however, my bias is slowly but surely changing into the bearish one and I think we will see the price go down.
Disclosure: I am part of Trade Nation's Influencer program and receive a monthly fee for using their TradingView charts in my analysis.
❤️ Please, support our work with like & comment! ❤️
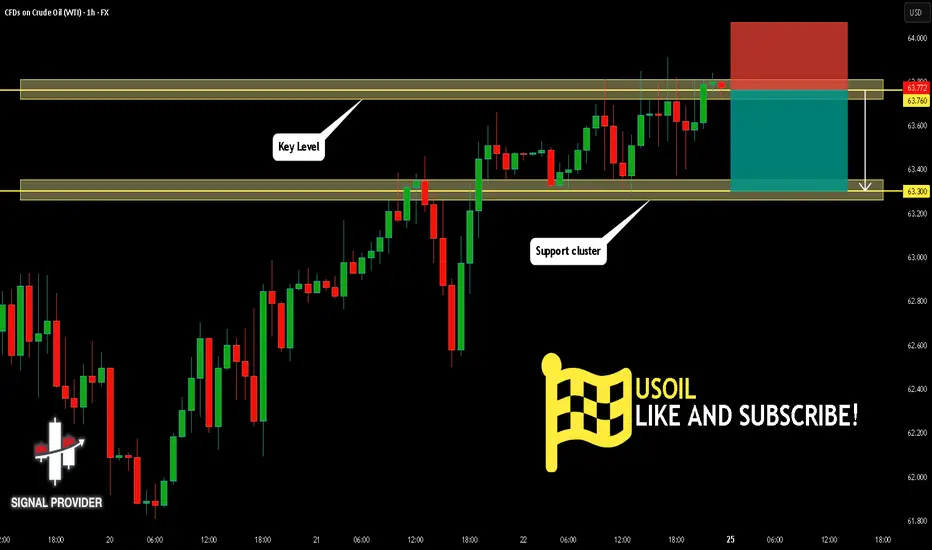
USOIL Is Going Down! Sell!
Please, check our technical outlook for USOIL.
Time Frame: 1h
Current Trend: Bearish
Sentiment: Overbought (based on 7-period RSI)
Forecast: Bearish
The market is approaching a significant resistance area 63.760.
Due to the fact that we see a positive bearish reaction from the underlined area, I strongly believe that sellers will manage to push the price all the way down to 63.300 level.
P.S
Overbought describes a period of time where there has been a significant and consistent upward move in price over a period of time without much pullback.
Disclosure: I am part of Trade Nation's Influencer program and receive a monthly fee for using their TradingView charts in my analysis.
Like and subscribe and comment my ideas if you enjoy them!
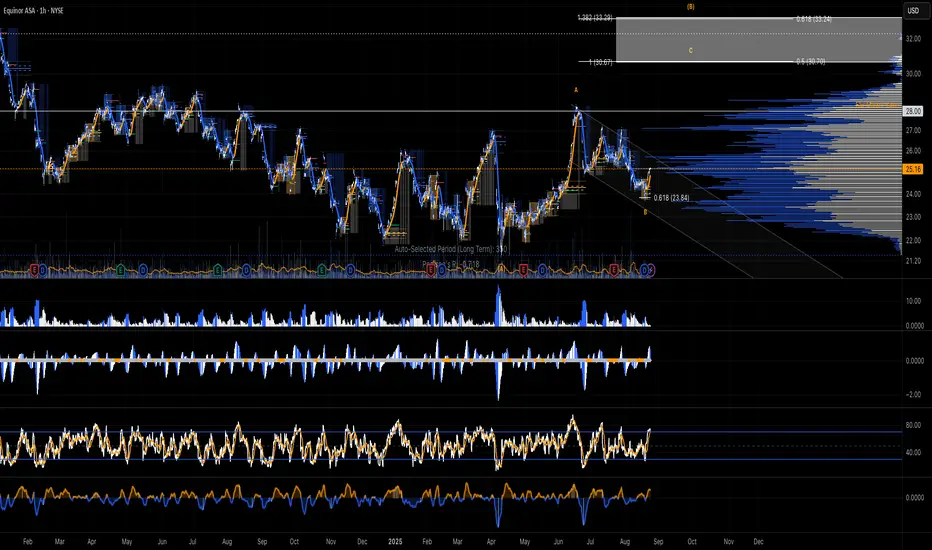
Equinor ASA ($EQNR) ~ Beautiful WaVes...Business Summary
Equinor ASA, formerly Statoil ASA is a Norway-based international energy company. The Company’s purpose is to turn natural resources into energy. Equinor sells crude oil and delivers natural gas to the European market. It is also engaged in processing, refining, offshore wind and carbon capture and storage activities. Equinor ASA has five reporting segments: Exploration & Production Norway (E&P Norway), Exploration & Production International (E&P International), Exploration & Production USA (E&P USA), Marketing, Midstream & Processing (MMP) and Renewables (REN). The Company has several subsidiaries such as Equinor Nigeria Energy Company Ltd, Equinor Wind Power AS, Equinor International Netherlands BV and Equinor Brasil Energia Ltda. EQNR 1.15%↑
Financial Summary
BRIEF: For the six months ended 30 June 2025, Equinor ASA (ADR) revenues increased 8% to $54.51B. Net income decreased 13% to $3.94B. Revenues reflect Marketing, Processing and Renewable Energy segment increase from $25.14B to $53.86B, Exploration and Production - International segment increase of 90% to $308M. Net income was offset by REN segment loss increase from $90M to $1.26B, Marketing.
CRUDE OIL SHORT FROM RESISTANCE|
✅CRUDE OIL is going up now
But a strong resistance level is ahead at 64.50$
Thus I am expecting a pullback
And a move down towards the target of 63.33$
SHORT🔥
✅Like and subscribe to never miss a new idea!✅


UKOIL H4 | Bullish riseUKOIL is falling towards the buy entry which is a pullback support and could bounce from this level to the upside.
Buy entry is at 66.99
Stop loss is at 65.64
Take profit is at 69.79
High Risk Investment Warning
Trading Forex/CFDs on margin carries a high level of risk and may not be suitable for all investors. Leverage can work against you.
Stratos Markets Limited (tradu.com ):
CFDs are complex instruments and come with a high risk of losing money rapidly due to leverage. 65% of retail investor accounts lose money when trading CFDs with this provider. You should consider whether you understand how CFDs work and whether you can afford to take the high risk of losing your money.
Stratos Europe Ltd (tradu.com ):
CFDs are complex instruments and come with a high risk of losing money rapidly due to leverage. 66% of retail investor accounts lose money when trading CFDs with this provider. You should consider whether you understand how CFDs work and whether you can afford to take the high risk of losing your money.
Stratos Global LLC (tradu.com ):
Losses can exceed deposits.
Please be advised that the information presented on TradingView is provided to Tradu (‘Company’, ‘we’) by a third-party provider (‘TFA Global Pte Ltd’). Please be reminded that you are solely responsible for the trading decisions on your account. There is a very high degree of risk involved in trading. Any information and/or content is intended entirely for research, educational and informational purposes only and does not constitute investment or consultation advice or investment strategy. The information is not tailored to the investment needs of any specific person and therefore does not involve a consideration of any of the investment objectives, financial situation or needs of any viewer that may receive it. Kindly also note that past performance is not a reliable indicator of future results. Actual results may differ materially from those anticipated in forward-looking or past performance statements. We assume no liability as to the accuracy or completeness of any of the information and/or content provided herein and the Company cannot be held responsible for any omission, mistake nor for any loss or damage including without limitation to any loss of profit which may arise from reliance on any information supplied by TFA Global Pte Ltd.
The speaker(s) is neither an employee, agent nor representative of Tradu and is therefore acting independently. The opinions given are their own, constitute general market commentary, and do not constitute the opinion or advice of Tradu or any form of personal or investment advice. Tradu neither endorses nor guarantees offerings of third-party speakers, nor is Tradu responsible for the content, veracity or opinions of third-party speakers, presenters or participants.

Hellena | Oil (4H): SHORT to support area of 60 (Wave "3").Wave “C” continues to develop in a five-wave movement. Right now, I think wave “1” has just ended and we will see a small correction to the 66,280 area (wave ‘2’), after which I expect wave “3” to develop, which should go further than the 60 support level, but this is a fairly strong psychological level at which it would be good to take profits.
Manage your capital correctly and competently! Only enter trades based on reliable patterns!

NATGAS - Potential UPI notice a support with a potential accumulation patter for a new phase UP until 3$
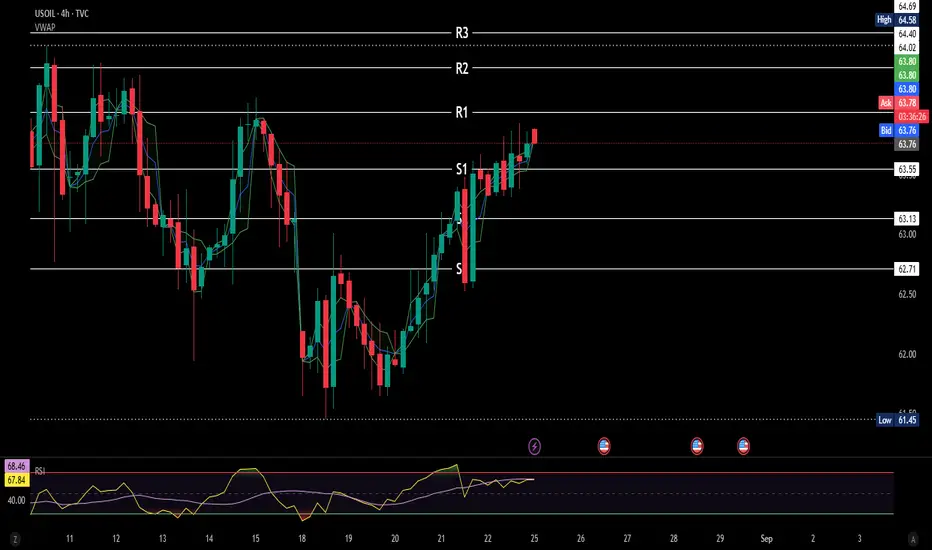
USCrudeOil| Inventory Draw Lifts Prices Fed Geopolitics in Focus🛢️ USCRUDE OIL – Overview
Oil edges higher amid U.S. stock draw
WTI crude oil futures rose to $63.45 per barrel on Thursday, extending gains from the previous session after U.S. crude inventories posted a bigger-than-expected draw.
📊 EIA data showed stockpiles fell by 6 million barrels to 420.7 million, compared to expectations for a 1.3 million-barrel draw, providing short-term support for prices.
At the same time, markets are watching closely for progress in the Russia-Ukraine peace talks, brokered by U.S. President Donald Trump. Any breakthrough that results in easing sanctions on Russian crude exports could shift global supply dynamics.
Despite the latest rebound, crude prices remain down over 10% year-to-date, pressured by expectations of oversupply as OPEC+ restores output and tariff concerns weigh on demand outlook.
🔎 Technical Outlook
Bearish Scenario:
As long as price trades below the pivot line at 63.47, downside targets are seen at 61.83, and a break lower could extend losses toward 60.16.
Bullish Scenario:
A 4H candle close above 63.47 would open the way toward 64.72, with further upside potential toward 65.80 – 67.20.
📍 Key Levels
Pivot: 63.47
Support: 62.25 – 61.85 – 60.20
Resistance: 64.70 – 65.80 – 67.20
⚠️ Crude remains highly sensitive to geopolitical headlines and inventory data — expect volatility around key supply developments.
Previous idea:

USOIL - intradayPrice has been hovering under ~63 I was hoping we get a break in the Asian session but as always it's chop city.
Now price breaking below VWAP is what I am watching, no confirmation yet but volume efficiency is suggesting bears are slightly in control right now.
NFA
Natural Gas Equities Showing Relative StrengthNatural Gas was briefly red today but saw a bit of a bullish recovery.
Price action came very close to filling the weekly downside gap but just missed it.
Inventories are set to be released tomorrow at 10:30am
Interestingly, Nat Gas stocks like NYSE:AR & NYSE:EQT showed great relative strength in the market today.
Is this signaling a pop in Nat Gas price tomorrow?
We are long NYSE:AR calls from yesterday.

Oil; War or supply and demandOil is preparing for a strong upward move and is in the buying range marked with blue lines and will move at least to the ceiling range if confirmed.
Will the war in the Middle East or US economic policies or supply and demand of OPEC and other producers cause this move?
We have to wait and see
Stay with me and be profitable
Do you have any questions? Ask me in the comments
Don't forget to introduce me to your friends so that we can all profit together?
What do you have in mind that I should analyze for you? Comment for me.
