XTI/USD Short Bias – Can Sellers Maintain Control?🛢️ WTI/USOIL BEARISH SWING TRADE - ENERGIES MARKET OPPORTUNITY 📊
⚡ TRADE SETUP: SHORT OPPORTUNITY
━━━━━━━━━━━━━━━━━━━━━━━━━━━━━━━
📍 ASSET: XTI/USD (WTI Crude Oil) | ENERGIES
⏰ TIMEFRAME: Swing Trade (4H - Daily)
📈 BIAS: BEARISH ⬇️
💼 ENTRY STRATEGY - "LAYERING METHOD" 🎯
━━━━━━━━━━━━━━━━━━━━━━━━━━━━━━
Use Multiple Limit Order Layers for optimal entry execution:
✅ Layer 1: $60.00
✅ Layer 2: $59.00
✅ Layer 3: $58.00
💡 Why This Works:
Averages down your entry price
Reduces slippage risk
Allows gradual position building
Maximizes fill probability
🔧 CUSTOMIZABLE: Adjust layers based on YOUR risk management & capital allocation
🛑 STOP LOSS ⛔
━━━━━━━━━━━━━━━━━━━━━━━━━━━━━━
📌 Recommended SL Level: $61.00 (above supply zone)
⚠️ DISCLAIMER: This is a reference point only. Adjust YOUR stop loss based on:
Your risk tolerance
Account size
Trading strategy
Technical support/resistance
🚨 Risk Management First: Never risk more than 2-3% per trade
🎯 TAKE PROFIT TARGETS 💰
━━━━━━━━━━━━━━━━━━━━━━━━━━━━━━
Primary Target: $53.00 ⬇️
📊 Technical Confluence at $53.00:
✓ Strong support zone (oversold recovery area)
✓ Reversal trap potential
✓ High probability profit zone
💡 Profit-Taking Strategy:
Scale out 1/3 at $56.00 (quick gains lock)
Scale out 1/3 at $54.50 (momentum confirmed)
Scale out 1/3 at $53.00 (final target)
⚠️ DISCLAIMER: This is guidance only. Your profit targets should align with YOUR strategy, market conditions, and risk/reward ratio. Take profits at YOUR comfort level.
═══════════════════════════════════════════════════════════════
🔗 CORRELATED PAIRS TO WATCH 📡
━━━━━━━━━━━━━━━━━━━━━━━━━━━━━━
1. USD/CAD (USDCAD) 📈 POSITIVE CORRELATION
• Current: ~1.4320
• Why: Canada is oil-exporting nation. Oil ⬇️ = CAD weakens
• Action: Watch USD strength - if USD rises, more pressure on oil
• Impact: ⭐⭐⭐⭐⭐ (5/5 Relevance)
2. S&P 500 (US500) 📊 INVERSE CORRELATION
• Current Level: ~6,800+
• Why: Rising energy costs = lower corporate margins = stock weakness
• Action: If stocks fall, risk-off → oil likely continues lower
• Impact: ⭐⭐⭐⭐ (4/5 Relevance)
3. US Dollar Index (USDZZ) 💵 STRONG NEGATIVE CORRELATION
• Why: Oil priced in USD. Strong dollar = cheaper oil for foreigners = lower demand
• Action: Monitor DXY strength - bullish USD = bearish oil
• Impact: ⭐⭐⭐⭐⭐ (5/5 Relevance)
4. Natural Gas (NATGAS/TradingView equivalent) ⚡ SECTOR CORRELATION
• Why: Both energy commodities, affected by demand
• Action: Watch as confirmation signal for energy sector weakness
• Impact: ⭐⭐⭐ (3/5 Relevance)
5. Russian Ruble (USDRUB) 🇷🇺 COMMODITY-LINKED CORRELATION
• Why: Russia major oil producer. Oil prices directly impact RUB
• Action: Weak ruble often signals oil pressure from supply concerns
• Impact: ⭐⭐⭐ (3/5 Relevance)
📋 TRADE CHECKLIST ✓
━━━━━━━━━━━━━━━━━━━━━━━━━━━━━━
✅ Check USD strength confirmation
✅ Verify oversold condition on daily chart
✅ Confirm supply zone rejection above $61
✅ Monitor correlated pairs for confirmation
✅ Set alerts on each layer ($60, $59, $58)
✅ Define your max loss amount (2-3% rule)
✅ Plan exit strategy BEFORE entering
⚡ KEY POINTS SUMMARY 🔑
━━━━━━━━━━━━━━━━━━━━━━━━━━━━━━
🎯 Entry: Layered approach ($60→$59→$58)
🛑 Stop Loss: $61.00 (adjust to YOUR strategy)
💎 Target: $53.00 strong support
📊 Risk/Reward: Define YOUR ratio before entry
🔔 Confirmation: Watch USD, stocks, CAD correlation
Energy Commodities

USOIL H4 | Bearish Drop OffMomentum: Bearish
The price is currently moving along a descending trendline and remains below the Ichimoku Cloud, indicating continued downside pressure.
Sell entry: 60.35
Pullback resitance
Stop loss: 61.42
Pullback resistance
Take profit: 58.21
High Risk Investment Warning
Stratos Markets Limited (tradu.com ), Stratos Europe Ltd (tradu.com ):
CFDs are complex instruments and come with a high risk of losing money rapidly due to leverage. 70% of retail investor accounts lose money when trading CFDs with this provider. You should consider whether you understand how CFDs work and whether you can afford to take the high risk of losing your money.
Stratos Global LLC (tradu.com ): Losses can exceed deposits.
Please be advised that the information presented on TradingView is provided to Tradu (‘Company’, ‘we’) by a third-party provider (‘TFA Global Pte Ltd’). Please be reminded that you are solely responsible for the trading decisions on your account. Any information and/or content is intended entirely for research, educational and informational purposes only and does not constitute investment or consultation advice or investment strategy. The information is not tailored to the investment needs of any specific person and therefore does not involve a consideration of any of the investment objectives, financial situation or needs of any viewer that may receive it. Past performance is not a reliable indicator of future results. Actual results may differ materially from those anticipated in forward-looking or past performance statements. We assume no liability as to the accuracy or completeness of any of the information and/or content provided herein and the Company cannot be held responsible for any omission, mistake nor for any loss or damage including without limitation to any loss of profit which may arise from reliance on any information supplied by TFA Global Pte Ltd.

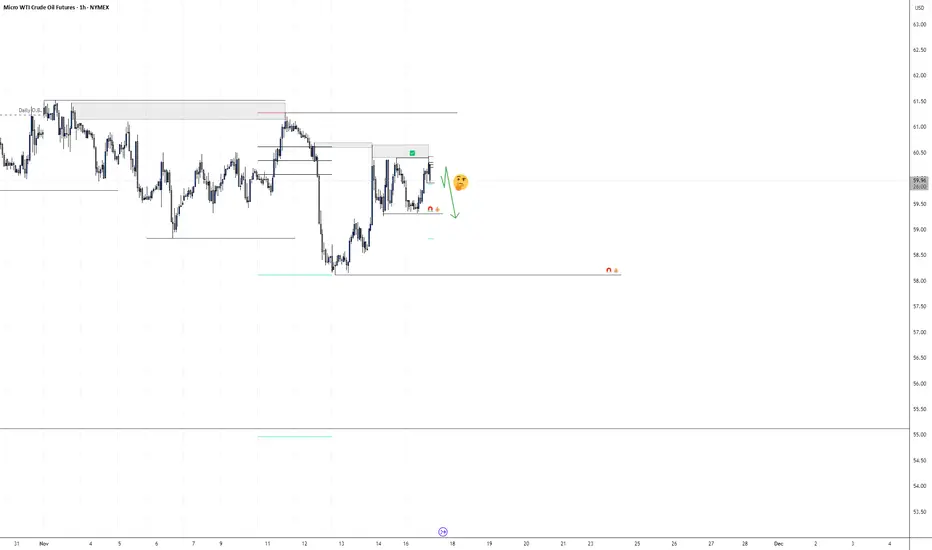
CRUDE OIL (WTI): Bullish Move After Trap
There is a high chance that Crude Oil will pull back
from the underlined daily key level.
I see a confirmed bear trap followed by a bullish imbalance
candle on an hourly.
I expect a rise at least to 58.51 level.
❤️Please, support my work with like, thank you!❤️
I am part of Trade Nation's Influencer program and receive a monthly fee for using their TradingView charts in my analysis.

USOIL BEARISH BIAS RIGHT NOW| SHORT
USOIL SIGNAL
Trade Direction: short
Entry Level: 59.57
Target Level: 56.37
Stop Loss: 61.70
RISK PROFILE
Risk level: medium
Suggested risk: 1%
Timeframe: 1D
Disclosure: I am part of Trade Nation's Influencer program and receive a monthly fee for using their TradingView charts in my analysis.
✅LIKE AND COMMENT MY IDEAS✅

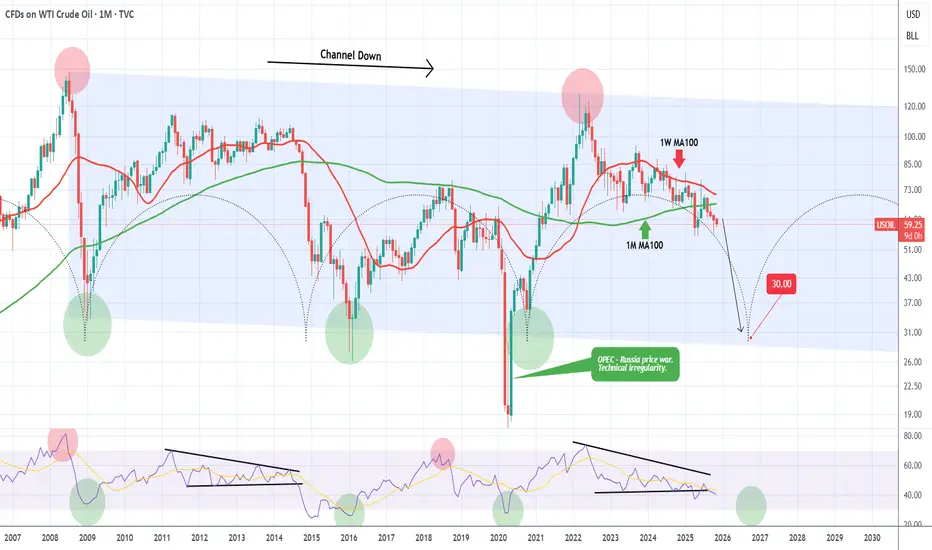
WTI OIL Is it possible to crash at $30.00?WTI Oil (USOIL) has been declining for 3 straight months (current red 1M candle is the 4th one) since the June 2025 rejection on the 1W MA100 (red trend-line). That has been the last rejection of a series of Lower Highs rejections on the 1W MA100 in the past 2 years.
On the much longer-term scale, this is the aftermath of the March 2022 market Top, made as a direct result of the Ukraine - Russia war. On a 17-year horizon, that was the 2nd Lower High of the multi-year Channel Down that WTI has been trading in since the July 2008 Top of the Housing Crisis.
As you can see, there is a high degree of symmetry on this pattern with Lower Lows in particular (market bottoms) getting formed around every 5-6 years. The use of the Time Cycles can fairly accurately project this. The next one is estimated to be towards the end of 2026, which matches perfectly the projected Bear Cycle bottom on the stock markets.
Based on this model, we may very well see WTI drop to as low as $30.00. A fairly solid bottom buy indicator would be when (if) the 1M RSI breaks below its 30.00 (oversold) barrier.
---
** Please LIKE 👍, FOLLOW ✅, SHARE 🙌 and COMMENT ✍ if you enjoy this idea! Also share your ideas and charts in the comments section below! This is best way to keep it relevant, support us, keep the content here free and allow the idea to reach as many people as possible. **
---
💸💸💸💸💸💸
👇 👇 👇 👇 👇 👇
Natural Gas Attempts to Return to the Year’s Highest LevelsSince October 17, natural gas has maintained a steady bullish bias, posting an appreciation of nearly 43%, which has fueled sustained buying pressure on prices. This upward movement has been supported by increasing inventory levels in countries such as China, Japan, and South Korea, which have ramped up purchases ahead of the winter season and diversified suppliers amid potential sanctions involving Russia. If this pace of consistent buying continues in the coming weeks, the current bullish pressure could become even more significant in natural gas price movements over the next few sessions.
Strong Uptrend
In recent weeks, buying momentum has remained persistent, with the average upward impulses in natural gas prices forming a solid uptrend, bringing the market closer to the yearly highs near $4.9. So far, the short-term pullbacks have not been strong enough to break this aggressive bullish trendline. As long as there is no consistent selling pressure, the current uptrend is likely to remain dominant in the short term.
RSI
The RSI line remains above the 50 level, indicating that buying momentum continues to drive price movements. However, the indicator is now approaching the 70 level, suggesting a potential overbought signal. This may imply that, given the speed of the recent rally, the market could experience short-term pullbacks as this imbalance in buying pressure persists.
TRIX
Overall, the TRIX indicator remains above the neutral level, showing a consistent upward slope. This confirms that the long-term trend remains bullish, suggesting that buying pressure may continue to dominate natural gas price action in the coming sessions.
Key Levels to Watch:
$4.80 – Resistance: Represents the recent high zone. A breakout above this level could trigger a more aggressive uptrend in the following sessions.
$4.46 – Intermediate Support: Marks the most recent retracement area, which could serve as a temporary barrier against short-term downward corrections.
$3.84 – Key Support: This is the most relevant retracement level of recent weeks. If prices drop to this zone, it could signal an emerging bearish bias, putting the current bullish trendlines at risk.
Written by Julian Pineda, CFA, CMT – Market Analyst

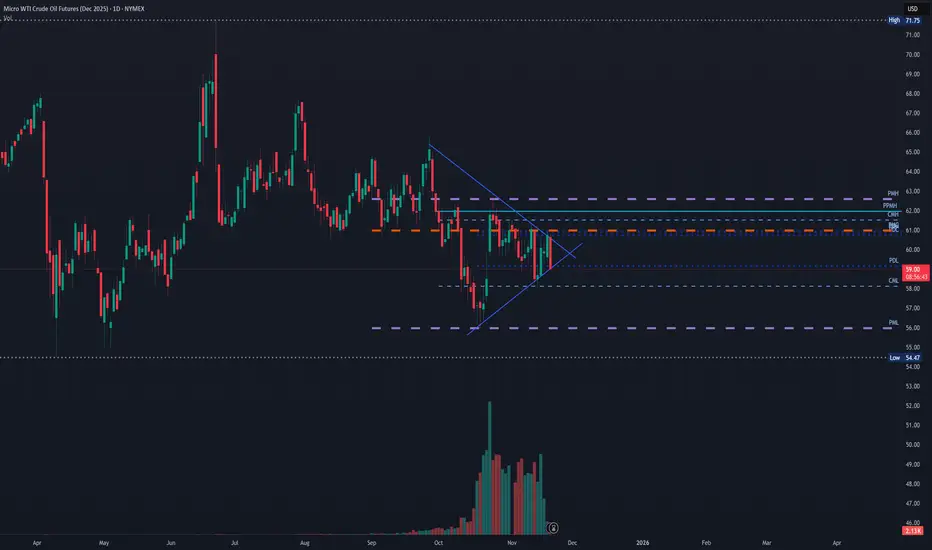
Triangle Pattern in Oil Futures
Does anyone else notice this short term triangle pattern on oil futures?
I will be watching for when it breaks one way or another but I am not that great at understanding oil movements.
If you have any insights, please share
WTI resumes slideExcess supply concerns continue to hold back oil each time it tries to stage a recovery, and today it looks like the market has decided that it wants to trade below $60 per barrel. WTI has been testing this barrier from underneath for a few days but today it looks like the advance has been rejected once again. Prices have broken below the lows of the past two days, thus triggering some stops. From here $58.00 could be the next stop, below which there is nothing significant in terms of support until $55.00.
By Fawad Razaqzada, market analyst with FOREX.com

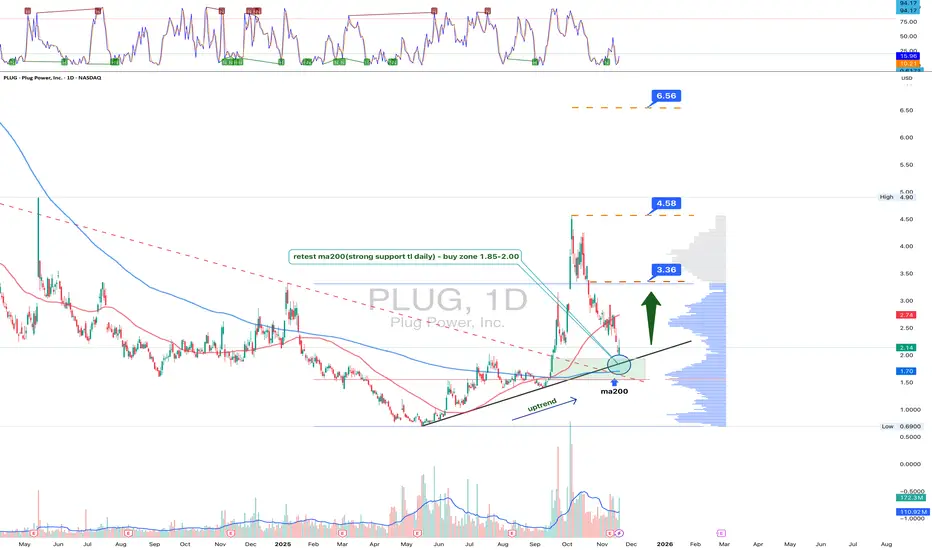
PLUG: recharged on the retest, or another fork with no voltage?PLUG tapped perfectly into the 1.85–2.00 zone - a clean confluence of the MA200, the ascending daily trendline, and the main support that launched the summer rally. Oscillators dipped into oversold, candles show buyer tails, and volume confirms defense of the level. As long as price holds above the trendline, the bullish scenario stands: breaking above 2.70 opens 3.36, and a move above 3.36 targets 4.58. The extended target at 6.56 requires a full breakout from the broader accumulation range.
Company: Plug Power is one of the key players in hydrogen fuel-cell technology, producing electrochemical systems, electrolyzers, and industrial energy solutions for logistics, manufacturing, and infrastructure.
Fundamentally , as of November 19, Plug remains pressured but gradually stabilizing. OPEX continues to decline, manufacturing efficiency improves, and the company expands partnerships in the green hydrogen ecosystem. Revenue volatility persists, but contraction slows, while new electrolyzer deployments build the future pipeline. Scaling production decreases unit costs, and margin improvements suggest the company is climbing out of the worst phase. Policy support and industrial demand keep hydrogen a long-term thematic growth story - though near-term risks remain.
Technically , the bullish structure holds above 1.85–2.00. A breakout above 2.70 activates 3.36, and strength above 3.36 brings the 4.58 target into play. Losing the MA200 risks a prolonged range, but current reaction shows buyers stepping in with precision.
Plug pretends it's collapsing, but really - it’s just plugging itself in for the next run.
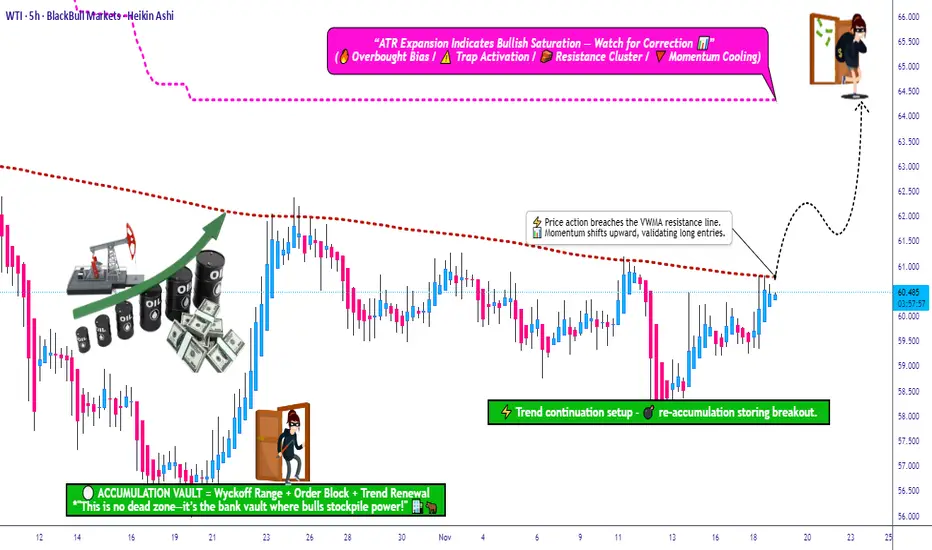
USOIL Breakout Confirmed—Is the Uptrend Ready to Extend?📈 WTI CRUDE OIL (USOIL) – SWING TRADE SETUP | VWMA BREAKOUT CONFIRMED 🛢️⚡
🎯 TRADE OVERVIEW
Asset: WTI Crude Oil (USOIL) – Energies Market
Trade Type: Swing Trade (Multi-Day Position)
Bias: 🟢 BULLISH – Volume Weighted Moving Average (VWMA) breakout confirmed near $61.00
📊 TRADE PLAN
🔹 Entry Strategy: "Thief Layering Method"
Primary Entry Zone: Post-VWMA breakout above $61.00
Layered Limit Orders (Multiple Entry Points):
🟦 Layer 1: $59.00
🟦 Layer 2: $59.50
🟦 Layer 3: $60.00
🟦 Layer 4: $60.50
Note: You can add more layers based on your capital allocation and risk tolerance. This strategy allows averaging into the position as price pulls back.
🛑 Stop Loss Management
Thief's SL: $58.00
⚠️ IMPORTANT: Dear Ladies & Gentlemen (Thief OG's),
This is MY stop loss level. Adjust YOUR stop loss based on YOUR strategy and risk management plan. I do not recommend blindly following my SL – manage your own risk and capital accordingly.
🎯 Take Profit Target
Primary Target: $64.00
Technical Reasoning:
SuperTrend ATR line acts as strong dynamic resistance
Potential overbought zone + bull trap risk
Escape with profits before reversal pressure
⚠️ IMPORTANT: Dear Ladies & Gentlemen (Thief OG's),
This is MY take profit target. Take YOUR money at YOUR own risk. You are responsible for your profit-taking strategy – trail stops, scale out, or exit fully based on YOUR trading plan.
🔗 CORRELATED PAIRS TO WATCH (USD-Denominated)
Monitor these related assets for confirmation and risk assessment:
🛢️ Energy Sector:
Brent Crude Oil (UKOIL) – Typically trades $2-5 above WTI; if Brent is bullish, WTI usually follows
Natural Gas (NATGAS) – Energy sector sentiment indicator
💵 Currency Pairs:
USD/CAD – Inverse correlation to oil (CAD = petro-currency). If oil rises, USD/CAD typically falls
DXY (US Dollar Index) – Strong dollar = bearish pressure on oil. Watch for weakness in DXY to support oil rally
📈 Equity Markets:
Energy Sector ETFs (XLE) – Tracks US energy stocks; bullish XLE confirms oil sector strength
S&P 500 (SPX) – Risk-on sentiment supports commodity prices
⚡ Key Correlation Points:
Oil ↑ + USD/CAD ↓ = Strong bullish confirmation
Oil ↑ + DXY ↓ = Supportive macro environment
Oil ↑ + XLE ↑ = Energy sector momentum aligned
💬 Engagement Call-to-Action
👍 If you found this analysis helpful, smash that LIKE button!
💬 Drop your thoughts in the comments – are you bullish or bearish on oil?
🔔 FOLLOW for more professional trade setups and market insights!

Is Natural Gas In a Bull Market? Nat GAs technicals were defended at a key area especially when you observe the UNG chart.
Today Nat Gas resource stocks were some of the strongest stocks despite the market being weak.
Many resource chart patterns are looking very juicy and bullish.
They could be indicating a robust continuation move on Nat Gas into year end.
My only caution is the weak inventory reports we have been getting for the last 2 weeks.
I would like price to dip on Thursdays report to lessen the risk on the long side.

USOIL : LIVE TRADEHello friends
Given the price growth, you can see that buyers have repeatedly tried to break the resistance but were unsuccessful and the weakness of the trend is quite clear.
Now we can trade with capital and risk management and account management.
This is not a buy or sell offer.
*Trade safely with us*

USDCAD: Patient Fed & oil drop support iH&S projection to 1.4370USDCAD is building an interesting medium-term setup as crude oil weakness combines with Fed patience and supports dollar strength against the loonie, with an inverse head-and-shoulders pattern pointing to a measured-move target near 1.4370.
Crude oil recently broke below $60, directly pressuring the Canadian dollar since Canada is a major commodity exporter. Meanwhile, the Fed's cautious stance on rate cuts, despite labour market softness ahead of a potential partial NFP on Friday, keeps the buck bid as investors hold dollars for yield.
The technical structure confirms what the macro backdrop suggests: USDCAD has room to run higher from current levels.
Key drivers
Oil breakdown hurts CAD: crude slipped below $60 recently, and every time oil weakens, the commodity-linked loonie follows. This correlation has been tracking cleanly since July, when USDCAD turned higher alongside the energy sell-off.
Fed patience supports USD: Despite labour-market weakness signals from existing data releases, the Fed isn't rushing to cut in December, and a patient central bank typically supports the dollar because investors can hold dollars and earn decent carry while awaiting clarity on policy.
Inverse H&S pattern: The technical setup shows a head near 1.3537, a neckline breakout near 1.3900, and a clean retest at 1.3985 (former 2022 resistance turned support). The measured move from head to neckline brings 1.4370 into play, with intermediate targets at swing levels.
RSI reset above 50: After showing flat divergence at the recent highs, the RSI has reset by bouncing cleanly off the 50 line on the daily chart, suggesting momentum has room for another leg higher before any overbought concern.
Use 1.3985 as your line in the sand, consider longs above this level with the first target at the peak of 1.4145 (validation of the breakout), the second at 1.4250, and trail stops toward 1.4370 if momentum holds. Watch for oil to remain below $60 and Fed messaging to stay cautious, as a daily close below 1.3985 would shift the bias to consolidation, while full pattern invalidation sits at 1.3720.
This content is not directed to residents of the EU or UK. Any opinions, news, research, analyses, prices or other information contained on this website is provided as general market commentary and does not constitute investment advice. ThinkMarkets will not accept liability for any loss or damage including, without limitation, to any loss of profit which may arise directly or indirectly from use of or reliance on such information.

USOIL Is Bullish! Buy!
Please, check our technical outlook for USOIL.
Time Frame: 9h
Current Trend: Bullish
Sentiment: Oversold (based on 7-period RSI)
Forecast: Bullish
The market is trading around a solid horizontal structure 59.384.
The above observations make me that the market will inevitably achieve 61.007 level.
P.S
The term oversold refers to a condition where an asset has traded lower in price and has the potential for a price bounce.
Overbought refers to market scenarios where the instrument is traded considerably higher than its fair value. Overvaluation is caused by market sentiments when there is positive news.
Like and subscribe and comment my ideas if you enjoy them!

Institutional Order Flow MCl1!Institutional order flow on MCL1! is showing a draw on liquidity with relative equal lows near 55 - 55.5 pricing.
Dropping down to the lower time frame the swing structure holds true and is pointing at lower prices in the near future.
We're looking for entries on the lower time frame and following the fractal trend within the Daily.
Waiting for confirmations, it looks like today will be a bearish day with the nearest target of 59.31
As always, wait for a confirmation entry, and hold small running positions for if we get deeper profits.
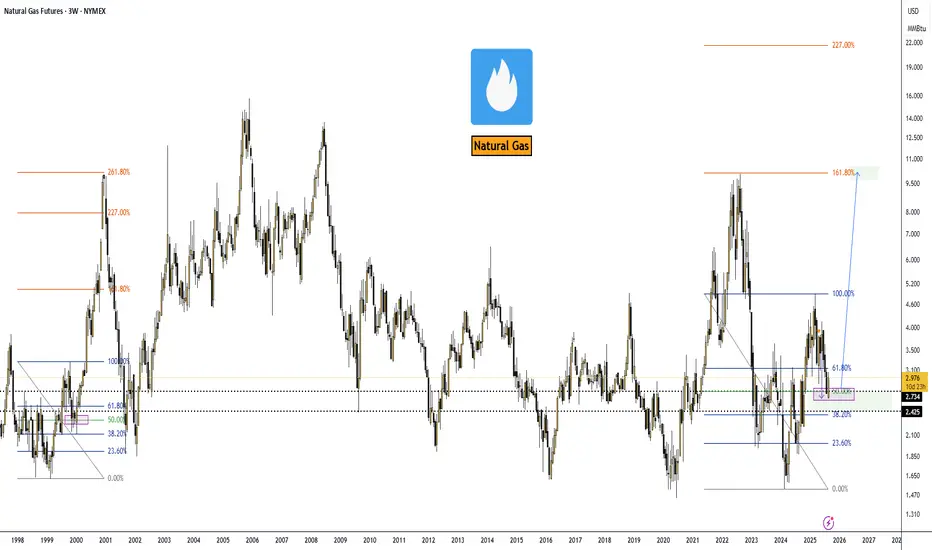
Natural Gas Market Outlook — September 01, 2025.VANTAGE:NG #NaturalGas #NatGas (NYMEX:NG1!) 🔵 Natural Gas Market Outlook — September 01, 2025.
Alright, here’s the skinny on NatGas. Back on April 28, 2025, I was calling for a dip into the $2.74 zone—and guess what? We tagged it right on schedule.
Now the game flips: I’m hunting long entries with the first serious target sitting at $10.00.
Could we overshoot? Absolutely. If momentum really gets cooking, the Fibo 227% extension lines up at roughly $21.00. But let’s not get greedy yet—$10 stays the main milestone for the next big leg.
Macro Drivers
➖ Exports: LNG shipments are the elephant in the room. Europe’s still thirsty, Asia’s paying up, and U.S. cargos are cashing in.
➖ Production: Flat. Shale guys aren’t rushing to flood the market unless we break above $3.20+.
➖ Geopolitics: Russia’s LNG rerouting and Middle East jitters keep a bid under global gas.
➖ Utilities & Consumers: Domestic demand is softer thanks to renewables transitions, but that’s a sideshow compared to export flows.
Big Picture
EIA pegs Henry Hub at $3.60 in 2025 and $4.30 in 2026, but frankly, that’s conservative. With demand from data centers, electrification, and global LNG growth, upside is more likely than not.
Trade View
➡️ I’m treating $2.74 as the cycle low. Any dips near that level look like golden tickets for long positioning into 2026. First pit stop: $10.00. If bulls get rowdy, keep an eye on $21.00 as the stretch target.
➡️ Bottom line: NatGas just gave us the reset we were waiting for. From here, risk/reward favors the long side. Strap in—it’s gonna be a volatile ride, but that’s where the money gets made.
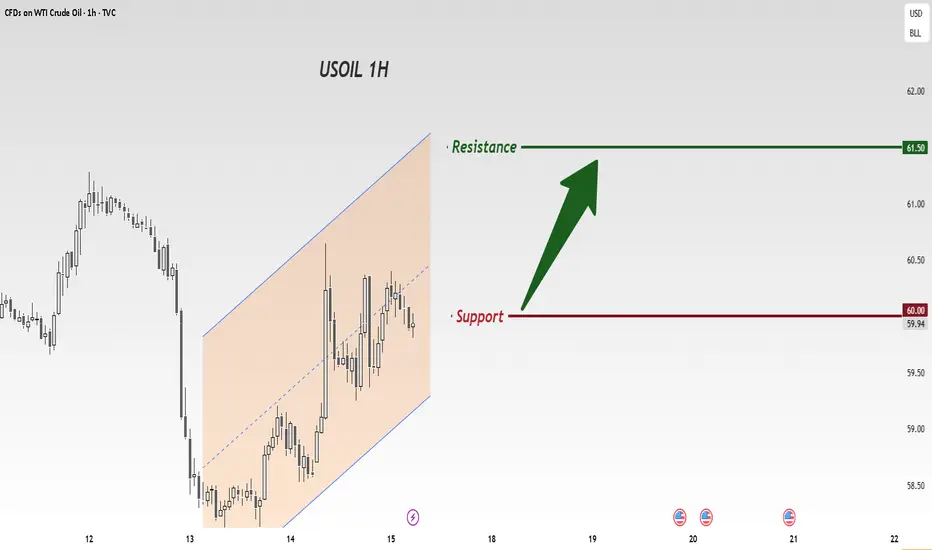
BULLISH SCENARIO - USOILHello traders,
USOIL is currently moving inside a descending channel.
A bullish breakout is in focus:
If the price breaks the channel resistance and confirms the close above,
a strong upward movement is expected 🚀
🎯 TARGET: 65.150

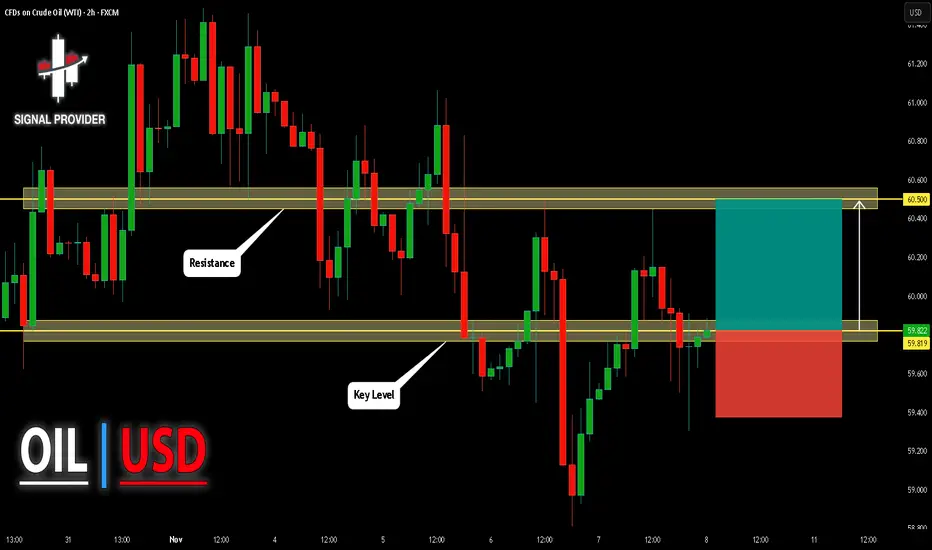
USOIL Will Move Higher! Buy!
Take a look at our analysis for USOIL.
Time Frame: 2h
Current Trend: Bullish
Sentiment: Oversold (based on 7-period RSI)
Forecast: Bullish
The price is testing a key support 59.819.
Current market trend & oversold RSI makes me think that buyers will push the price. I will anticipate a bullish movement at least to 60.500 level.
P.S
Please, note that an oversold/overbought condition can last for a long time, and therefore being oversold/overbought doesn't mean a price rally will come soon, or at all.
Like and subscribe and comment my ideas if you enjoy them!
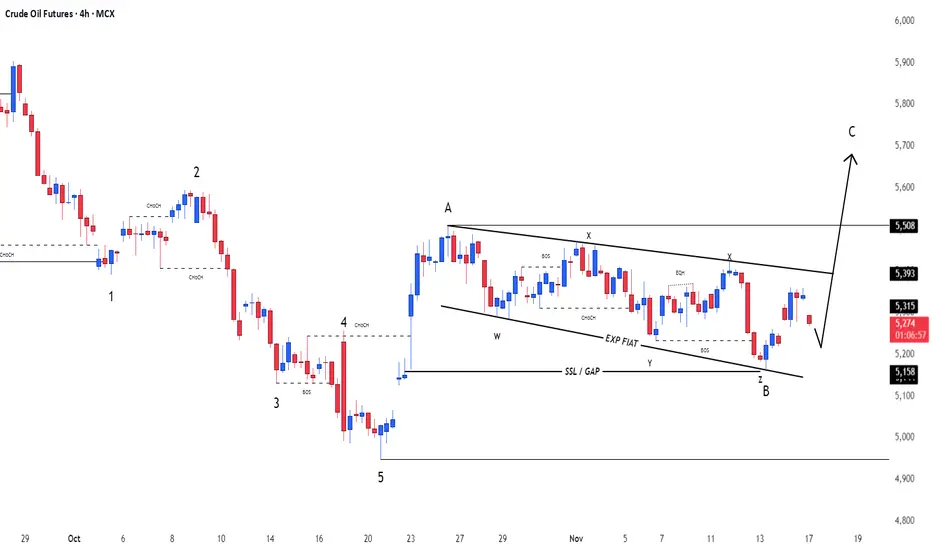
Crude OilU.S Oil Index
- Exp Fiat as an corrective pattern in Short Time Frame
- Break of Structure
- Completed " 12345 " Impulsive Waves and " AB " Corrective Waves
- Sell Side Liquidity
- Order Block
USOIL: Consolidation First, Breakout Next After crude oil plummeted last week to a low near 58.1, it rebounded on Friday and closed around 59.5, basically confirming a consolidating trend.
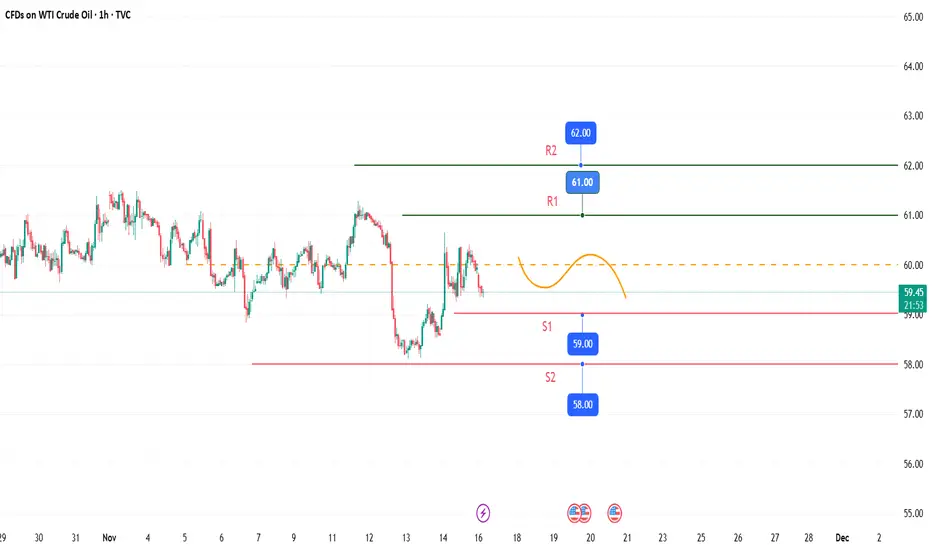
For this week, crude oil is expected to first trade in a low-range consolidation before assessing the potential for a unilateral move. Focus on the 58 level as support below and 62 as resistance above; trade within this range using a "buy low and sell high" strategy.
Go long around the 58.2 level.
Go short around the 61.8 level.
If the price breaks out of this range, then look for a unilateral trend to follow.
Core trading logic:The current crude oil market is in a balanced state of "relatively abundant supply + weak demand + macroeconomic uncertainty + technical fluctuations", with no clear trend direction. Therefore, a mixed strategy of "interval high selling and low buying + breakthrough confirmation for follow-up" is adopted. The focus is on the core range of $58 - $61. Buy at the support level and sell at the resistance level. At the same time, a follow-up position after a trend breakthrough is reserved to balance stability and flexibility.
Crude oil trading strategy
buy:60-60.5
tp:61-61.5
sl:59.5
BRIEFING Week #46 : Make or BreakHere's your weekly update ! Brought to you each weekend with years of track-record history..
Don't forget to hit the like/follow button if you feel like this post deserves it ;)
That's the best way to support me and help pushing this content to other users.
Kindly,
Phil
