ENJ/BTCLooks good to me , waiting for a breakout with volume.
Follow me on my telegram channel : bondscharts
ENJBTC


ENJ/BTC (Enjin Coin) 250% Profit Potential...!!ENJ/BTC (Enjin Token)
Breaking Out In Daily Timeframe..
Need Some Crispy Volume to Boost.
Indicators Are Turning Bullish..
200-250% Profit Potential In Midterm..
Please Like the Idea For Support & Follow Me For More Interesting Ideas.
Thanks


BTC please behave take 2got stopped out of my last buy order when BTC smashed through numerous resistances, but this is why you trade with stops. (losses kept minimal). but enj has now nearly fully retraced since its last leg up, im going to be scaling my buys in throughout this green box.

ENJBTC - Bullish DivergenceENJ is sitting on daily support level, plus, bullish divergence exists on RSI. Short term targets are on the chart.
Not a financial advice. DYOR.

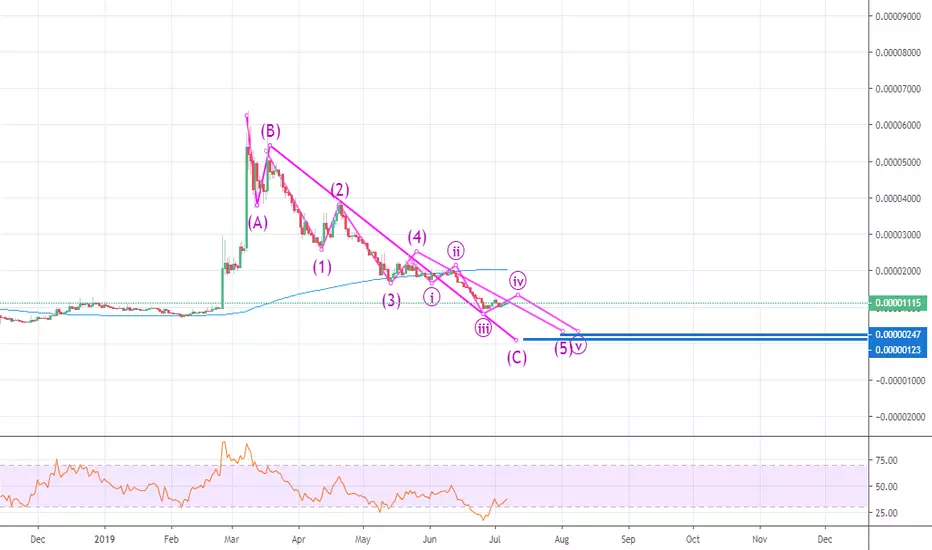
ENJ/BTC correction at it's terminal end!This was a deep correction! But that is normal after an extended fifth wave of an Elliott Wave impulse.
A strong support area is near and bullish divergence shows, that the sellers are getting exhausted.
Price will likely turn to the upside soon.


ENJ / BTC (1D divergence)Perfect divergence on RSI 1D chart.
Moving to the buy zone. Better to wait till we hit 0 fibo.
STOP under : 0.00000920
INSURANCE order at : 0.00001003
TARGET zones are on the chart.

ENJ / BTC (1D divergence)Perfect divergence on RSI 1D chart.
Moving to the buy zone. Safer to wait till we hit 0 fibo
STOP under : 0.00000950
INSURANCE order at : 0.00001001
TARGET zones are on the chart.
P.S. I always keep insurance orders on the lower liquidity levels as a part of my strategy.

(ENJBTC) looks so ripe! Massive falling wedge breakout? ENJ chart looking so ripe! Let's get into the chart straight away!
Pattern: We can observe that a MASSIVE bullish falling wedge is forming and ENJ has been retracing for the past 3 months (in crypto world, it feels like forever) and has finally finished its retracement at the 23.6%.
Indicators:
MACD: Bullish and great momentum building up
RSI: Still have so much room upwards
How to confirm the breakout?: Candle closes above the resistance trend line (~2000 sats) (refer Blue arrow). The breakout should occur WITH volume.
Trading plan: Accumulate ENJ within the buy zone and wait for the breakout (if price closes above ~2000 sats).
Buy range: 1850-1950
Target: 2066-2154-2281-2442-2730-2907
Stoploss (10% from entry): 1665-1755

ENJ BTC - Ready for the inversion of the trend?ENJ BTC - Ready for the inversion of the trend?
ADX - Going in +20 and +D1 near to cross the line.
MACD - near to crossed
STOCH RSI - over 80.00.
Last red candle don't breaking the lower bollinger band.
Maybe that the inversion in this 45minutes frame.

ENJ Potential long trade setupSBS indicator signaled BUY
BUY - at the breakout of the tend line (White)
Targets are on the chart
Target 1 is for scalping
SL -5% of Buy-in or below last support


ENJBTC WEEKLY CHART PATTERN ENJBTC weekly chart pattern forming Butterfly harmonic pattern.
Target listed for Leg C with 170% profit. Please note that pattern may take a while to reach targets based on BTC coin price actions.

Enjin Mid-term Signal by Rocket-ProENJ has been evolving in a downtrend materialized by a descending channel since March 9. The wedge broke out on June 2 and ENJ is now in an accumulation phase.
Buy : current price
T1 : 2150
T2 : 2803 ( 23.6% Fib )
T3 : 3492 ( 38.2% Fib )
Stop : < 1650
You may sell 33% of your position at each target and move your stop loss to breakeven once T1 is reached

$ENJ Accumulation happening over support at ~1850 sats...$ENJ Accumulation happening over support at ~1850 sats, volume is really low which lead me to think the sell pressure is over
UCTS Buy signal flashing on the 1D chart
Both MACD & RSI showing bullish divergences, signalling potential reversal from here
stay alert.
#ENJ

ENJ/BTC Possible IH&SENJ been ranging this low for almost a month, and now it wants out via inverted head and shoulders
I'll be watching it.

