SPX bear market rally topping out, likely headed to 2800-3000The bear market rally in equities has been strong but is showing signs of exhaustion and topping out now. Likely headed much lower to a cycle bottom target of 2800-3000.
Equity

Stocks Facing ResistanceStocks have steadily drifted down from highs at 4327. Retail sales data on Wednesday confirmed the impact that high inflation is having on the economy, and investors are fearing another 75bps rate hike in September. We are seeing a lot of resistance at current levels confirmed by red triangles on the KRI. However, we are also seeing support at 4245, at least for now. If we fall further, then 4188 should be considered a floor for now. We must break out past 4327 to solidify higher levels, which likely won't happen until next week at the earliest.

Retail Sales Dampen StocksStocks have slipped a bit from their week-long rally. Retail sales data confirmed the impact inflation is having on consumers, justifying the current Fed interest rate trajectory. The probability of another 75bps rate hike is above 50%. A retracement from highs was due, as higher highs were increasingly more labored. We gave up the 4300's, after making it as high as 4327. We then retraced the mid 4200's, currently just above our support level at 4245. If we retrace further, 4188 should surely provide support. The Kovach OBV appears to have topped off. Watch the open to see if more momentum comes through today.

How Will Retail Sales Effect Stocks Today?Stocks have pushed higher, spiking up to our level at 4327. However, we have retraced back to the high 4200 handle. The rally appears to be growing weaker. We have some risk off news including Tencent, the Chinese tech firm reporting negative revenue for the first time in history. We also have retail sales at 8:30AM EST, which another data point the Fed will be looking at. A softer reading will weaken the Fed's case to aggressively hike rates, though the headline is only expected at 0.1% . If we do retrace, then 4272 is a reasonable level to expect support, with 4188 a likely floor. If we break out, then 4350 is the next target.

Can Stocks Break 4300?Stocks keep edging higher, breaking new relative highs albeit gradually. We broked from 4272 to 4293. The difference between daily highs is decreasing, suggesting a retracmenet could be near. If so, 4214, or 4188 are good candidates for support. If we are able to rally again today, then 4306 is the next target. This would also be the first technical level in the 4300 handle. The market rally seems to be hinging on expectations of a more dovish Fed outlook, especially after the 50bps rate hike expected in September. Housing and retail sales data will help provide a clearer picture this week.

Stocks Open Near HighsStocks opened near highs as investors digest last week's data. We have retail sales and housing data this week, which may contribute to a clearer picture of the Fed's plan for their September meeting. Currently, the estimate seems to be a 50bps rate hike, followed by a potential softening in policy stance. The S&P 500 hit our target of 4272, and seems to be tapering slightly. The Kovach OBV is strong, but has started to level off. If we see resistance here, watch for support in the lower 4200's or 4188. If we are able to break out again, then 4306 is the next target.

Softer Fed Outlook Fuels Stock RallyStocks have rallied, breaking through to higher levels. The markets seem to interpret recent economic data in a manner that suggests that the Fed is going to cool down their hawkish stance. Right now, a 50bps rate hike is expected for September (potentially the last one), whereas 75bps was not off the table before Wednesday's CPI. This was further supported by Producer Prices. Markets are considering this a green light to rally again. We have broken past 4245, but have fallen just short of our target of 4272. Resistance is confirmed by red triangles on the KRI. The Kovach OBV has picked up with the rally, but it does appear that momentum is stalling. We are due for a bit of a retracement, with 4188 a reasonable area to expect support. If the rally can continue then 4272 is the next target with 4293 and 4306 in line after that.

Forecast is for rain (market top)Chart shows SPY (2D) and the percentage of stocks above their 20DMA(aqua) and 200DMA (yellow).
Each series is the mean percentage of 7 index's which, in turn, aggregate several thousand underlying stocks. The 7 indexes: S&P, Dow, Nasdaq, Russell, TSX, NYSE, AMEX
The peaks of the index coincide with market tops (as shown in the chart). Based on this pattern it's reasonable to forecast a top. Like the weather forecast, the timing is uncertain, the underlying averages lag, and their are plenty of false positives**.
Current forecast is for rain.
** Why do we listen to a weather forecast that we know is somewhat inaccurate? Because it's useful in answering questions like: "should i take an umbrella with me today?" **
All models (and indicators) are meant as useful approximations of reality.

How Yesterday's CPI will Impact Stocks and the FedStocks got a pump from CPI data yesterday. The figure came in at 8.5%, one of the highest in history, however the estimate was 8.7%, so it technically fell short of expectations, even though this figure is still well higher than normal. After this reading, the implied probability of a Fed hike of 75bps fell 30%, which gave the markets a green light to rally. Stocks broke above highs at 4188, and are holding in the 4200's, currently testing our level at 4228. The Kovach OBV has leveled off but is still strong. If we retrace, we should have support at our former high of 4188, but if we retrace the range, then 4122 will provide further support. If the rally can continue, then 4172 is the next target.

Reliance Industery Double Top confirmatiomHI Reliance seems to be moderate bearish.ON hr Chart Reliance is making double top formation but if you do multiple time frame analysis you will find price has taken support above 50 ema therefore you can take trade for moderate bearish view for intraday. and can take entry for long for short term vie.

Nasdaq 5x Overvalued, Irrational?The Nasdaq is worth about 10x of what it was in 1990, in real terms, if you take away all the money printing. The support structure from the 1990s that decayed in 2008 has now been resistance for a *decade*, and now that we're at a historical zone of sky high valuations and overboughtness, it wouldn't surprise me if it dropped 75% from here. What if there is more money printing, you say? Wouldn't that just make everyone rich? Well, the dollar loses about 5% of its spending power per year historically, so if you had simply held since 2000, you'd have lost roughly about 80-90% of that spending power. It's important to not repeat the same fallacy as people did in the 80s and 90s. It blew up in people's faces even back when the economy was supported by stronger fundamentals and there was a greater widespread success of passive wealth accumulation.
Traders are delusional, and perhaps maybe not temporarily on a short-term or medium-term timeframe where prices are highly random, but especially on a long-term one. The Federal Reserve has been trying to float this long-term sentiment for a while now, in the face of terrible fundamentals, and now they don't really have any ammo left. Just look how the price tries to trace the white trendline but continues to lag and has remained below. This tells you all you need to know without even getting into monetary policy.
But even if you look at monetary policy, look at the ammo they are using: they are jawboning claims that the job market is strong because job openings are high, which is a trailing indicator. So chances are in 3 or 6 months, job openings will contract and they will no longer have any poor excuses to linger in their knob turning, hand waving, and making 180 degree pivots in their decision making process. Not to mention, job openings are contracting at a pace only seen since, you guessed it, 2020! Even if they stop jawboning, what padding do they have? 1.5T of reverse repo? That pales in comparison to the 9T that was printed to prop up prices in 2020.
Also, just look at some of the companies on the list:
JD.com (Chinese company)
Baidu (Chinese company)
Starbucks
Blizzard
Do you really think that this hodgepodge of companies are fundamentally strong? Why would anyone put their future in the hands of an index with distorted, contrasting interests and motivations, and foreign ownership? Is that not literally the definition of irrational?
irrational; adjective
(1) Not endowed with reason.
(2) Affected by loss of usual or normal mental clarity; incoherent, as from shock.
(3) Marked by a lack of accord with reason or sound judgment.
If that doesn't describe the situation perfectly, I don't know what does.
Eventually, this thing goes down. With or without money printing.
I hope you enjoyed this idea. Let me know what you think, thanks for taking a look, and don't forget to hedge your bets!

Stocks Range Ahead of CPIStocks have established highs, then immediately rejected them, and are continuing the sideways correction. We mentioned that 4178 and 4188 will be very hard to break, as they correspond to relative highs from a previous range held in June. We are seeing support from 4122, but we are on the precipice of a vacuum zone below to 4068. There is another vacuum zone below that to 4009. The Kovach OBV has leveled off so if nothing signficant happens, then we should maintain the current range. All eyes are on CPI today, which will provide a reading on the massive inflation we have been seeing as of late. This will give us more insight as to the Fed's plan to raise rates, potentially by 50bps at the September FOMC. Don't expect much action in stocks until at least 8:30AM EST, when the data is released.

SPX Momentum Fading?Semi-monthly returns are the highest since March 31. Upward momentum has been strong, but it's looking like it could fade and the price could possibly retest 4000 where either support or resistance will be established. Sentiment is so mixed at the moment that I am fairly certain this will play out. Just look around at the severe contrast in sentiment. People are betting their portfolio on this hinge and it's not clear who is correct, or if anyone is correct. Lately, one could trade either direction and they would have a chance to take profit within the next few weeks or month. The question is, will bearish sentiment linger on or will we get a huge fakeout to the upside? It's a hard question to answer, but if we monitor DXY and commodities we will be able to see some hints in the next week or two.
Good luck and don't forget to hedge your bets!

Stocks Test Highs, Can They Break Higher?Stocks got a nice lift yesterday, but faced resistance exactly where we anticipated, at 4188. We faced strong resistance there confirmed by multiple red triangles on the KRI. These levels also coincide with highs from earlier in June, so it will take formidable momentum to break through. We are seeing strong support from 4144, and will have further support from 4122, if we retrace further. Watch the vacuum zone below to 4068, then to 4009.

Bull Wedge In Stocks?Stocks are tending toward the upper bound of the value area, forming what appears to be a bull wedge. We have been flirting with higher levels in the 4000's established from a value area formed back in June. We seem to have a hard upper bound at 4178, but the Kovach OBV is still strong, suggesting that we have a bull divergence. If we break out, then 4188 will provide resistance. If we can break through that, then 4214 is the next target. We should have support from 4122, then there is a vacuum zone to 4068. If that does not hold, we should have strong support at 4009.

SPY in a downtrend? Where's Top? THE ANSWERS!Chart: SPY 2 week TF. The answers are both in the chart and below. SPOILER: If SPY rallies to $800, the downtrend is still valid.
Interesting:
A downtrend is defined as LOWER lows (LL) and LOWER highs (LH). Uptrend? as HL's and HH's. **
A single HIGHER high (HH) invalidates a downtrend trend in that TF.
Trend is relative to TF and can be valid in one TF but invalid in another.
A HH is established when the previous HH is superseded by a new candle's _____________ (fill in the blank).
Answer: It's the new candles **close** that takes out a previous high, **not** its own high. Once that condition has been met the new High is promoted to the status of HH.
Important:
SPY's 1 week down trend was invalidated when the HH of $393.16 established on the 28th of June, 2022 was taken out by the close of $395.09 on Friday, July 18th, 2022.
Chart: 2 week downtrend is still valid and the current 2W candle closes in 5 days. (8/12/22)
The trend remains valid if that close is below the previous HH of $417.44 established on June 2nd 2022.
Very important:
*** The high of (this) week is not relevant to the 2W downtrend. Only the candle Close on Friday (8/12/22).
Implication (not opinion):
If SPY rallies to $420, the downtrend is still valid.
If SPY rallies to $500, the downtrend is still valid.
If SPY rallies to $600, the downtrend is still valid.
If SPY rallies to $800, the downtrend is still valid.
... *as long as* price falls back to $417.44 by EOW.
The point: ... idk. Ask me in 2 weeks.
Where is "top"?:
It's the price where the last bear goes long (aka covers). In other words when there is not a single buyer left.
** Starting with Homma Munehisa, (1755) The Fountain of Gold—The Three Monkey Record of Money.
to the more contemporary: Al Brooks, (2009) "Trading Price Action Trends"
.. and everyone in between.

Very interesting Chart : VSSLVSSL Looking Good For Swing Target 280-300++. Take your position at cmp.

The S&P 500 Edges HigherThe S&P 500 has broken higher, barely edging past 4144, our previous high. We are curently just below the next level at 4178. We are starting to run into resistance here from previous highs in mid June, confirmed by red triangles on the KRI. If we can break out further, we must get past 4188 before we can consider the next level at 4214. The breakout looks labored and the KRI is relatively flat, so there is a high probability of a retracement, unless we see strong momentum at open. If so, watch for 4068 to provide support, but beware of the vacuum zone below to 4009.


Sideways Correction in StocksThe S&P 500 has retraced slightly from highs at 4144, testing support at 4068, as we anticipated yesterday. We are seeing good support from 4068. We appear to be forming a sideways corrective pattern, a technical corrective phase after a rally from the 3K's brought us back to highs not seen since June. It is likely we will hold this range until stocks can muster another breakout. If that is the case then we must break through 4144 before we can attempt highs from June's range at 4188. If we retrace further, watch the vacuum zone to 4009.

VXX (VIX ETN) hints yet again of increasing volatilityRushing this out before market opens...
The VIX index is rather special (to me) and it is not feasible to use usual technical analysis on that chart IMHO. So, I use the VXX (VIX ETN) for a better idea when volatility spikes might occur. Am observing one just now with an apparent alignment of weekly adn daily factors in the charts.
On the weekly chart, noted that there was previously a bullish divergence where the VXX kept going lower whilst the MACD (left lowest bottom panel) crept up. Noted that when we had the MACD crossover, the following week(s) come with volatility spikes. There is an early indication that we might see a MACD crossover this or next week, suggesting that August would be volatile. The candlestick formed last week gapped up, attempted to close the gap, but closed at the high. This is a rather bullish candlestick, and an identified wedge breakout just might happen this week.
The daily chart uncannily bears (pun not intended) a similar pattern, but with more details, as the last day of last week closed in a similar looking candlestick, along with a gap up (that attempted to close and reopened), as well as a MACD crossover. These MACD crossovers in 2022 have been marked, last posted about this on 12 Feb 2022, which saw a period of higher volatility. Then formed the identified wedge, and bouncing off the wdge support twice, this time, it suggests that volatility is about to spike, and would probably breakout of the wedge.
Taken together, this uncanny alignment forewarns of clear and present volatility for the weeks to follow...
Having said that, I suspect that this is might be a short and sharp spike that could end the bearish status for a couple of months until we get into 2023. That's another discussion altogether.
Meanwhile, hold on to your pants, be ready for the volatility storms!

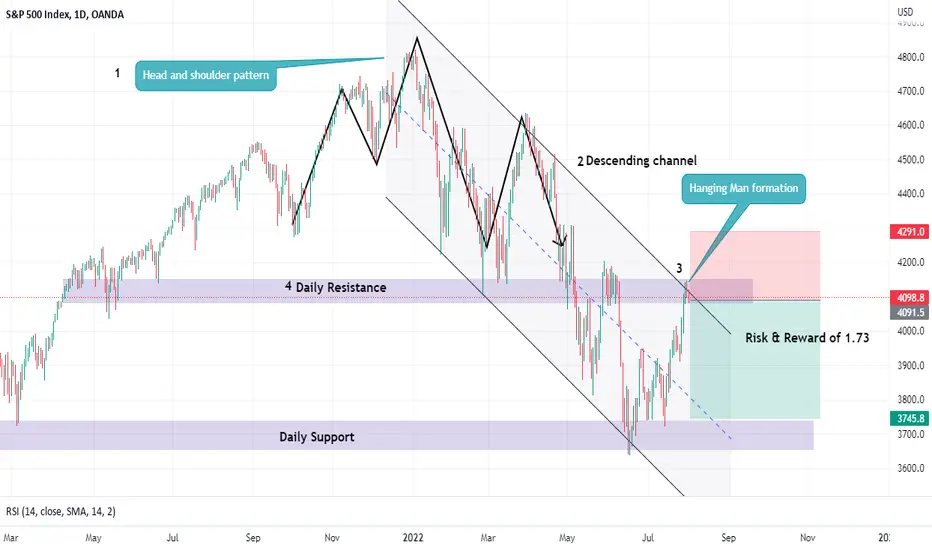
On Daily Time frame S&P remains bearishS&P is in descending channel and will hit the lower lows is pattern is followed
Stocks Retrace After Hitting Our TargetStocks have hit our target of 4144, but ran into resistance here. The price action swiftly rounded off, forming a top at this level. We have since retraced back into the vacuum zone between 4122 and 4168. We should have further support at 4068, but if we retrace further then there is a vacuum zone below to 4009. The Kovach OBV has ticked downward with the retracement. We will need more momentum to punch through 4122 and 4144 before we can consider higher levels at 4178 and 4188, which are the next targets.
