S&P 500 - Is the Market Getting Too Comfortable?Is the Market Getting Too Comfortable?
Section 1: Signs of Complacency
Our Volatility Valuation Index (VVI) has dipped to the lower end of its range—an area that
often signals complacency.
Historically, this level tends to align with market tops, so it’s worth paying close attention.
Could this be a warning sign for the S&P 500?
Section 2: About the VVI
The VVI measures extremes in volatility, helping to identify potential market turning points.
It’s trend-agnostic, meaning high volatility can signal both tops and bottoms.
For equities, high readings typically align with bottoms, while low readings often flag tops.
That said, it works best when paired with other indicators like trend and momentum.
Section 3: What’s Next?
Tomorrow, we’ll dive into momentum signals on the S&P 500 to see what’s really happening under the hood. Stay tuned!
S&P 500 E-Mini Futures

Weekly Forex Forecast: SP500, NAS, DOW ... Wait For BUYS!The equity markets closed the month with all time highs. Next week, there should be some
carry over. The week may open bearish in the short term, but I believe longs will be the ticket to ride!
* I will consider longs in SP500 and DOW before buying the NASDAQ, as it is weaker. There, I would take valid sells before I short SP500 or DOW JONES.
Check the comments section below for updates regarding this analysis throughout the week.
Enjoy!
May profits be upon you.
Leave any questions or comments in the comment section.
I appreciate any feedback from my viewers!
Like and/or subscribe if you want more accurate analysis.
Thank you so much!
Disclaimer:
I do not provide personal investment advice and I am not a qualified licensed investment advisor.
All information found here, including any ideas, opinions, views, predictions, forecasts, commentaries, suggestions, expressed or implied herein, are for informational, entertainment or educational purposes only and should not be construed as personal investment advice. While the information provided is believed to be accurate, it may include errors or inaccuracies.
I will not and cannot be held liable for any actions you take as a result of anything you read here.
Conduct your own due diligence, or consult a licensed financial advisor or broker before making any and all investment decisions. Any investments, trades, speculations, or decisions made on the basis of any information found on this channel, expressed or implied herein, are committed at your own risk, financial or otherwise.

ES Possible Rejection of 6100 and Friday afternoon dumpES looking like it could potentially top out at 6100 and turn back to the downside this afternoon

Es Morning Update Dec 5thIn yesterday’s plan, I gave 3 key targets: 6074, 6082, and 6102. We hit 6102.25 as the high of the day. At this stage, there’s nothing to do but hold runners until a dip presents itself.
As of now: 6088 (weak) acts as support. Holding above keeps 6104, 6116-18, and 6130+ in play. If 6088 fails, expect a dip to 6080, with a 6066 backtest next.

Bulls and Bears zone for 12-04-2024It seems that Bulls keep buying and there is no end to this rally.
However, all good things come to an end, it is just matter of time.
Level to watch: 6084 --- 6082
Reports to watch:
US Factory Orders 10:00 AM
US Jerome Powell Speaks 1:40 PM
US Beige Book 2:00 PM

ES Morning UpdateYesterday, I highlighted that ES was flagging for another leg higher. 6074 was hit, followed by 6082, just tagged.
As of now: Lock in profits here and let runners ride. Next up are 6090 and 6102-106. 6067 acts as support. A dip below targets 6052.

S&P500: No corrections possibly for the whole 2025.S&P500 is on excellent bullish levels on the 1D timeframe (RSI = 64.149, MACD = 44.390, ADX = 33.789) as it is extending the strong rise since the U.S. elections. Going back even more, this uptrend has been nothing but sustainable ever since the August 5th bottom that almost hit the 1W MA50. In fact that MA level is intact since October 2023. The index has been following a similar path with the December 2018 - December 2021 Bull Cycle that topped after a +105% rise. You can see that following the COVID correction recovery after leg (6), the index crossed over the 1W MA50 and never broke it up until after the January 2022 High in 574 days.
Consequently, we expect a continuation of the current uptrend for as long as the 1W MA50 stays intact. We are targeting a +105% rise yet again (TP = 7,150) near the end of 2025.
See how our prior idea has worked out:
## If you like our free content follow our profile to get more daily ideas. ##
## Comments and likes are greatly appreciated. ##

ES Morning Update Dec 3rdYesterday, 6063 remained the focus as ES has been glued to this level for two days, taking it very literally while flagging again. Nothing to do but let runners work.
As of now: 6078, 6092, and 6100 are the next targets. Supports on a dip are 6045 and 6035. Bulls remain in control as long as we stay above 6035.

S&P500 INDEX (US500): To the New High
S&P500 Index updated the all-time high and violated a significant
daily horizontal resistance based on that.
It opens a potential for a further bullish continuation.
The next goal for buyers will be 6100 level.
❤️Please, support my work with like, thank you!❤️

Elliott Wave View S&P 500 (SPX) Wave 5 in ProgressShort Term Elliott Wave view on SP500 (SPX) suggests rally from 8.5.2024 low is in progress as a 5 waves impulse. Up from 8.5.2024 low, wave 1 ended at 5627.56 high and pullback in wave 2 ended at 5402.62 low. The Index then extends higher in wave 3 ending at 5878.46 high. The next pullback built a zigzag Elliott Wave structure to finish wave 4 at 5696.51 low like the 1 hour chart below shows. Actually, the SPX is trading higher in wave 5 developing an impulse or ending diagonal structure.
Wave 5 rally is in progress with internal subdivision as another impulse. Up from wave 4, wave ((i)) ended at 6017.31 high and wave ((ii)) retracement ended at 5853.01 low. Wave ((iii)) has started and it is trading in wave v of (iii) of ((iii)). Up from wave ((ii)), wave (i) ended at 5908.12 and wave (ii) correction ended at 5855.29. Then the SPX built a nest ending wave i at 5923.51 and wave ii at 5860.56. Wave iii of (iii) finished at 6025.42 and wave iv pullback at 5984.87 low. From here, we are expecting that wave v of (iii) completes soon and the index should see a pullback in 3 swings as wave (iv) before resuming higher in wave (v) of ((iii)). Near term, as far as pivot at 5850.8 low stays intact, expect pullback to find support in 3, 7, or 11 swing for more upside

ES Morning UpdateOn Friday at 9am, I highlighted that ES had set up for a “huge trend leg” with targets at 6038, 6045, and 6063. We reached 6060. Now, the market is building structure again.
As of now: 6055-6032 is all a consolidation zone, with 6045 as the mid-pivot. Buyers need to defend 6032-35 on any dips to keep 6063, 6072, and 6088+ in play. If 6032 breaks, expect a dip to 6024, then 6014.

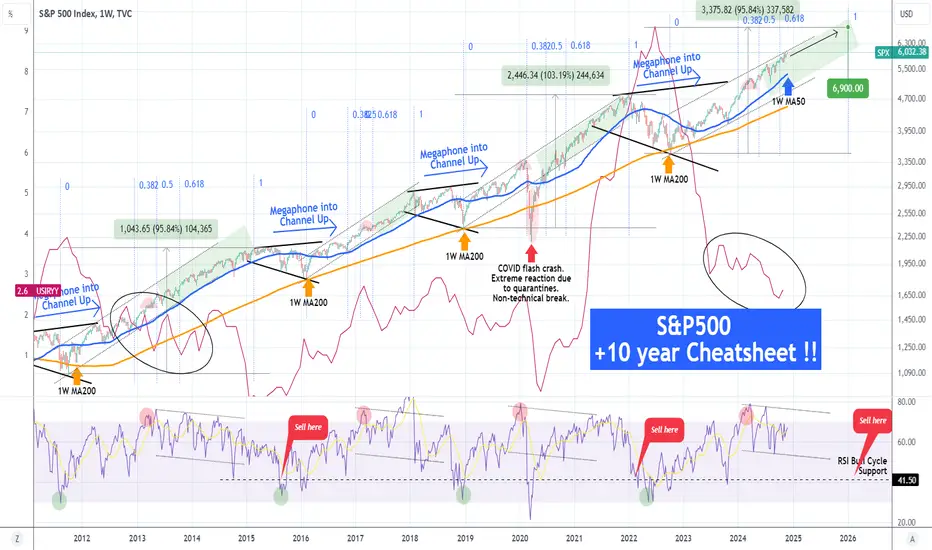
S&P500 This Inflation Cheatsheet shows no correction in 2025.This is a chart we first posted almost 4 months ago (August 14, see chart below) at the time of a CPI date release, where we viewed the S&P500 index (SPX) against Inflation (red trend-line) and calling for an immediate buy:
** The 1W MA50 as the ultimate Support **
Well the price jumped +11% since then from 5440 to over 6000. The first principle of this chart is that as long as the 1W MA50 (blue trend-line) is supporting, investors should stay bullish. This is because all previous multi-year rallies since August 2011 that started within a Channel Up, ended upon a 1W candle close below the 1W MA50 and transitioned into a Megaphone pattern for the new Bear Phase.
** Declining Inflation fueling stocks **
Right now we are still on a declining Inflation trend, very similar to early 2014 (ellipse shape on Inflation), while the 1W RSI of SPX is declining inside a Channel Down. This is a Bearish Divergence, which during all previous SPX Channel Up patterns, didn't make the index top until the RSI broke below its 41.50 Support (notable exception of course the March 2020 COVID flash crash which was a one in 100 years Black Swan event).
** SPX Target and timing **
As a result, while the 1W RSI trades within its Channel Down and above 41.50 and all price candles close above the 1W MA50, we expect the index to extend the multi-year uptrend to 6900, which would represent a +95.84% rise from the October 2022 bottom, similar to the February 2015 High. Notice that the December 2021 top was also of a similar magnitude (+103%).
As far as timing is concerned, we have calculated a model based on the 1W RSI top and the start of its Channel Down. As you see at that point, SPX always makes a medium-term pull-back (red Arc). This tends to be within the 0.382 - 0.618 time Fibonacci levels and on the 2011 - 2014 Bull Cycle, that was within the 0.382 - 0.5 Fib zone. As a result, applying this principle on the current Bull Cycle, the trend is now just 2 months past the 0.618 time Fib and we can expect a Cycle Top around December 2025.
-------------------------------------------------------------------------------
** Please LIKE 👍, FOLLOW ✅, SHARE 🙌 and COMMENT ✍ if you enjoy this idea! Also share your ideas and charts in the comments section below! This is best way to keep it relevant, support us, keep the content here free and allow the idea to reach as many people as possible. **
-------------------------------------------------------------------------------
💸💸💸💸💸💸
👇 👇 👇 👇 👇 👇
Possible SHORT TradeI anticipate that the price will test the resistance zone between $6,012.50 and $6,028. If the price fails to break through this level, it is likely to reverse and decline towards the support level at $6,000.

ES Morning update Nov27thThe steady climb persists in ES. As posted yesterday breakout above 6002 would push us higher with 6027, 6036, and 6046 as targets. We hit 6046 exactly.
As of now: 6026=support (already tested once). Holds keep 6038, 6044 in play. Breakout potential to 6073 above. If 6026 fails, watch for dips to 6017, then 6002.

S&P potential long when new york market opensas the bullish daily bias show us, we can see some liq to the downside that could be taken . after that we could react at the 70-80 % fib level , which is as well at the 1h Order Block . that would give us nice confirmation and we could take a trade if we get a good setup to that, the main thing is that we are bullish and that we want to get higher. but unfortunately everything can happen and we are not forcing trades. Risk 1-3 %

Do bulls really want to be long the S&P 500 ahead of a breakout?S&P 500 future are tantalisingly close to a record high. So close in fact, it would be rude not to print one. Yet I am skeptical it will simply hold on to (and extend) any such gains without at least a shakeout first, and bulls may be better to wait for a dip. Comparing the S&P 500 to Dow Jones and Nasdaq 100 futures, I explain why.
MS.

S&P500 Don't expect the rally to stop now.Our last S&P500 (SPX) analysis (November 18, see chart below) gave us the ideal buy entry on the 0.5 Fibonacci retracement level, with the price immediately responding with a rebound:
The rebound took place on the 4H MA200 (orange trend-line) and we are now even past the 4H MA50 (blue trend-line). Despite the strong uptrend, this rally is far from over technically, as not only is the 4H RSI below the (70.00) overbought barrier where it has given the first bearish signs near the two previous Higher Highs, but also significantly lower than the top (Higher Highs trend-line) of the September 06 Channel Up.
As a result we expect a continuation of the current Bullish Leg. The previous one peaked on the 1.786 Fibonacci extension, so our Target is now just below it at 6150.
-------------------------------------------------------------------------------
** Please LIKE 👍, FOLLOW ✅, SHARE 🙌 and COMMENT ✍ if you enjoy this idea! Also share your ideas and charts in the comments section below! This is best way to keep it relevant, support us, keep the content here free and allow the idea to reach as many people as possible. **
-------------------------------------------------------------------------------
💸💸💸💸💸💸
👇 👇 👇 👇 👇 👇

Es Morning Update Nov 26thThis week has revolved around one key level: 5988, the new money magnet. Yesterday, it held as support, sparking a 30-point rally before we got a flush. However, a failed breakdown reclaimed the level overnight.
As of now: Watch for 6026 next, with 6038 beyond. Supports are 6009 (weak) and 5988-93.

SPX to new ATH till next CPIThe correction is over and now SPX is looking at new ATH till Dec 11. Invalidated if breaks below the green line.

Es/SPX Morning Update Nov25thBuyers let patience pay off. Last week (and the week before) had formed a 2-week bull flag with 5980 resistance. Mentioned that if 6002 clears if could give us momentum to 6017. Buyers gapped up over night and now we are sitting exact at 6017.
As of now: Let runners ride if you have them. 6009 (weak) and 6002 are supports. Holding above keeps 6027-32, 6046+ in play. A failure at 6002 could lead to a gap fill lower.

Weekly Forex Forecast Nov. 25th: SP500, NAS, DOW = BUY THEM!The three indices are bullish. They each had a Daily +FVG they found support in, and were bullish from that point of contact. The DOW is the strongest, and may be the best bet, even though it is a wildcard most times. The SP500 is probably the safest buy, as the NASDAQ is the weakest of the three. If things turn bearish for any reason, the best short will be in the NASDAQ.
Check the comments section below for updates regarding this analysis throughout the week.
Enjoy!
May profits be upon you.
Leave any questions or comments in the comment section.
I appreciate any feedback from my viewers!
Like and/or subscribe if you want more accurate analysis.
Thank you so much!
Disclaimer:
I do not provide personal investment advice and I am not a qualified licensed investment advisor.
All information found here, including any ideas, opinions, views, predictions, forecasts, commentaries, suggestions, expressed or implied herein, are for informational, entertainment or educational purposes only and should not be construed as personal investment advice. While the information provided is believed to be accurate, it may include errors or inaccuracies.
I will not and cannot be held liable for any actions you take as a result of anything you read here.
Conduct your own due diligence, or consult a licensed financial advisor or broker before making any and all investment decisions. Any investments, trades, speculations, or decisions made on the basis of any information found on this channel, expressed or implied herein, are committed at your own risk, financial or otherwise.

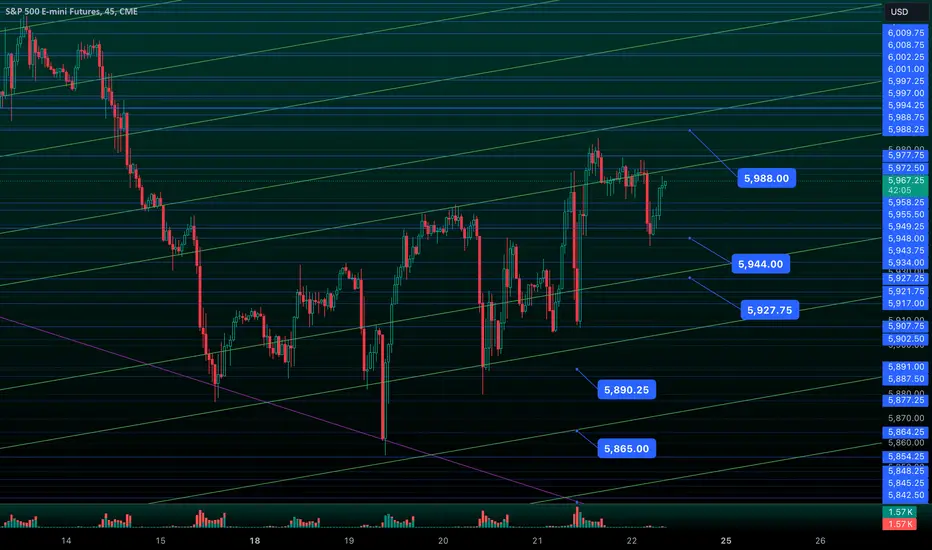
Full Game Plan for Monday Nov 25thPlan for Monday’s Session
Supports:
• Major: 5972, 5945, 5933, 5908, 5899, 5884-5882, 5869, 5855, 5845, 5828, 5818, 5802, 5782, 5760, 5752, 5731, 5709-11, 5691, 5683.
• Minor: 5980, 5967, 5961, 5957, 5948, 5944, 5928, 5922, 5914, 5904, 5893, 5878, 5865, 5850, 5839, 5835, 5812, 5806, 5793, 5777, 5740, 5721, 5702, 5695.
Resistances:
• Major: 5988, 6002, 6017, 6027, 6032, 6050, 6070, 6082, 6093, 6111-13, 6132, 6138, 6172, 6189.
• Minor: 5993, 5998, 6009, 6023, 6038, 6046, 6056, 6062, 6075, 6101, 6117, 6146, 6156, 6165, 6178.
**Context and Strategy:**
ES is coming off a strong Friday close at 5988, right at a key resistance zone. Price action remains in a clear uptrend, but with no major pullbacks or basing structure formed, actionable setups for Monday will require patience. Those who have been here should know what I'm going to say. My absolute least favorite time to trade is days after trend leg. My job is to get in before these big moves. After they play out, my job is done, and I just need to sit and wait for the next setup to appear. This requires one of two things 1) A sharp pullback or 2) Structure (basing to form). If we just keep trending up, there is nothing for me other than holding my runners and letting them do the work. Patients will be verified on Monday.
**Key Levels for Monday:**
1. First Support at 5972: A dip and recovery here could provide a solid base for continuation higher.
2. Major Support at 5945: If 5972 fails, 5945 becomes the next key level. This area has been well-tested and could provide a reaction or bounce, but the cleanest trade would come from a failed breakdown here.
3. Resistance at 6002: A breakout above this level opens the door for higher targets, including 6017 and 6027.
**Bull Case for Monday:**
• Hold Above 5972: Bulls maintain control as long as price holds 5972. A flag or consolidation at this level would create a strong base for a push higher.
• Breakout Through 6002: Reclaiming 6002 and holding above it could fuel momentum toward 6017 and 6027.
• Structure Above 5988: Building a base above 5988 and below 6002 creates a launchpad for further upside.
**Bear Case for Monday:**
• Breakdown Below 5972: A failure at 5972 would likely lead to a test of 5945. I’d need to see a good bounce attempt here and/or failed breakdown (something like test 5967 then recover 72). After this, I’d short below wherever the lows are (probably something like 5964).
• Failed Breakdown at 5945: As always, breakdown trades carry higher risk. Same drill at a 5972 short...A dip below 5945 that recovers quickly could signal a trap for shorts. Wait for confirmation (e.g., a bounce that pays out buyers and then a loss of the lows) before entering.
• Exhaustion at Resistance: Bears can also look for sell reactions at key resistances (6002, 6017) to test lower supports. I never short resistances. Win rate is too low for my liking
**Summary for Monday:**
• Bullish Lean: As long as 5972 holds, the short-term trend remains intact. Watch for opportunities to break out above 6002, targeting 6017 and 6027.
• Bearish Lean: Bears need to break below 5972 or 5945 to regain control and push the market lower toward 5933 and 5908. Failed breakdown setups, however, remain the safer option for entering long positions.
Reminder:
Patience is critical. It’s safer to wait for failed breakdown setups than longing after direct tests, especially at key supports, and confirm with volume before entering long positions if you want to be super precise. Avoid chasing momentum and let the market come to you.

Es Morning UpdateYesterday (as mentioned in the plan sent out Wednesday’s), I was anticipating a rally to 5993, the flag resistance from the November high in #ES_F. After an 80-point move, buyers got to 5986 and sold off.
As of now: 5961 and 5954 are key supports. Holding above keeps 5972 and 5980 in play. Consolidation here could set up 5998+. If 5954 fails, expect a dip to 5942, then 5917. Protect capital.