ethereum towards + $10kETH towards + $10K
Ethereum’s Journey to + $10k Successfully Completes Major Milestone with PECTRA Update
ETH-D

USDT.D LONG - MID TERM PLANUSDT.D is one of the best tools to understand what's happening in the crypto market.
It shows the dominance of USDT across the entire space — and has a strong inverse correlation with BTC and crypto assets.
Technicals:
USDT.D is approaching its long-term support trendline.
I expect a deviation below that line — possibly toward the 0.75 Fibonacci level — before a strong move up.
That move could last 1–3 months, which means more downside for alts during this time.
Plan:
Shorting altcoins — especially ETH-related tokens and memecoins.
Looking to buy back around early August.

Ethereum Bear Market Over! $10,000 Before 2026 Confirmed!People were badmouthing Ethereum but look what is happening, more than 20% growth in a single day. Awesome right? But this is only the start, the last high will be reached and conquered easily, that I know for certain for sure it is true just watch.
In a previous analysis I mentioned that ETHUSDT was trading within a tight range support buy-zone, marked blue on this chart. This is also a higher low and consolidation was happening before what happened today. Bullish action confirmed. Real bullish action I should say because this action is coupled with really high volume. Confirming a very strong high in the coming weeks and days.
Here is what will happen, Ethereum will grow daily non-stop for months. Now, saying it (reading it) is one thing, experiencing will be something completely different, the market will become euphoric as everything grows.
Hundreds of billions worth of USD will be injected into the market, we already have 30 billions that came in recently but only some 10-15 billions are already in-play. This means that the whales still have 15 billion USD ready to buy, and they will continue to buy long-term. As this capital dries up, more and more players will get involved. Notice how the sentiment is still low. People know we are bullish but that is only the usual market participants, those that are part of the industry, the rest, the mass, they are not in yet. When the masses wake up, that will be very close to the top of the first bullish wave. 250 B$ coming in will change not only the Cryptocurrency market forever but also the global financial landscape.
Ethereum breaking bullish is just step one, there is more to come. Prepare for Ethereum to trade at around $10,000 before this year ends. Would you like to bet? I don't think so, we already won because we've been bullish since before 7-April, now it is time to enjoy the ride nothing more.
Adapt and change. The market always fluctuates from bullish to bearish, from bearish to sideways, from sideways to bullish and bullish the market will stay long-term.
Thank you for reading.
"Buy like it's the end of the world. —Master Ananda"
You can't go wrong when prices are low.
Thanks a lot for your continued support.
Namaste.

ENA / USDT#ENA / USDT
Iam expecting big returns from ETH and its related coins in this season
This chart is also looking good
Another Potential round bottom pattern under formation
Keep an eye

ETH => Shift In Momentum Almost Done!Hello TradingView Family / Fellow Traders. This is Richard, also known as theSignalyst.
📉 Since breaking below its last major low in December 2024, Ethereum (ETH) has been stuck in a bearish trend.
But don’t lose hope, bulls! 🐂
⚠️It’s evident from the last correction phase, marked in blue, that it's larger than the previous ones — a clear sign that the bulls are stronger than ever.
A growing correction phase is often the first signal of an upcoming momentum shift.
This shift will be confirmed once ETH breaks above the last major high marked in red at $2,100.
📈A break above $2,100 would flip ETH’s trend from bearish to bullish, signaling the potential start of the Altcoin season!
Until then, patience is key. 🧘♂️
📚 Always follow your trading plan regarding entry, risk management, and trade management.
Good luck!
All Strategies Are Good; If Managed Properly!
~Rich

ETH - Is $3,000 next?Today marked a significant milestone for Ethereum as it successfully rolled out its much-anticipated Pectra upgrade. The update, which introduces a number of technical enhancements aimed at improving scalability, security, and developer experience, has already had a noticeable impact on market sentiment. In the hours following the upgrade, Ethereum (ETH) surged more than 13%, breaking through key resistance levels and igniting fresh bullish momentum.
From a technical standpoint, ETH is currently breaking out of a descending wedge pattern, a structure often seen as a bullish reversal signal. The price action has decisively pushed through the wedge’s upper boundary, signaling a potential end to the recent downtrend. Additionally, ETH is now testing a significant resistance zone, often referred to as the "resistance box," which has historically served as a key battleground between bulls and bears.
Should Ethereum manage to secure a clean breakout above this resistance area with strong volume. The next major upside target lies around the $3,000 level, a psychologically and technically important price point. This move could mark the beginning of a larger bullish cycle if market conditions remain favorable and momentum continues to build.
With the broader crypto market showing signs of recovery and Ethereum's fundamentals strengthening post-upgrade, traders and investors alike will be closely watching to see whether ETH can sustain its breakout and confirm this bullish trend.
-------------------------------
Thanks for your support.
- Make sure to follow me so you don't miss out on the next analysis!
- Drop a like and leave a comment!

MOCHI 1000XETH is ready for next upside move, but you can earn only ~15x.
With $MOCHI you can make 1000x with same chart.
1.6 FIB worked well with bitcoin in previous cycle. same may work with ETH

Ethereum Future: Limited Upside Ahead?Ethereum price dropped roughly 25% since April 2 due to an overall market crash following Trump’s tariffs implementation.
Compared to the almost 40% drop back in February after the first tariff announcement, this time the correction wasn’t as harsh or brutal.
So what can we expect next from Ethereum in the coming weeks?
The main hope for ETH price remains the upcoming Pectra upgrade.
Historically, major Ethereum upgrades have acted as bullish catalysts — for example, ETH roughly doubled in price ahead of both the Merge and the Shanghai upgrade.
If history rhymes, we could see a similar pre-upgrade pump this time too.
However, even if that rally materializes, I expect it to be limited to the $3,000–$3,400 range. The market lacks the kind of momentum or macro tailwinds needed to push ETH beyond 4k in this cycle — unless there’s a major shift in sentiment.
Overall, I remain cautious. The broader crypto market seems to be rolling over, and Ethereum hasn't even reclaimed its ATH.
With the next bear cycle approaching, long-term bullish targets might need to be revised — at least for now.
Short-term bounce possible thanks to Pectra hype, but don’t expect miracles. ETH likely capped below 3.4k unless something big changes.

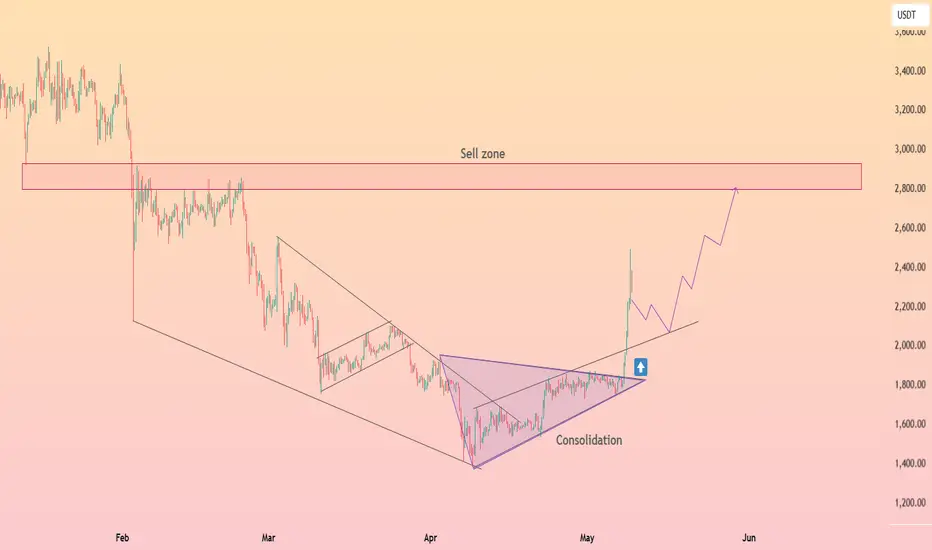
HolderStat┆ETHUSD breakout toward key resistanceAfter weeks of consolidation inside a symmetrical triangle, ETH has confirmed a bullish breakout with strong momentum. Price is now aiming for the $2800–$3000 sell zone, a key level from previous distribution. The breakout suggests increased buying pressure and a potential mid-term rally continuation.
💡 If ETH holds above the $1800 breakout zone, we could see a gradual climb toward $2800 in the coming weeks.
ETH ANALYSIS (12H)This analysis is an update of the analysis you see in the "Related publications" section
Ethereum has finally reached the flip zone.
Pay close attention: Ethereum dominance is sitting on monthly support, which is a level with strong bounce potential.
We have two possible scenarios for Ethereum | either it breaks through the flip zone, or it makes a correction and turns bullish again from around the bottom.
⚠️ What’s clear is that shorting Ethereum is risky and doesn’t make sense!
For risk management, please don't forget stop loss and capital management
When we reach the first target, save some profit and then change the stop to entry
Comment if you have any questions
Thank You

ethusd 1400 EOY then bull run to ATH 4500Huge Triangle pattern of ethereum.
If 1400 till end of year will hold could be as simple as in 2023 the start of bull run in 2026 to new ATH at 4500

A new probability for a bullrun over the weekendSince in the second half of the week there was an opportunity for the ether to take higher levels, I want to consider the events for the coming days in more detail. At the moment, the growth target is the test test of 2100-2150, then either the range will be broken, in which case a stable trend towards the test of 2250 can be expected on Saturday. If it fails to gain a foothold above 2100, then tomorrow a pullback to the opening of today's daily candle and a second test attempt of 2100-2150 on the weekend are likely.
With all the positivity, I would like to remind you that I mentioned purchases only in the first half of the month, in continuation of the April trend. From Sunday to Monday, there is a possibility of a major market drop if ether does not open the second half above 2250 and bitcoin above 100k. It is difficult to say what could serve as a signal, but positive statistics for the United States have already been released, as the first signal, there may be a collapse in oil at the beginning of the week to stimulate sales. It will be possible to judge further dynamics at the end of the week, but starting from Sunday afternoon, I recommend reducing work positions.
To date, following the tops, large-cap coins show a slight increase, and secondly, we can expect the start of a rampage through the rest of the coin market closer to Saturday. For large-cap coins, you should not expect large growth, since the growth period is still quite small, the probability of gaining large investments during such a period is small. In this regard, the growth waves can be up to 15-20%. Small-cap coins are likely to have a stormy weekend with breakouts of up to 70-100%.
I am primarily considering chess and fio for work, and koma adx pivx quick with slightly less potential for the latter. A bullrun is also likely for fantokens with speeds up to 3x, among which I primarily consider atm city acm.

Support and Resistance Zone: 2273.58-2359.35
Hello, traders.
If you "Follow", you can always get new information quickly.
Please click "Boost" as well.
Have a nice day today.
-------------------------------------
(ETHUSDT 1M chart)
In order to turn upward on the 1M chart, the price must rise to the Fibonacci ratio range of 0.382 (2674.80) ~ 0.382 (2723.46) and maintain it.
Before that, the key is whether it can rise above the M-Signal indicator on the 1M chart.
-
(1W chart)
The key is whether the price can be maintained and rise above the M-Signal indicator of the 1W chart.
To do so, we need to check whether the price is maintained by rising near the right Fibonacci ratio 0.5 (2295.84).
In order to continue the uptrend in the medium to long term, the price must be maintained above the M-Signal indicator of the 1M chart.
Accordingly, the key is whether the price can rise above the M-Signal indicator of the 1M chart when the price is maintained by rising near the right Fibonacci ratio 0.5 (2295.84).
Therefore, it is expected that a breakout trade will be possible when the right Fibonacci ratio 0.5 (2295.84) is broken upward.
However, since the StochRSI indicator is showing signs of entering the overbought zone, the increase may be limited.
-
(1D chart)
It showed a big rise as it broke through the A section, that is, the 1861.57 point.
In any case, since it is currently below the M-Signal indicator of the 1M chart, we can see that there is still time to buy.
Therefore, as I mentioned earlier, we should focus on finding a buying point when the price rises above the M-Signal indicator of the 1M chart and maintains the price, or when it rises to the Fibonacci ratio range of 0.382 (2674.80) ~ 0.382 (2723.46) and maintains the price.
ETH is in a typical reverse arrangement (M-Signal of the 1M chart > M-Signal of the 1W chart > M-Signal of the 1D chart).
Therefore, we should focus on finding a buying point while watching the situation with a relaxed mind.
If it continues to rise like this,
1st: 2273.58-2359.35
2nd: 2627.18
3rd: 2921.73
We need to check if it can rise with support near the 1st-3rd above.
If not, if it falls, we need to check if it can support near 1861.57.
-
Thank you for reading to the end.
I hope you have a successful trade.
--------------------------------------------------
- This is an explanation of the big picture.
I used TradingView's INDEX chart to check the entire range of BTC.
I rewrote it to update the previous chart while touching the Fibonacci ratio range of 1.902(101875.70) ~ 2(106275.10).
(Previous BTCUSD 12M chart)
Looking at the big picture, it seems to have been following a pattern since 2015.
In other words, it is a pattern that maintains a 3-year bull market and faces a 1-year bear market.
Accordingly, the bull market is expected to continue until 2025.
-
(Current BTCUSD 12M chart)
Based on the currently written Fibonacci ratio, it is displayed up to 3.618 (178910.15).
It is expected that it will not fall again below the Fibonacci ratio of 0.618 (44234.54).
(BTCUSDT 12M chart)
I think it is around 42283.58 when looking at the BTCUSDT chart.
-
I will explain it again with the BTCUSD chart.
The Fibonacci ratio ranges marked in the light green boxes, 1.902 (101875.70) ~ 2 (106275.10) and 3 (151166.97) ~ 3.14 (157451.83), are expected to be important support and resistance ranges.
In other words, it seems likely to act as a volume profile range.
Therefore, in order to break through this section upward, I think the point to watch is whether it can rise with support near the Fibonacci ratios of 1.618 (89126.41) and 2.618 (134018.28).
Therefore, the maximum rising section in 2025 is expected to be the 3 (151166.97) ~ 3.14 (157451.83) section.
To do that, we need to look at whether it can rise with support near 2.618 (134018.28).
If it falls after the bull market in 2025, we don't know how far it will fall, but considering the previous decline, we expect it to fall by about -60% to -70%.
So, if the decline starts near the Fibonacci ratio 3.14 (157451.83), it seems likely that it will fall to around Fibonacci 0.618 (44234.54).
I will explain more details when the downtrend starts.
------------------------------------------------------

Be careful with ETH !!!now is the time for ETH to rise again to 1900 . STRONG SUPPORT 1530 .
Give me some energy !!
✨We spend hours finding potential opportunities and writing useful ideas, we would be happy if you support us.
Best regards CobraVanguard.💚
_ _ _ _ __ _ _ _ _ _ _ _ _ _ _ _ _ _ _ _ _ _ _ _ _ _ _ _ _ _ _ _
✅Thank you, and for more ideas, hit ❤️Like❤️ and 🌟Follow🌟!
⚠️Things can change...
The markets are always changing and even with all these signals, the market changes tend to be strong and fast!!


Bitcoin Mid Term Game Plan - BTC PLANBitcoin just broke a key resistance level with strength.
I expect a new all-time high soon, likely the summer top.
Summer markets are usually weak for risk assets and strong for gold. Seasonality matters, keep that in mind.
I expect risk markets to sell off until mid-July to early August. I’ll start buying once we break structure again.
The plan:
Wait for BTC to hit $110K
Look for a reversal from that level
Start aggressively shorting alts, beginning with ETH and memecoins
Hold shorts until late July / early August
Close positions and shift back to buying

This Low Cap Alt will 20-50x (CULT DAO)This crypto cycle has been brutal for alts. There have been massive shakeouts over and over, a relentless onslaught of rug pulls and scams, and the "Pump.fun" casino on Solana that’s drained billions of retail liquidity and transferred it to the few.
The few always seem to win, and the many always seem to lose. Today, if you’re reading this, it might all change.
CULT DAO could easily 20-50x from now until October 2025. Let’s take a look at the MACD divergence.
### Technical Divergence
For 750 days, this bullish divergence has been forming on the histogram MACD. Every new low on price has formed a higher low on the MACD.
Let’s take a look at a case study of what happens when we get this form of divergence.
I traded this exact same pattern in 2022 that resulted in a nearly 425% move. The play function doesn’t work because they rebranded, and that ticker is no longer valid, but you can scroll to the bottom in my comments on that TA and see the move. I’ll post it under this as well.
As you can see, we got that 425% move. Currently, CULT DAO is showing exactly the same histogram divergence.
Here are some examples of zigzag impulses on low-cap alts. You tend not to get 5 waves; instead, you get this zigzag pattern. This is what I predict CULT DAO will do since it’s only a 5 million market cap.
We can also see in the chart that the 0.618 time Fibonacci level hits at the end of October 2025, which is exactly where I think the altcoin market will top. Check out previous TA on that.
This is only scratching the surface of what is to come for CULT DAO. I have presented to you the technical reason why a big move is stirring and why, at the apex of these divergences, the stars align, and you have the catalyst present itself, and boom—the explosive move comes all at once, and it will be extremely volatile because of its low market cap.
### Let’s Start with the Tokenomics
Every time someone sells or buys CULT DAO on Uniswap, there is a 0.40% tax that goes to a treasury. The top 50 stakers get to pass proposals that fund projects/investments. The idea is to remove the centralized component of funding a project.
121 projects have been funded over the last three years with 3 million dollars.
- Total CULT Funded: 479,751,081,214 CULT
- Total ETH Funded: 1,573 ETH
- Proposals Funded: 121
- Total USD Funded: $3,289,596
- Total ETH Burned: 303 ETH
Allocating these funds has been a learning process over the last three years, but every failure has been necessary in preparing the DAO for what’s to come next.
### The Big Catalyst
The creator of CULT DAO has been working on a blockchain that will function on a custom gas token—that’s right, and that custom token will be CULT DAO. You heard correctly.
Every transaction, every deployment on the blockchain will require the CULT DAO token as gas to execute. The implications are massive. There are multiple dApps that are currently being constructed on the Modulus blockchain.
A privacy-first zkEVM blockchain like Modulus means a scalable, Ethereum-compatible blockchain that prioritizes user privacy through zero-knowledge proofs, allowing optional private transactions while maintaining decentralization.
Modulus is a privacy-first zkEVM blockchain and is scheduled to release this year between April and August 2025. I hope now you’re starting to see the picture.
### CULT DAO and ETH Liquidity Pools
So, why does the price of CULT go down if there is currently very little volume? Well, CULT DAO and ETH liquidity pools are tied together, so if the ETH price goes down, so does CULT. In turn, if ETH goes up, so does CULT.
You can see that CULT is nearly at a 1:1 ratio with ETH for now, coming in at a 0.91 ratio.
In other words, if my thesis is correct about ETH and it goes to 15,000 dollars, the price of CULT would be as follows:
- ETH at $10,000:
CULT Price: $0.000005008 (4x increase).
Market Cap: $21.38M (4x increase).
- ETH at $15,000:
CULT Price: $0.000007512 (6x increase).
Market Cap: $32.08M (6x increase).
That’s right—if nobody even bought CULT, not one dollar, the base liquidity increase of ETH would bring the market cap to possibly 32 million, in other words, if you were thinking of buying ETH, why don’t you just buy CULT DAO?
You can buy ETH now; from this price, 15,000 is 7x, or you can buy CULT DAO, get 6x plus whatever extra volume is coming in. It seems like a logical play, really.
Everything you’ve seen so far is why I believe this MACD histogram divergence has been forming for 750 days. As I said, the stars will align at the apex, and the explosion will come.
### Unruggable and No Whales Controlling Supply
As you can see from the bubble map, the largest wallet that is not an exchange has a cluster total of 0.7%. The rest of the clusters you see in the image are basically exchange wallets, which are the red and dark green circles mostly.
Liquidity is also locked for over 200 years.
- Burned Supply = 1.29664T
- Circulating Supply (including staked) = 4.27T
- Staked Supply = 1.07599T
- Remaining Tradable Supply (excluding burned and staked) = 4.27T - 1.29664T - 1.07599T ≈ 1.89737T
So, no whales, and it’s not possible to rug because liquidity is locked.
### Modulus Blockchain Liquidity Injection
The average liquidity injection for DAOs in ZK would be anything from 200,000 to 10 million. Let’s assume it’s a $1M injection that is split 50/50 between CULT and ETH, a common practice for Uniswap-style pools.
- CULT Amount in Pool: At the current price of $0.000001252, $500,000 buys ~399.36B CULT ($500,000 ÷ $0.000001252).
It would increase the price to a 10 million market cap overnight.
### Conclusion
- Liquidity is locked for 200 years
- No whales
- Not possible to rug
- Mainnet launching this year
- ETH pools tied to CULT
- MACD histogram divergence
The target I have for CULT is just based on Fibonacci levels. Honestly, it’s unpredictable what will happen, how high it will go, or the impact the Modulus chain will have. 120 million is my low-end estimate; the macro Fibonacci is much higher.
The last extension puts it at a 1.4 billion market cap and 266x from where we are now.
This is where you want to be for the upcoming alt season—right here, down 98% with this massive divergence and all these factors that come into play. Just the mainnet launch and ETH going to 10,000 basically sends this to a 30-50 million market cap.
Cult DAO and Satoshi Nakamoto share a common ethos of decentralization and anti-centralization. We need to embrace this notion and bring back the power to the many. If CULT DAO hits 1.4 billion dollars, the treasury funds would be in the millions; we fund our own future.
moduluszk.io
cultdao.io
cultdao.io
coinmarketcap.com

Ethereum Faces the 'Symplegades'– Will Pectra Propel It Through?Ethereum Faces the 'Symplegades' – Will Pectra Propel It Through?
⚔️🪨 Ethereum Faces the 'Symplegades' – Will Pectra Propel It Through? 🪨⚔️
In ancient Greek myth, the Symplegades — Clashing Rocks — tested Jason and the Argonauts with a narrow, deadly passage. Today, Ethereum faces its own mythic trial as price action presses into a critical zone.
📍 The $2,805–$2,848 resistance zone is acting like the Clashing Rocks — volatile, dangerous, and decisive. Beneath it, support rests near $2,616 and $2,565 . A breakout from this trap can open the way to $3,200+ , but rejection may mean another violent plunge. ⚠️
🔧 Enter: PECTRA – Ethereum’s Game-Changing Upgrade
Ethereum’s most ambitious upgrade since The Merge is nearly here. PECTRA isn’t just a backend update — it redefines how the network feels and functions:
🧠 Smarter Wallets
– Batch transactions
– Skip approval popups
– Pay gas in any token
⚡ Frictionless UX
– Fewer clicks
– No more endless “approve + confirm” loops
📉 Cheaper Transactions
– More blobs = better L2 scaling
– Lower fees, even during congestion
🌱 Staking Overhaul
– Validator cap raised to 2048 ETH
– Smart contract withdrawals
– Faster deposit recognition
🔓 Unlocking $490B in trapped value
– Assets become more accessible and usable
“The Merge changed how Ethereum works.
Pectra changes how it feels. ” – @ethereum
⛵ Will ETH Break Through the Clashing Rocks?
This is not just another consolidation box.
It’s a moment of mythic symmetry — where price action, fundamentals, and network transformation converge.
Sail through the Symplegades... or get crushed between them?
Stay sharp. Watch the breakout. The next move will be defining.
One Love,
The FXPROFESSOR 💙

Ethereum: Correction to $1,300–$1,500 and Rise to $2,500–$2,800#Ethereum Price Analysis: Correction to $1,300–$1,500 Before Potential Rise to $2,500–$2,800
Let’s break down why Ethereum (ETH) might correct to the $1,300–$1,500 range and then potentially rise to $2,500–$2,800 (with increased risk beyond that).
Technical Analysis
On the ETH/USDC 5-day timeframe chart from Coinbase, key points confirm a correction to $1,300–$1,500:
1. Correction Target: $1,300–$1,500 ("Coinbase orders")
• Limit orders were placed on Coinbase before the drop.
2. Hyperliquid Liquidation Map
• According to the Hyperliquid Liquidation Map, the liquidation level for long traders is at $1,337.00, within the target zone of $1,300–$1,500.
• A price drop to this level could trigger a cascade of liquidations, and market makers might accumulate positions at the lowest prices, specifically in the liquidation area.
3. Elliott Waves
• We’re completing the 5th wave and starting to form a reversal. This event will roughly coincide with the S&P 500’s reversal.
What Event Could Trigger the Correction?
• An expected Bitcoin correction to $70,000–$76,000 could trigger Ethereum’s drop, as the altcoin market historically follows BTC.
• I’ve previously shared this Bitcoin idea; we’re waiting for it.
Potential Targets for Ethereum Before a Global Downturn
Look for an exit point in this area: $2,500.00–$2,800.00
➖ This is approximately the 61.8% Fibonacci level
➖ A significant area according to the Volume Profile
➖ Large sell orders on Binance at $2,500, $2,800, and $3,000
➖ On Coinbase, they’re getting smarter and splitting orders into 500–600 ETH.
➡️ In Summary for Ethereum
This makes the $1,300–$1,500 range attractive for buying the dip.

Ethereum 6X Lev. Full PREMIUM Trade-Numbers —2nd Entry—PP: 1806%This is a second entry for a long-term leveraged chart setup for ETHUSDT (Ether).
This is truly the last chance to get Ethereum at low prices before a major bullish impulse, the biggest one in a long time.
The chart structure is perfect. The low conditions look very similar to June 2022, very similar.
We have long-term higher lows blah blah blah... By now, you already know all these things as I read this chart a million times.
I don't have much to say other than remain calm, whatever happens. Sleep easy because Crypto is going up. It is as simple as that. It will grow, soon.
Full trade-numbers below:
_____
LONG ETHUSDT
Leverage: 6X
Entry levels:
1) $1,900
2) $1,825
3) $1,630
Targets:
1) $2,125
2) $2,405
3) $3,347
4) $4,017
5) $4,871
6) $6,000
7) $7,337
Stop-loss:
Close weekly below $1,600
Potential profits: 1806%
Capital allocation: 3%
_____
I would like to thank you again for reading. Your support is appreciated.
I know it is a lot of content but this is meant for many different people all across the world.
If you like what you see make sure to follow.
If you want to see more, leave a comment and boost to show your support.
This is the big one.
Namaste.

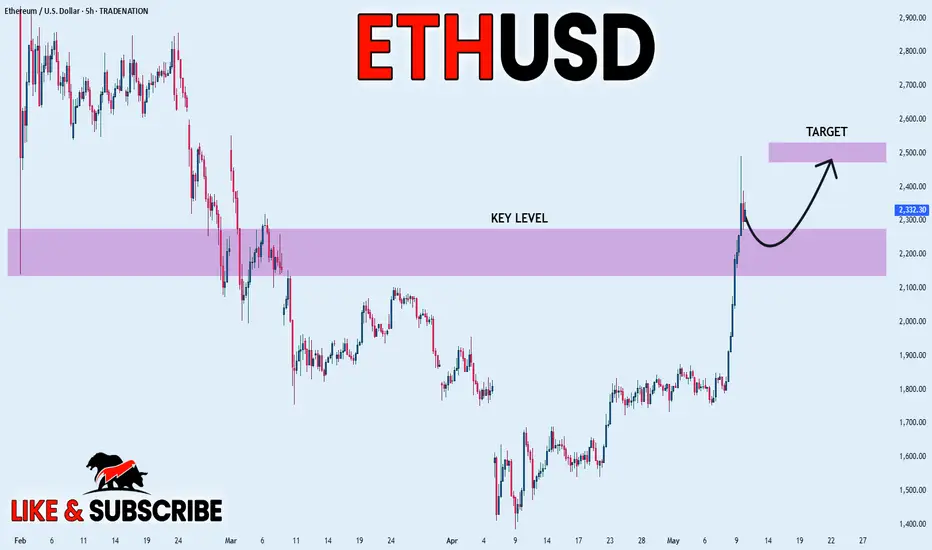
ETHEREUM BULLISH BREAKOUT|LONG|
✅ETHEREUM is growing finally
And the coin broke a key horizontal
Level of 2,200$ and the breakout
Is confirmed so we are bullish biased
And we will be expecting a
Further bullish move up
LONG🚀
✅Like and subscribe to never miss a new idea!✅
Disclosure: I am part of Trade Nation's Influencer program and receive a monthly fee for using their TradingView charts in my analysis.
$ETH 20% Move With 20/50DMA CrossoverHOLY MOLY!
Over 20% gain for CRYPTOCAP:ETH on the day
20DMA making a bullish crossover the 50.
Next target at the .382 Fib ~$2400
Did Pectra actually work?
And is Ethereum back from the dead !?

ETH is fighting in a strong resistance zone!Hello everyone, I invite you to review the current situation on ETH. When we enter the one-day interval, we can see how the ETH price came out on top from a strong downward trend.
Here we can see how the current bounce brought the movement closer to a very strong resistance zone from $ 2,090 to $ 2,310, in which we can currently observe a fight for further upward movement. Only when the price comes out on top, it can go towards resistance at $ 2,740, and then move towards strong resistance at $ 3,070.
Looking the other way, we can see that when the trend reverses, we first have support at $ 1,837, then a very strong support zone from $ 1,610 to $ 1,404 is visible, however, if this zone is broken, we can see a quick decline to the support area at $ 1,071.
On the RSI indicator we can see how strong the ETH price movement is visible intensively on the indicator and here we can see how we are approaching the upper limit, which could potentially slow down the movement or give a temporary relief.
