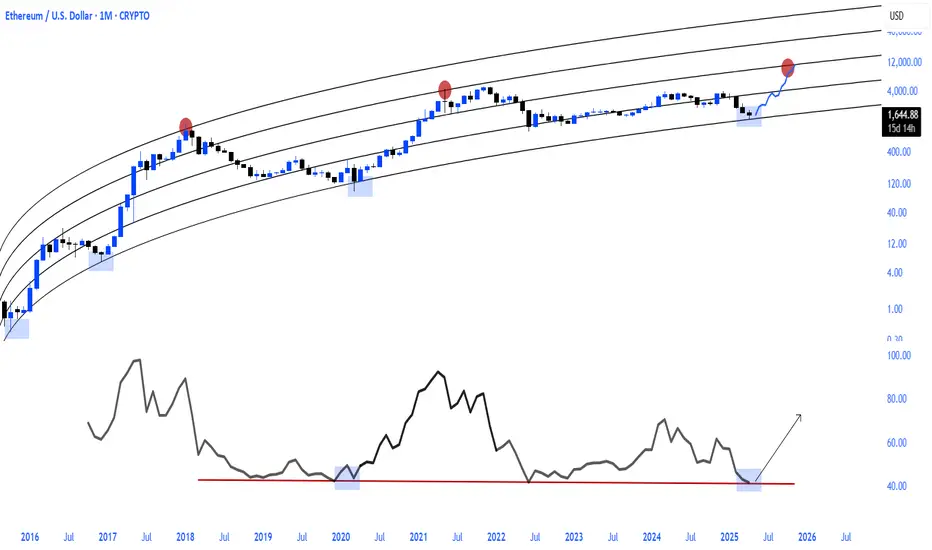
Stromm | ETHEREUM No Life Signal YETCompared to Bitcoin, Ethereum is honestly still moving at a snail’s pace — and the performance is almost embarrassing at this point.
There’s still barely any strength showing on the CRYPTOCAP:ETH chart.
Yes, ETH has finally reclaimed the Previous Monthly Low, and it’s holding it — which is a positive step.
But let’s be real:
We’re still 83% below the Yearly Open — a mind-blowing distance when you consider how BTC is behaving right now.
I'm currently risk-free on my trade here, which is a nice position to be in.
If we get another drop, I plan to add at the next Monthly Order Block.
But something serious needs to happen at the Ethereum Foundation level — real fundamental shifts — if ETH is going to deliver the kind of rally people keep hoping for.
Otherwise?
Everything else in the market is outperforming ETH by a mile — and that’s the worst-case scenario for Ethereum:
It doesn't die,
It just gets left behind.
For now, at least I’m sitting in profit, and that's a good start.
Everything beyond this will need careful watching — no blind assumptions, no blind faith.
ETH needs to prove itself — and fast.
ETH-D

Ethereum CME Gaps: Inevitable Fill Zones Ahead Chart shows the daily Ethereum (ETH) futures on CME, highlighting three significant CME futures gaps—areas where price jumped due to the weekend market closure. These gaps are key zones where price has historically returned to “fill” the missing trading activity.
Gap 1 at $1,770 is the most recent and closest to the current price of $1,477, suggesting a possible short-term bullish move.
Gap 2 at $2,630 and
Gap 3 at $3,290 are higher up and reflect unfilled areas from previous market drops.
ETH is currently trading below all three gaps, creating a strong technical case for future upward movement. Sooner or later, these gaps will get filled. 🧘♀️

Two Bullish Scenarios to Watch on ETHUSDTThis week, BINANCE:ETHUSDT has shown a significant upward movement, and there's a good chance it could continue its bullish momentum.
There are two bullish scenarios developing on BINANCE:ETHUSDT :
1. After a pullback, we could see an impulsive move that breaks the previous high (marked with the red arrow) and pushes the price towards the first target at 1,911 – 1,957.
2. The price could move sideways for a while, forming a bullish pennant pattern. In this case, a correction towards 1,756 – 1,731 might occur before the price resumes its move to the first target at 1,911 – 1,957.
Both scenarios remain valid as long as the price holds above 1,722.
If the second scenario plays out, the pullback to 1,756 – 1,731 can be considered a good buy zone (for those who are not in position yet).
Remember: wait for a confirmation candle before entering and place your stop-loss just below the confirmation candle.

Bearish drop off pullback resistance?Ethereum (ETH/USD) is reacting off the pivot and could drop to the 1st support.
Pivot: 1,808.27
1st Support: 1,451.43
1st Resistance: 2,102.09
Risk Warning:
Trading Forex and CFDs carries a high level of risk to your capital and you should only trade with money you can afford to lose. Trading Forex and CFDs may not be suitable for all investors, so please ensure that you fully understand the risks involved and seek independent advice if necessary.
Disclaimer:
The above opinions given constitute general market commentary, and do not constitute the opinion or advice of IC Markets or any form of personal or investment advice.
Any opinions, news, research, analyses, prices, other information, or links to third-party sites contained on this website are provided on an "as-is" basis, are intended only to be informative, is not an advice nor a recommendation, nor research, or a record of our trading prices, or an offer of, or solicitation for a transaction in any financial instrument and thus should not be treated as such. The information provided does not involve any specific investment objectives, financial situation and needs of any specific person who may receive it. Please be aware, that past performance is not a reliable indicator of future performance and/or results. Past Performance or Forward-looking scenarios based upon the reasonable beliefs of the third-party provider are not a guarantee of future performance. Actual results may differ materially from those anticipated in forward-looking or past performance statements. IC Markets makes no representation or warranty and assumes no liability as to the accuracy or completeness of the information provided, nor any loss arising from any investment based on a recommendation, forecast or any information supplied by any third-party.

#Ethereum + $10k Local top!#Ethereum + $10k Local top!
A real #Altcoins Season will only begin when CRYPTOCAP:ETH rises.
Whether you love it or hate it, it's just a fact and the truth is always bitter.
Ethereum Starts Moving Toward $7,000 With...Ethereum starts its next major advance towards a target of $7,000 and beyond with a full green candle this week.
This week is not only a full green candle signal it also cancels out the last two which produced a bottom and neutral signal, as well as recover more than three weeks of bearish action.
So now Ethereum is moving back to levels it traded back in late March, above $1,800. Going to this level means higher prices and this is only the start.
The 7-April week is such a strong clear reversal signal it is hard to explain. We have a Doji with a multi-year low, but this low ended with a green candle and confirmation comes this week as Ethereum turns full green. This is the last chance to get Ethereum below $2,000 and while prices are low.
When the next move happens, which is a close and confirmation above $1820, ETHUSDT will never trade at these prices and levels again, likely ever. It will grow and grow so much that nobody will be selling as much as they sold in the past. The start of a new long-term bullish cycle; the 2025 bull market.
I wanted to let you know that market conditions are green and you don't have to hold anymore. The market will start moving and produce a period of expansion that has not been seen in so long.
Even if you have experience with previous bull markets, it is hard to put in words. When it is happening it is so much different. It is not the same saying or knowing that Ethereum will grow as seeing it happen, and when it happens it goes more than what you think is possible or you are prepared for.
If for some reason you did not position yourself when the time was right, now, you will be thinking, "Why didn't I buy? The market was trading so low for long..."
You don't have to reach this point.
The charts are yours, the market is yours and you have experience.
You can take advantage of this situation and become a big winner in 2025 and beyond.
Many millionaires will be produced this year, will you be one of those?
I don't know but I am working hard.
Let's win together, we can do this with hard work, smart work and dedication.
Thanks a lot for your support.
Namaste.

ETHBTC will supercede BTCs price growth % metrics. Time to SEED!ETH has been met with so much price gravity lately that it went to correct unbelievably from 4k+ to 1.5k.
Thats more than -3x of its peak price - an overextended trim compare to its peers like BTC which did a muted hibernation but still price remained afloat up there.
But hope is starting to arise from the latest price behavior. We are seeing some significant shift in trend. Net longs are starting to pile up from the current bargain price area -- conveying positioning of long term growth seekers. BTC is showing some massive break in structure as well showing some obvious signs of market recovery as a whole.
With this in mind, ETH metrics is becoming more and more attractive -- if we compare its possible price growth in terms of percentage and proportionality growth ratio.
ETHBTC will definitely benefit with this forthcoming growth ratio change.
Based on our diagram, we are already seeing some gradual shift -- a first sign of reversal to the upside. This can roll up soon and pace up its numbers.
Price is currently bouncing perfectly from its 6 year solid support. This is a massive hint already of things to come. GOOD THINGS.
Spotted at 0.0190
Target X10.
TAYOR. Trade safely.

BRIEFING Week #17 : AAPL's fate is the SP'sHere's your weekly update ! Brought to you each weekend with years of track-record history..
Don't forget to hit the like/follow button if you feel like this post deserves it ;)
That's the best way to support me and help pushing this content to other users.
Kindly,
Phil

ETH Bottomed last week!This chart illustrates the ratio of the market capitalization of the top three stablecoins and that of Ethereum (ETH).
The correlation is quite evident, as anticipated.
We are likely approaching a phase where these stablecoins will be deployed, with Ethereum being a key beneficiary, signalling that we are entering a period of increased risk appetite and overall market buoyancy.
#ALTS
#USDT
#USDC
#DAI
#ETH

A wonderful ALTCOIN Bullrunis all set in motion.
If my chart resonates with you in any way.
The combined dominance charts of the big four.
#BTC.d
#ETH.d
#USDC.d
#USDT.d
We are on our way to my anticipated target zone.

ETHUSDT is Breaking Out!! Is the Bull Run Finally Here?After a long period of consolidation within a descending channel, BINANCE:ETHUSDT is showing signs of life as it finally breaks out with bullish intent. This technical breakout could mark the beginning of a fresh bull run, reminiscent of past explosive moves we’ve seen from MARKETSCOM:ETHEREUM following major corrections. Historically, CRYPTOCAP:ETH has experienced drawdowns of over 90%, only to bounce back stronger and reach new all-time highs.
Currently, BITSTAMP:ETHUSD remains deep in the oversold zone, suggesting it’s still undervalued relative to its potential. As momentum begins to pick up, we could see targets being hit one by one, driven by renewed investor interest and favorable market conditions.
Moreover, the recent surge in COINBASE:ETHUSD ETF inflows adds fundamental weight to the technical setup. This institutional participation could act as a catalyst for a sustained rally, reinforcing the bullish bias.
That said, risk management is key. Always trade with a clear stop loss and position sizing to protect capital. The opportunity is brewing – the question is, are you ready to ride the wave?
BYBIT:ETHUSDT Currently trading at $1790
Buy level : Above $1750
Stop loss : Below $1490
Target : $4000
Max leverage 3x
Always keep stop loss
Follow Our Tradingview Account for More Technical Analysis Updates, | Like, Share and Comment Your thoughts

WELCOME TO THE BEGINNING OF ALT COIN SEASON!Traders, Hodlr's and Soon to be Liquidity (late retail buyers),
This is likely the moment we have been waiting for. Last week in our weekly VIP market update we discussed just a few things that would really show us if we just saw the bottom of the alts and if it was now time to start seeing some new local HH's and then HL's showing us a shift in trend. I had posted a few trades pointing this out. We have now at this point accomplished what we were looking for to see if we would be starting Alt coins season.
We have been watching a few things. The first being Bitcoin Dominance or CRYPTOCAP:BTC.D as this is a great chart to watch and look for reversals prior to looking at the chart of the specific alt coin against BTC to see if it also is showing it could have a rally or a pullback based on your bias on this BTC.D chart. For instance if I were to want to see maybe when XRP would likely start breaking out say that this BTC.D chart is in fact correct and the triangle trend line will end up being the top for btc dominance at around 64.4% of the total market I would go to BITSTAMP:XRPBTC to give myself some insight on confluence of market movements.
Being that we are now here at the point that I believe we will start to see money flow into alts based on this chart and others such as CRYPTOCAP:TOTAL2 , CRYPTOCAP:TOTAL3 and CRYPTOCAP:TOTALDEFI and the specific BTC pairings that I am holding by looking up the ticker of my alt coin/BTC and studying that chart I will honestly say that I am in the 90%/10% bullish on alts to bearish.
I hope this information helped you in your journey to get more information and come up with your own analysis to base your investment decisions and you become prosperous for doing soo!
Stay Profitable Folks,
Savvy!

A Reversal on ETH/BTC is already on its way.With 80% probability, ETH will soon become stronger than Bitcoin.
Many factors are now on the side of Ether.
I have already written about them, a huge plus is ETH - ETF Staking for the guys from Wall Street.

Ethereum Breaks Out of Descending Channel–But Is It Sustainable?Hello guys.
Ethereum (ETH/USDT) has recently broken out of a well-defined descending channel on the 12H timeframe, suggesting a short-term shift in momentum. However, traders should remain cautious, as price action still faces significant resistance ahead.
🔍Technical points:
Descending Channel Structure: ETH has been trending downward since early February 2025, forming a clean descending channel with lower highs and lower lows.
Fake Breakout & Reversal: Earlier in April, the price dipped below the lower boundary of the channel in what now appears to be a fake breakdown, quickly recovering back inside.
Confirmed Breakout: Recently, ETH managed to close above the midline of the channel, breaking above short-term resistance near $1,640. This confirms a bullish breakout, at least in the short term.
Next Key Resistance Zone: The price is now targeting the $1,850–$2,050 area — a strong supply zone and previous structural level. If ETH fails to break through this zone, we may see another leg down inside the broader downtrend.
Short-Term Projection:
Bullish Path: A possible continuation toward the upper channel edge near $1,900–$2,000.
Bearish Rejection: If sellers defend that zone, ETH could resume its downward trend, potentially revisiting $1,500 or even lower.

BITCOIN AND ALT COIN ANALYSIS!I hope you guys enjoyed the video! If you have any questions or comments feel free to comment down below!

Altcoins, Crypto is different since institutions came inHow long have we been saying this? Yet the masses have not grasped this concept. Neother have influencers. But that makes sense because they need clicks to survive. People tend to "graze" where pasture seems greener, even if it isn't.
CRYPTOCAP:TOTAL 3 = NO CRYPTOCAP:BTC or CRYPTOCAP:ETH
Altcoins have been in a steady incline since Nov 23.
Daily
The last 2 consolidation phases lasted AROUND 6 months, depending on where you begin the consolidation phase.
Weekly
Not important going further as Crypto landscape has changed & the back data is irrelevant. However, let's be nosey & see how it looks in comparison.

ETH/BTC bear market since 2021.. bounce time ?ETH / BTC
If you checked this chart you will notice that ETH was in downtrend and bear market against BTC since 2021 !
Now we have reached a very important multi years support (price action on 2020 - 2019 - 2016 )
Time for bounce soon ?

Ethereum vs SolanaIn 2025, the competition between Ethereum and Solana is no longer just a rivalry — it’s a pivotal chapter in blockchain evolution.
We are witnessing a clash of two philosophies:
Ethereum — maturity, security, and deep ecosystem
vs.
Solana — speed, efficiency, and adaptability.
📈 Price Resilience vs. Market Legacy
While Ethereum still holds the crown in market cap and institutional trust, Solana is rewriting the rules with superior transaction speed and cost-effectiveness.
The question is no longer "Who is better?"
It’s "Who is evolving faster?"
⚡ Key Drivers Shaping the Ethereum-Solana Rivalry
1️⃣ Scalability vs. Stability
Solana leads with up to 65,000 TPS, attracting high-frequency traders, NFT creators, and DeFi innovators.
Ethereum, relying on its Layer-2 solutions, tries to balance security with scalability.
2️⃣ Institutional Shifts
Funds like Galaxy Digital and Ark Invest are reallocating capital towards Solana, betting on efficiency and growth.
Ethereum, meanwhile, is waiting on ETF approvals to regain momentum.
3️⃣ Technological Innovation
Ethereum focuses on sharding and Layer-2 expansion.
Solana pushes aggressive ecosystem growth but pays the price with occasional network instability.
📊 Market Performance Snapshot — 2025
Ethereum: ▼ 56% YTD | ~$1,600
Solana: ▼ 40% YTD | ~$135
Solana’s DEX market share jumped to 39.6% in Q1, driven by meme coins and retail traders.
Ethereum’s dominance continues to erode under macro pressures and rising competition.
But don’t be fooled — Ethereum's foundation remains strong. Institutional adoption and infrastructure upgrades still offer potential for a rebound.
📉 ETH/BTC Looks Like a Meme
ETH/BTC:
SOL/BTC: Potential -50% in next 160 weeks ➡️
ETH/SOL:
⚡ Where Did the Liquidity Go?
The real question isn’t why ETH is dropping —
It’s why no one cares.
Layer 2 solutions — Arbitrum, Optimism, Base — have drained liquidity from Ethereum’s mainnet.
DeFi activity? → Migrated to L2
Users? → Choosing lower fees and speed
Ethereum L1? → A blockchain for whales and archives
No liquidity = No rally
No narrative = No attention
Funds are betting on Solana and L2, not Ethereum’s base layer.
🎯 When Could ETH Take Off?
Only if we see:
A strong “Liquidity Returns to L1” narrative (RWA could be a trigger)
Spot ETH ETFs launching with institutional accumulation
A new DeFi wave on L1 (unlikely with current gas fees)
Or simply — when the market decides to pump forgotten assets
For now, Ethereum is about patience.
Smart money is flowing into L2, Solana, and high-risk narratives.
🕒 But Time Will Tell...
Today, we debate ETH vs. SOL.
Tomorrow — the bull market ends, and we’ll be discussing entirely different narratives.
Are you SOL or ETH?
As always, stay one step ahead.
Best regards,
EXCAVO
______________________________
Disclosure: I am part of Trade Nation's Influencer program and receive a monthly fee for using their TradingView charts in my analysis.

Bullish bounce off 50% Fibonacci support?Ethereum (ETH/USD) is falling towards the pivot and could bounce to the 1st resistance.
Pivot: 1,671.81
1st Support: 1,547.72
1st Resistance: 1,829.87
Risk Warning:
Trading Forex and CFDs carries a high level of risk to your capital and you should only trade with money you can afford to lose. Trading Forex and CFDs may not be suitable for all investors, so please ensure that you fully understand the risks involved and seek independent advice if necessary.
Disclaimer:
The above opinions given constitute general market commentary, and do not constitute the opinion or advice of IC Markets or any form of personal or investment advice.
Any opinions, news, research, analyses, prices, other information, or links to third-party sites contained on this website are provided on an "as-is" basis, are intended only to be informative, is not an advice nor a recommendation, nor research, or a record of our trading prices, or an offer of, or solicitation for a transaction in any financial instrument and thus should not be treated as such. The information provided does not involve any specific investment objectives, financial situation and needs of any specific person who may receive it. Please be aware, that past performance is not a reliable indicator of future performance and/or results. Past Performance or Forward-looking scenarios based upon the reasonable beliefs of the third-party provider are not a guarantee of future performance. Actual results may differ materially from those anticipated in forward-looking or past performance statements. IC Markets makes no representation or warranty and assumes no liability as to the accuracy or completeness of the information provided, nor any loss arising from any investment based on a recommendation, forecast or any information supplied by any third-party.

Ethereum (ETH) XABCD Pattern – $3,000 Target Ahead?ETHUSDT is at $1,759 and we’ve got an XABCD harmonic pattern in play!
▸ From $1,516 (X) to $4,147 (A), then slow retracement to $2,120 (B), then a big spike to $4,120 (C), and crash to $1,385 (D).
▸ Now, the chart is eyeing $3,000 as the next big target!
▸ Watch $2,100 and $2,500 as resistance on the way up. $1,500 is key support – let’s see if it holds!
✉️ What’s your take?
Will ETH hit $3,000, or are we dipping first? Drop your thoughts! ⬇️

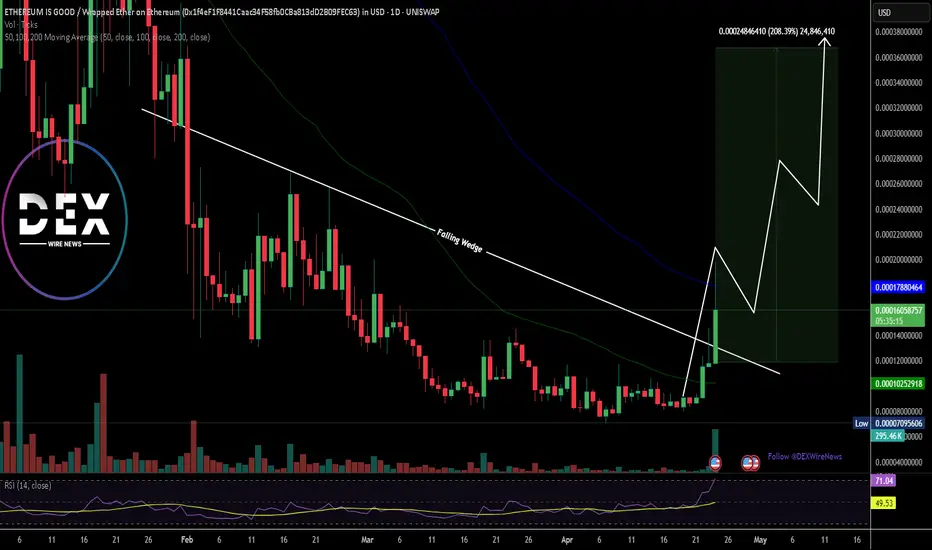
Breaking: $EBULL Spike 70% To Reclaim $1 Million Market Cap The price of Ethereum is Good token ticker name ($EBULL) has seen a notable surge of 70%, breaking out of a falling and setting the stage for a 200% leg-up.
Lunched Oct 06, 2024 (7 months ago) with a price of $0.00005729, $EBULL hit its all-time-high Aug 31, 2024 (8 months ago) and has since plunge losing about 94% of market value.
Ethereum is good coin ($EBULL) has been a ticking time bomb in the crypto market with cryptic post by Vitalik Butetrin Ethereum's founder, $EBULL might just be on the cusp of a breakout.
Another bullish thesis is the fact that $EBULL is only listed on one CEX which is Poloniex. With more exchange listings, $EBULL might be the catalyst for the next bull run.
With growing momentum and reduction of fees on the Ethereum chain, we will see an influx of traders back to the Ethereum ecosystem, leading to massive adoption of Ethereum chain coins.
$EBULL's RSI is at 71, making it a prime contender of the continuation pattern as the memecoin has already broken the ceiling of a falling wedge.
ETHEREUM IS GOOD Price Data
The ETHEREUM IS GOOD price today is $0.000166 USD with a 24-hour trading volume of $307,290 USD. ETHEREUM IS GOOD is up 40.90% in the last 24 hours. The current CoinMarketCap ranking is #1721, with a market cap of $1,658,645 USD. It has a circulating supply of 10,000,000,000 EBULL coins and a max. supply of 10,000,000,000 EBULL coins.
ETH - New ATH Approaching?Bitcoin has been full of surprises over the past few days, and this will most definitely affect Ethereum as well - which has not made a previous ATH when BTC did , a point we should not be forgetting.
This would also bring about the beginning of a new ALTSEASON.
But before we get too excited about all of the above - let's first see if Bitcoin can continue to CLOSE daily candles above the key support zone, as pointed out in the video.
_______________
BINANCE:ETHUSDT
BINANCE:BTCUSDT

ETHUSD - IdeaCould the triangles be comparable?
With the first leading to a strong break out upwards
Have we hit the bottom of the next triangle?
I think these would be ascending triangles
Saw this chart or a similar version floating around and thought it would be a good post
Weekly timeframe
