ETH - two scenarios ❗❗Ethereum is locally in a range. If price breaks through and tests the lower boundary of the range as resistance, the next target will be the local low, under which the bullish stop-losses are located. Also, the price could break the upper boundary and test it as support, if that happens, the next target would be the upper marked area.
Write in the comments all your questions and instruments analysis of which you want to see.
Friends, push the like button, write a comment, and share with your mates - that would be the best THANK YOU.
P.S. I personally will open entry if the price will show it according to my strategy.
Always make your analysis before a trade
Ether

ETH/LONG/positionBINANCE:ETHUSDT
You can enter the long position right now or
wait until the opposite trend line is broken. The ma
rket will not have a strong climb. Do not forget capital management.

The fractal everyone is talking about ETHUSDClear similarities both in price action and in MACD setups
Ethereum right now has a strong bottom setup and will likely hodl this bottom, leading to the bull part of this scenario with the ~200% increase
I have seen versions of this across twitter and Facebook and thought I would address it for my followers
I aim to exit mid next year at by then 8k or higher


ETHEREUM | Getting Ready for Another Bullish Wave..!!#ETH (update)
In $USDT Pair, Broadening Wedge Formation in 8h timeframe.
Expecting Bullish Wave towards the $4200 🐳
In $BTC Pair, Forming Falling Wedge Pattern in 4h timeframe.
In Case of Wedge Breakout, Expecting Another +12% Bullish Wave
Please like the idea for Support & Subscribe for More ideas like this and share your ideas and charts in Comments Section..!!
Thanks for Your Love & Support..!!

ETHBTC's Aggressive Positioning The bullflag positioning (in green) is perfect for a massive breakout to the upside
Further than the prior fib level ATH (2.618)
Time will show

Ethereum has a lot of room to move ETHUSDA massive support is evident
This will most likely hodl with the reset test
Lead to bullish continuation and further testing ATH's for ETHUSD

Ethereum (ETH) Not Ready for The UpsideETH / USD ANALYSIS
The Ethereum price has been able to establish the $3352 region as a strong support zone . Every drop here has been faced with aggressive buying pressure. Therefore, if it sustains above the 9-day moving average, it could potentially start to navigate back to its resistance between the $3400 and $3500 resistance levels. If the buying pressure evaporates around $3100, it could see Ethereum incur some heavy downwards momentum that sends it to the supports at $3000, $2800, and $2600.
In the meantime, it is important to note that all these losses that the coin has suffered have fundamentally changed the structure of the cryptocurrency market. Traders are to note that ETH/USD in the short term could be positioned to see a significant downside effect. Buyers should be on the lookout for $3800, $4000, and $4200 as a target to watch and a strong bullish reaction at this level is vital for Ethereum to maintain its medium-term outlook while the Relative Strength Index (14) is seen moving below 55-level.
Against Bitcoin , we can see that Ethereum is clearly bearish . Meanwhile, as the price falls, the sellers are posing an additional threat for buyers to reach the support level of 7315 SAT where the nearest target is located. However, an eventual break below the 21-day moving average may cause Ethereum to collapse.
Follow my daily charts for more ideas.
If you agree with this, follow, like and share.

Ethereum Bull DivergenceBull divergence can be seen on chart and indicator
Price prints a lower low
while indicator prints higher low
This is the 4Hr chart for ETH

Ethereum Making Inverse Cup and Handle PatternAfter a Solid Mini Bull Run Ethereum failed to break its All Time High.
Now After Huge Dip of BTC, Ethereum couldnt stand and even dipping more.
Ethereum also showing Cup and Handle which if plays out with an target of 2544. Which could be a great Shorting opportunity in a upcoming Bear Market.
Keeping in Mind that Ethereum has very good support at 2750.
Good Luck.

Ethereum forming inverse Cup and HandleEthereum Forming inverse Cup and handle with a Target of 2600 But ethereum has Good Support at 2750 So it could stablize at 2750 if this old fashioned Pattern Plays Out. EMA also given Sell Signal on 4hr so it mostly looks like will play out.
This also relate to BTC price action if btc as predicted can touch 37000 then surely ethereum can visit 2750.
Good shorting Opportunity awaits
ETH potential patternHi everyone,
Today I would like to bring your attention to the possible pattern on ETH.
Take this as you will, but I think where we are now is eerily similar to 5th of September 2017.
Both in 2017 and recently we had a rising wedge consolidation with a massive blow off top forming after breaking up from the wedge.
The blow off then retested the bottom of that wedge as support, bounced and retested the ATH. After the retest of ATH we get a sharp correction and a test of formed bottom.
ATM we haven't yet tested the double bottom that was formed at $2400, and really there is no way of knowing whether ETH will get there. But if ETH does get to $2400-2600 range and holds that as support, I think there's a good chance ETH will target $10k and maybe more.
See the image below for the pattern in September 2017.
Please do leave a comment below,
Thanks.

Warning signs... ETH signalling more downside?The signs were starting to develop, but yesterday really brought the picture into clearer focus:
- ETH daily showing downside potential with RSI divergence to price
- MACD (longer MA settings) starting to cross down
My daily stop-and-reverse system has gotten me out of everything. So sitting on the side lines until things change:
P.S. This is marked as a short idea, but I never actually go short, just bearish for now. #LongOnly

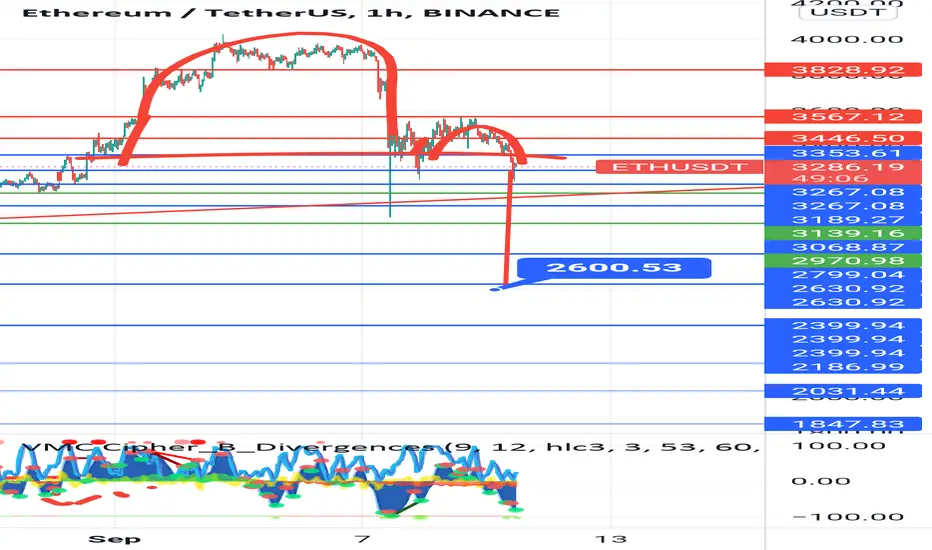
ETHUSD Idea / ForecastThis is how i see price following this large falling wick playing out
A large drop then leading to a slow yet inevitable rise
Still bullish

Will ETH follow SOL?It can be seen on the 50,100 and 200MA that a very similar pattern has emerged between SOL and ETHUSD
ETH may be on a crash course towards the moon
aim for 8K

ETHEREUM - DEAD CAT BOUNCE OR MANIPULATION EVENT?What if this “dead cat bounce” leads to a macro manipulation event that continues the ongoing uptrend? With the current market conditions, it would be highly likely to face these type of scenarios before recovering.
We could expect the price to bounce off the current levels or near the psychological $3k level. This situation would create a macro OB that would be tested to liquidate lured breakout buyers, gathering liquidity and giving rise to the expected move.
What are your thoughts on this one? Let me know!
