#ETH/USDT towards upper levels#ETH
The price is moving within a descending channel on the 1-hour frame, adhering well to it, and is heading for a strong breakout and retest.
We have a bearish trend on the RSI indicator that is about to be broken and retested, which supports the upward breakout.
There is a major support area in green at 4260, which represents a strong support point.
For inquiries, please leave a comment.
We are in a consolidation trend above the 100 Moving Average.
Entry price: 4300
First target: 4333
Second target: 4378
Third target: 4427
Don't forget a simple matter: capital management.
When you reach the first target, save some money and then change your stop-loss order to an entry order.
For inquiries, please leave a comment.
Thank you.
ETHPERP

#ETH/USDT towards upper levels#ETH
The price is moving within a descending channel on the 30-minute frame, adhering well to it, and is heading for a strong breakout and retest.
We have a bearish trend on the RSI indicator that is about to be broken and retested, which supports the upward move.
There is a major support area in green at 4255, which represents a strong support point.
For inquiries, please leave a comment.
We are in a consolidation trend above the 100 Moving Average.
Entry price: 4295
First target: 4326
Second target: 4367
Third target: 4417.83
Don't forget a simple matter: capital management.
When you reach the first target, save some money and then change your stop-loss order to an entry order.
For inquiries, please leave a comment.
Thank you.

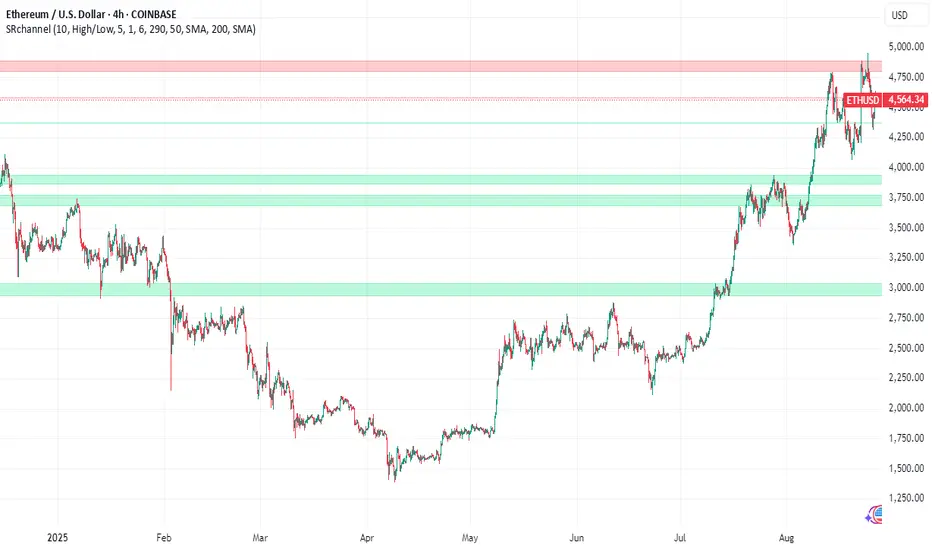
ETHUSDTI think moved trend by break 4485$ resistance and 4250$ support in BINANCE:ETHUSDT .
Support: 4250 - 3900 - 3510
Resistance: 4485 - 4720 - 5000
Please control risk management.

Ethereum at Risk? Leverage Hits Record High as AI Finance BoomEthereum (ETH), the second-largest cryptocurrency by market capitalization, is navigating a complex and dynamic environment. On one hand, Ethereum continues to emerge as the backbone of AI-powered finance, solidifying its role as the infrastructure layer for the next wave of intelligent decentralized applications. On the other hand, market participants are growing wary, as the Binance leverage ratio for ETH has surged to historic highs, a signal often correlated with heightened volatility and potential downside risk.
Adding to the intrigue, Ether recently broke out against Bitcoin, rallying by nearly 5% on Monday. While this has brought short-term optimism into the market, analysts caution that a true trend reversal will only be confirmed if ETH can flip the critical $4,700 level into long-term support.
This article explores these pivotal developments, the risks and opportunities they present, and why Ethereum remains at the center of both financial innovation and speculative fervor.
________________________________________
1. Binance Leverage Ratio Soars to Record Levels: What It Means for Ethereum
Understanding the Binance Leverage Ratio
The Binance Estimated Leverage Ratio (ELR) is a key metric that tracks the amount of open interest in derivatives relative to the reserves of the underlying asset—in this case, ETH—on the Binance exchange. A rising ELR indicates that traders are increasingly using borrowed funds (leverage) to speculate on price movements.
As of late August 2025, the ELR for Ethereum has skyrocketed to its highest level ever recorded, surpassing previous peaks from 2021 and 2022. This means that a higher percentage of Ethereum trading on Binance is being conducted with leverage, raising the stakes for both bulls and bears.
Risks of Elevated Leverage
High leverage can act as a double-edged sword:
• Volatility Amplification: Leveraged positions can exaggerate price swings. A modest move in ETH price can trigger liquidations, leading to cascading effects.
• Greater Liquidation Risk: With more traders overexposed, sudden price drops can result in mass liquidations, accelerating downward momentum.
• Market Fragility: The market becomes more vulnerable to external shocks—regulatory changes, macroeconomic data, or unexpected news events can have outsized impacts.
Historical Precedents
When the ELR reached similarly elevated levels in May 2021 and November 2022, Ethereum experienced sharp corrections shortly thereafter. These historical patterns suggest that the current surge in leverage could be a warning sign for a potential pullback—especially if ETH fails to hold critical technical levels in the coming days.
________________________________________
2. Ether Breaks Out Against Bitcoin: A Key Technical Signal
While leverage-related risk looms large, Ethereum has shown notable strength against Bitcoin in recent trading sessions. On Monday, Ether rallied nearly 5%, breaking out of a multi-month consolidation pattern against BTC. This has sparked renewed interest in whether ETH is poised to outperform Bitcoin in the near term.
ETH/BTC Breakout: A Bullish Reversal?
The ETH/BTC ratio is often used by traders to assess relative strength. A breakout in this pair suggests that Ethereum is gaining ground in terms of market dominance and investor interest.
Technical analysts point out that the ETH/BTC pair recently broke above a descending trendline that had been in place since early 2024. This move is being interpreted by many as a bullish reversal — a signal that Ethereum might be ready to lead the next leg of the crypto bull market.
The $4,700 Level: A Make-or-Break Resistance
Despite the excitement, the rally’s sustainability hinges on one key resistance level: $4,700. Ethereum previously tested this level in early 2024 but failed to break through decisively. Flipping this level into support is crucial for validating the current uptrend.
• Short-Term Bull Case: If ETH consolidates above $4,700, it could open the door to a retest of the all-time high around $4,870 and potentially push toward the psychologically significant $5,000 mark.
• Bearish Scenario: If ETH fails to hold $4,700 and falls back below, it could trigger another round of liquidations, especially given the high leverage environment.
•
With the Ethereum market teetering on a technical knife-edge, all eyes are now on price action around this critical level.
________________________________________
3. Despite Volatility, Ethereum Is Cementing Its Role as the Backbone of AI-Powered Finance
While short-term risks dominate headlines, Ethereum is quietly laying the foundation for the next generation of decentralized, AI-powered financial systems. The convergence of blockchain and artificial intelligence (AI) is rapidly evolving, and Ethereum is emerging as the preferred platform for this fusion.
Why Ethereum?
Ethereum’s core strengths make it uniquely suited to become the infrastructure layer for AI-integrated finance:
• Smart Contract Flexibility: Ethereum’s programmable contracts allow developers to build complex autonomous systems that interact with external data.
• Network Effects: With the largest developer community in Web3, Ethereum benefits from continual innovation and support.
• Layer-2 Scaling: Rollups and other Layer-2 solutions (e.g., Arbitrum, Optimism) enable Ethereum to handle greater transaction throughput, crucial for AI applications that require real-time data processing.
•
Key Use Cases for AI on Ethereum
1. Autonomous Financial Agents
Smart contracts can be paired with AI agents to create self-governing financial bots that execute trades, manage portfolios, or optimize yield strategies in DeFi protocols. These agents can adapt to market conditions faster than human traders, offering a competitive edge.
2. Decentralized AI Marketplaces
Ethereum-based platforms like Ocean Protocol and SingularityNET allow users to buy, sell, or license AI models and data sets. These marketplaces are democratizing access to AI, enabling developers and researchers to monetize their work without intermediaries.
3. On-Chain AI Inference
Projects are now exploring how to run AI inference—the process of making predictions from trained models—directly on-chain or via decentralized compute networks. This allows for truly censorship-resistant and transparent AI decision-making in areas like lending risk assessment and insurance underwriting.
4. AI-Powered Oracles
Oracles such as Chainlink are integrating AI to enhance the reliability and relevance of off-chain data delivered to smart contracts. This enables more accurate, real-time inputs into DeFi protocols, insurance contracts, and prediction markets.
________________________________________
4. Institutional Interest & Regulatory Clarity Fuel Ethereum’s Growth
Beyond technological innovation, Ethereum is also benefiting from increased institutional interest and a clearer regulatory environment in key markets.
Spot ETH ETFs Drive Demand
The approval of spot Ethereum ETFs in several jurisdictions — including the U.S., Europe, and Asia — has contributed to a surge in institutional demand. These financial products allow traditional investors to gain exposure to ETH without dealing with wallets or private keys.
In the months following ETF approvals, Ethereum saw:
• A sharp increase in institutional inflows.
• Greater liquidity and reduced volatility.
• Renewed bullish sentiment among long-term holders.
Regulatory Clarity Emerges
Regulatory bodies have begun to differentiate Ethereum from other crypto assets, often classifying it as a commodity rather than a security. This distinction has major implications for how ETH is treated under financial regulations, and further cements its status as a legitimate and investable asset.
________________________________________
5. What Comes Next: Scenarios to Watch
Bullish Scenario
If Ethereum can maintain momentum and flip $4,700 into support in the coming days, the path to new all-time highs becomes much clearer.
• Key Price Levels: After $4,700, the next resistance is at the 2021 all-time high of $4,870. Beyond that, price discovery could push ETH toward $5,200–$5,500.
• Narrative Boost: A growing narrative around AI + DeFi convergence could bring a fresh wave of speculative interest and developer activity to the Ethereum ecosystem.
Bearish Scenario
However, if ETH fails to hold $4,700 and the high leverage ratio on Binance triggers a liquidation cascade, a retracement to $4,300 or even $4,000 is possible in the short term.
• Market Sentiment: Leverage unwinding could lead to panic selling, particularly among retail traders.
• Macro Risk: Any unfavorable macro developments (e.g., interest rate hikes, geopolitical tensions) could exacerbate the downtrend.
________________________________________
Conclusion: Ethereum at a Crossroads
Ethereum stands at a crossroads — balancing short-term price volatility against immense long-term potential. The record-high leverage ratio on Binance is a flashing warning sign for traders, suggesting the possibility of a pullback in the face of overheated speculative behavior.
Yet beneath the surface, Ethereum is evolving into the foundational layer of AI-powered, decentralized finance. As smart contracts become smarter and more autonomous, Ethereum’s role as the infrastructure for intelligent financial systems is becoming increasingly clear.
The recent 5% rally and breakout against Bitcoin signal optimism, but all eyes are now on $4,700. If this critical level becomes support, Ethereum could be poised for a breakout that finally fulfills its promise — not just as a digital asset, but as the backbone of an entirely new financial era.
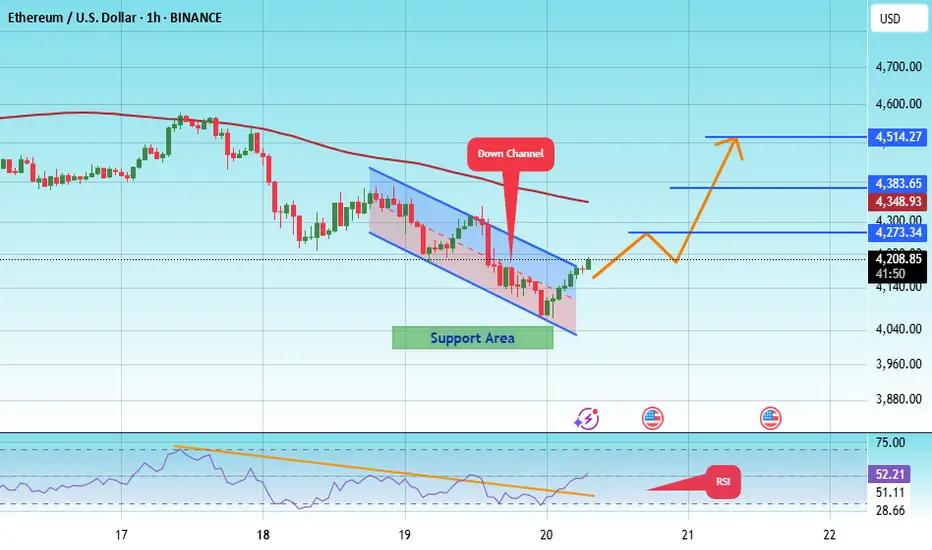
#ETH/USDT#ETH
The price is moving within a descending channel on the 1-hour frame and is expected to break and continue upward.
We have a trend to stabilize above the 100 moving average once again.
We have a downtrend on the RSI indicator that supports the upward move with a breakout.
We have a support area at the lower boundary of the channel at 4300, acting as strong support from which the price can rebound.
We have a major support area in green that pushed the price upward at 4330.
Entry price: 4544.
First target: 4646.
Second target: 4830.
Third target: 4995.
To manage risk, don't forget stop loss and capital management.
When you reach the first target, save some profits and then change your stop order to an entry order.
For inquiries, please comment.
Thank you.

Alt season time (PART 1)Hello friends
Well, the question that has come up a lot for you these days is the alt season or its beginning.
Well, you see the Ethereum dominance chart that the candle closed well on the weekly time frame, but on the daily time frame, if the price holds the 14.20 area and the 14.85 resistance is broken well and validly, we will go for the higher numbers that we have specified, and in this case we will see good growth of altcoins.
If the price falls and the support at 14.20 is broken, we will see a drop in the price of Ethereum as well as altcoins, so these next few days are very important.
*Trade safely with us*

#ETH/USDT Breaks Below Recent Triangle Structure !#ETH
The price is moving within an ascending channel on the 1-hour frame, adhering well to it, and is on track to break it strongly upwards and retest it.
We have support from the lower boundary of the ascending channel, at 4040.
We have a downtrend on the RSI indicator that is about to break and retest, supporting the upside.
There is a major support area in green at 4000, which represents a strong basis for the upside.
Don't forget a simple thing: ease and capital.
When you reach the first target, save some money and then change your stop-loss order to an entry order.
For inquiries, please leave a comment.
We have a trend to hold above the 100 Moving Average.
Entry price: 4203.
First target: 4273.
Second target: 4383.
Third target: 4514.
Don't forget a simple thing: ease and capital.
When you reach the first target, save some money and then change your stop-loss order to an entry order.
For inquiries, please leave a comment.
Thank you.
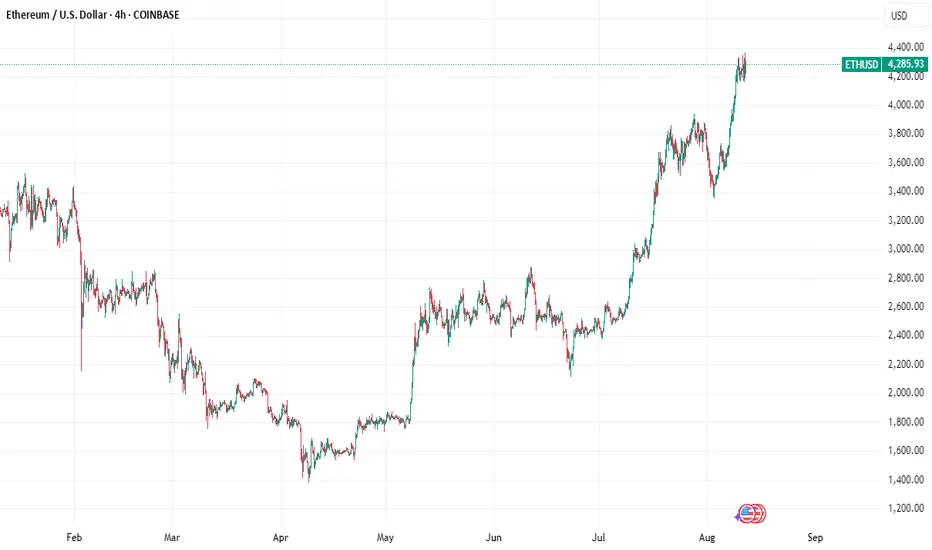
ETHUSDTBINANCE:ETHUSDT is overall trend in the 4-hour timeframe is bullish, with strong buying momentum. The price is currently at the 4200 USD resistance, and if this level breaks, the next target will be around 4500 USD.
Supports:3950 USD, 3730 USD, 3350 USD
Resistances: 4200 USD, 4500 USD
⚠️Always apply proper risk management.

#ETH/USDT Long after pull-back #ETH
The price is moving within a descending channel on the 1-hour frame and is expected to break and continue upward.
We have a trend to stabilize above the 100 moving average once again.
We have a downtrend on the RSI indicator that supports the upward move with a breakout.
We have a support area at the lower limit of the channel at 4465, acting as strong support from which the price can rebound.
We have a major support area in green that pushed the price upward at 4400.
Entry price: 4530.
First target: 4666.
Second target: 4797.
Third target: 4992.
To manage risk, don't forget stop loss and capital management.
When you reach the first target, save some profits and then change your stop order to an entry order.
For inquiries, please comment.
Thank you.

Ethereum Flips MasterCard: Is $5,000 ETH Next?A new era is dawning for Ethereum, the world's second-largest cryptocurrency. In a stunning display of market strength, Ethereum has not only surpassed the market capitalization of financial giant Mastercard but is also setting its sights on the ambitious $5,000 price target. This powerful rally, which saw Ethereum gain an impressive 45% in a single month, is fueled by a potent combination of surging institutional investment, increasing regulatory clarity, and significant buying pressure from large-scale investors, colloquially known as "whales." However, this bullish narrative is not without its counterpoints, as short-term leverage risks and a sense of caution in the options market present potential hurdles on the path to new all-time highs.
A New King in the Asset Rankings: Ethereum Flips Mastercard
In a landmark moment for the cryptocurrency space, Ethereum's market capitalization soared to over $519 billion in August 2025, eclipsing that of the global payments behemoth, Mastercard. This achievement propelled Ethereum to the 22nd spot among the world's largest assets, placing it ahead of household names like Netflix, Exxon Mobil, Costco, and Johnson & Johnson. The surge was the result of a consistent upward trend, with Ethereum's price climbing nearly 7% in a single day to hit $4,300, capping a 21% rise over several weeks.
This "flippening" of a traditional financial institution has ignited fresh debate about the long-term potential of decentralized assets. The 24/7 nature of cryptocurrency markets provides a distinct advantage, allowing for continuous trading and accumulation of buying momentum, even when traditional stock markets are closed. While Bitcoin still holds a commanding lead with a market capitalization of $2.36 trillion, Ethereum's consistent gains since July 2025 have kept the conversation alive about its potential to one day challenge the top spot.
The Road to $5,000: A Rally Fueled by Whales and Regulatory Tailwinds
The drive towards the psychologically significant $5,000 mark is being underpinned by several powerful forces. A staggering 45% monthly gain has brought this target within reach, with analysts pointing to a confluence of bullish factors.
One of the primary drivers is the unprecedented level of accumulation by "whales." In a single week, these large-scale investors accumulated an astounding $946.6 million worth of Ethereum. This aggressive buying is not limited to individual investors. A mysterious institution was reported to have acquired 221,166 ETH, worth nearly $1 billion, in a single week, signaling strong long-term confidence even at elevated prices. This whale activity is significant as it reduces the available supply of ETH on exchanges, creating a supply squeeze that can amplify price movements.
Adding to this momentum is the growing clarity in the regulatory landscape, particularly in the United States. Recent developments, including the White House's new digital asset framework and a resolution in the Ripple-SEC case, have helped to remove key uncertainties that have long plagued the crypto market. This improved regulatory environment is fostering greater trust and encouraging institutional adoption. The introduction of tax-advantaged structures, such as IRS Code 351, which allows for tax-free exchanges of Ethereum for treasury shares, is further incentivizing large-scale purchases by long-term holders.
The Rise of Corporate Ethereum and ETF Inflows
A significant and growing trend is the increasing allocation of corporate treasuries to Ethereum. As of August 2025, corporate Ether holdings have surged to an impressive $13 billion, with the total amount held by companies reaching 3.04 million ETH. This rally in corporate adoption is being led by firms like BitMine Immersion Technologies, SharpLink Gaming, and The Ether Machine.
BitMine Immersion Technologies, in particular, has made headlines by becoming the first company to hold more than $3 billion in ETH, having increased its holdings by a staggering 410.68% in just 30 days to 833,100 ETH. SharpLink Gaming and The Ether Machine have also significantly boosted their ETH treasuries, with the top ten corporate holders now controlling over 2.63 million ETH, representing about 2.63% of the asset's total supply.
This corporate buying spree is mirrored by the substantial inflows into spot Ethereum Exchange-Traded Funds (ETFs). In a single day, ETH ETFs saw inflows of $533.8 million, with cumulative inflows since July 2024 topping $8.9 billion. These sustained ETF inflows, coupled with the growth of corporate reserves, are seen as a powerful combination that could position ETH to outperform and challenge the $5,000 level for the first time.
A Time to Sell? Market Cycles and Exit Strategies
While the current sentiment is overwhelmingly bullish, some analysts are sounding a note of caution, suggesting that the current rally may have an expiration date. Drawing on well-known market cycle cheat sheets, some traders are pointing to the current phase as one of "Optimism" and "Ethereum dominance," which they believe will eventually lead to a "Market Peak/Euphoria" phase.
According to one such analysis by a crypto trader, this peak could be reached by the end of October 2025, at which point the market may experience extreme overvaluation and a subsequent downturn. This perspective suggests that while there may still be room for significant upside, with short-term targets ranging from $5,800 to $6,000, a strategic exit plan is crucial. This view is not universally held, with other technical analyses projecting targets as high as $12,000 based on patterns similar to Bitcoin's 2020 rally.
The Clash of Fundamentals and Short-Term Risks
Despite the strong bullish fundamentals, there are short-term risks that could temper the rally. One of the primary concerns is the high level of leverage in the market. The all-exchange Estimated Leverage Ratio (ELR) has climbed to 0.68, approaching historical highs and signaling excessive speculative activity. While this indicates a high degree of confidence, it also increases the risk of cascading liquidations in the event of a price correction.
The Ethereum options market also reflects a degree of caution. Despite the 41% rally in a month, derivatives data shows that traders have yet to turn decisively bullish. The options delta skew, a measure of the relative demand for bullish versus bearish options, remains in neutral territory. This suggests that while professional traders are not anticipating a significant price drop, they are also not exhibiting the "euphoria" that often accompanies major market tops. This lack of euphoria in the options market could be interpreted in two ways: either as a sign of a healthy, sustainable rally or as an indication that there isn't enough conviction to push the price significantly higher in the immediate future.
Conclusion: A Bullish Trajectory Tempered by Prudence
Ethereum's recent performance has been nothing short of remarkable. The cryptocurrency has not only achieved a significant milestone by surpassing Mastercard in market capitalization but has also laid a strong foundation for a potential run to $5,000 and beyond. The confluence of strong institutional demand, growing corporate adoption, and increasing regulatory clarity paints a decidedly bullish picture for the long term.
However, the path forward is unlikely to be a straight line. The risks associated with high leverage in the short term, coupled with a sense of caution in the options market, serve as important reminders that volatility remains a key characteristic of the crypto space. While the fundamental drivers suggest that Ethereum is well-positioned for continued growth, investors and market participants would be wise to remain vigilant and mindful of the potential for pullbacks. The coming months will be crucial in determining whether Ethereum can sustain its current momentum and solidify its position not just as a leading cryptocurrency, but as a global financial asset of the future.
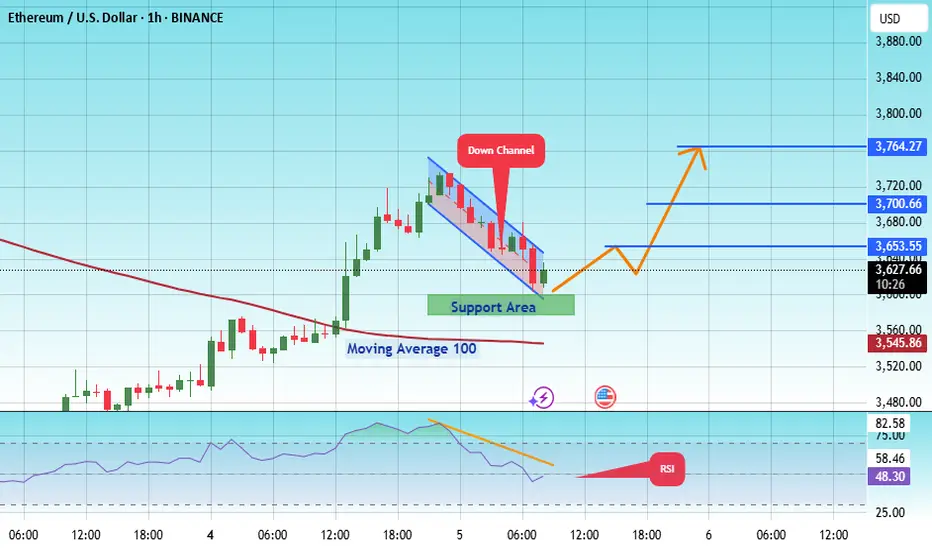
#ETH/USDT : Price is going as expected in previous ideas on eth#ETH
The price is moving within an ascending channel on the 1-hour frame, adhering well to it, and is on track to break it strongly upwards and retest it.
We have support from the lower boundary of the ascending channel, at 3593.
We have a downtrend on the RSI indicator that is about to break and retest, supporting the upside.
There is a major support area in green at 3582, which represents a strong basis for the upside.
Don't forget a simple thing: ease and capital.
When you reach the first target, save some money and then change your stop-loss order to an entry order.
For inquiries, please leave a comment.
We have a trend to hold above the 100 Moving Average.
Entry price: 3626.
First target: 3653.
Second target: 3700.
Third target: 3764.
Don't forget a simple thing: ease and capital.
When you reach your first target, save some money and then change your stop-loss order to an entry order.
For inquiries, please leave a comment.
Thank you.
ETHUSDT.PIf you look at the chart, you will notice an uptrend that has somewhat lost its strength and we may not be able to hit higher highs like the next strength in the next move.
Support: 3.660 - 3.590 - 3.160
Resistance: 3.900 - 4.260
Entry: 3.700
SL: 3.500
TP: 4.240
Please control risk management.⚠️

#ETH/USDT SETUP ,Bought From $4003#ETH
The price is moving within an ascending channel on the 1-hour frame, adhering well to it, and is on track to break it strongly upwards and retest it.
We have support from the lower boundary of the ascending channel, at 3700.
We have a downtrend on the RSI indicator that is about to break and retest, supporting the upside.
There is a major support area in green at 3711, which represents a strong basis for the upside.
Don't forget a simple thing: ease and capital.
When you reach the first target, save some money and then change your stop-loss order to an entry order.
For inquiries, please leave a comment.
We have a trend to hold above the 100 Moving Average.
Entry price: 3811.
First target: 3867.
Second target: 3936.
Third target: 4003.
Don't forget a simple thing: ease and capital.
When you reach your first target, save some money and then change your stop-loss order to an entry order.
For inquiries, please leave a comment.
Thank you.

#ETH/USDT SETUP ,Bought From $3696#ETH
The price is moving within a descending channel on the 1-hour frame, adhering well to it, and is on its way to breaking strongly upwards and retesting it.
We have support from the lower boundary of the descending channel at 3640.
We have a downtrend on the RSI indicator that is about to be broken and retested, supporting the upside.
There is a major support area in green at 3600, which represents a strong basis for the upside.
Don't forget a simple thing: ease and capital.
When you reach the first target, save some money and then change your stop-loss order to an entry order.
For inquiries, please leave a comment.
We have a trend to hold above the Moving Average 100.
Entry price: 3696.
First target: 3764.
Second target: 3826.
Third target: 3904.
Don't forget a simple thing: ease and capital.
When you reach your first target, save some money and then change your stop-loss order to an entry order.
For inquiries, please leave a comment.
Thank you.

ETHUSDT | Two Opportunities. One Smart Approach.I’ve been closely watching how buyers behave under the green line — and they’re clearly not backing down. But what really catches my eye is the blue box , a clean demand zone I’ve seen act as a launchpad in the past.
You don’t need to jump in blindly.
Depending on your risk appetite, both levels are valid. But if you wait for a 15-minute breakout confirmation on the low timeframe before acting on either, your odds of success increase significantly.
This is how I keep my win rate high, waiting for the market to prove itself first.
“I will not insist on my short idea. If the levels suddenly break upwards and do not give a downward break in the low time frame, I will not evaluate it. If they break upwards with volume and give a retest, I will look long.”
Most traders rush in. You wait smart. That’s the edge.
Choose wisely. Follow closely.
📌I keep my charts clean and simple because I believe clarity leads to better decisions.
📌My approach is built on years of experience and a solid track record. I don’t claim to know it all but I’m confident in my ability to spot high-probability setups.
📌If you would like to learn how to use the heatmap, cumulative volume delta and volume footprint techniques that I use below to determine very accurate demand regions, you can send me a private message. I help anyone who wants it completely free of charge.
🔑I have a long list of my proven technique below:
🎯 ZENUSDT.P: Patience & Profitability | %230 Reaction from the Sniper Entry
🐶 DOGEUSDT.P: Next Move
🎨 RENDERUSDT.P: Opportunity of the Month
💎 ETHUSDT.P: Where to Retrace
🟢 BNBUSDT.P: Potential Surge
📊 BTC Dominance: Reaction Zone
🌊 WAVESUSDT.P: Demand Zone Potential
🟣 UNIUSDT.P: Long-Term Trade
🔵 XRPUSDT.P: Entry Zones
🔗 LINKUSDT.P: Follow The River
📈 BTCUSDT.P: Two Key Demand Zones
🟩 POLUSDT: Bullish Momentum
🌟 PENDLEUSDT.P: Where Opportunity Meets Precision
🔥 BTCUSDT.P: Liquidation of Highly Leveraged Longs
🌊 SOLUSDT.P: SOL's Dip - Your Opportunity
🐸 1000PEPEUSDT.P: Prime Bounce Zone Unlocked
🚀 ETHUSDT.P: Set to Explode - Don't Miss This Game Changer
🤖 IQUSDT: Smart Plan
⚡️ PONDUSDT: A Trade Not Taken Is Better Than a Losing One
💼 STMXUSDT: 2 Buying Areas
🐢 TURBOUSDT: Buy Zones and Buyer Presence
🌍 ICPUSDT.P: Massive Upside Potential | Check the Trade Update For Seeing Results
🟠 IDEXUSDT: Spot Buy Area | %26 Profit if You Trade with MSB
📌 USUALUSDT: Buyers Are Active + %70 Profit in Total
🌟 FORTHUSDT: Sniper Entry +%26 Reaction
🐳 QKCUSDT: Sniper Entry +%57 Reaction
📊 BTC.D: Retest of Key Area Highly Likely
📊 XNOUSDT %80 Reaction with a Simple Blue Box!
📊 BELUSDT Amazing %120 Reaction!
📊 Simple Red Box, Extraordinary Results
I stopped adding to the list because it's kinda tiring to add 5-10 charts in every move but you can check my profile and see that it goes on..

ETHUSDTThis movement downtrend. If breake 2.790 movr to 3.500$ but breke 2.200 move trend to 1.500$.

ETHUSDT minor trendsEthereum BINANCE:ETHUSDT is downtrend with lower highs from the bottom is nearly finished 📉 . For a stronger rise, it needs to stabilize above $2500 ⚡. Mid-term targets are $3300 (end of second leg) and $3700 (major resistance) 🎯. Key supports are $2500, $2070, $1800, and $1550, the base where the uptrend began 🛡️.
Supports & Resistances:
Supports: \$2500, \$2070, \$1800, \$1550
Resistances: \$2500 (critical level), \$3300, \$3700

Ethereum Price Rejects $3K: Is A Deeper Correction Ahead?Ethereum's Precarious Perch: Price Stumbles at $3K as Long-Term Conviction and Quantum Threats Collide
The cryptocurrency community is intently watching Ethereum as the premier smart contract platform engages in a fierce battle around the psychologically crucial $3,000 mark. Following a promising surge that breached this barrier for the first time in several months, the upward momentum has stalled, giving way to a tense period of consolidation. This raises a pivotal question for investors and market observers alike: is a more significant correction on the horizon, or is this merely a strategic pause before the next major advance toward $3,200 and potentially higher valuations?
The recent price action has been a whirlwind for traders. Ethereum climbed with bullish determination, reaching heights near $3,080 before encountering substantial selling pressure that forced a retreat. This downturn has left the price hovering near the $2,940 level, trading precariously near its 100-hourly Simple Moving Average (SMA). Exacerbating the bearish sentiment, the price has broken below a key bullish trend line that had previously offered support at the $2,980 mark, a technical development that often signals the potential for further declines.
This short-term market turbulence, however, unfolds within a much broader and more intricate narrative. While hourly charts may be flashing warning signs, an analysis of long-term on-chain data reveals a story of strengthening fundamentals, underscored by a record amount of Ethereum being locked away by confident, long-term holders. In parallel, the Ethereum developer community, with co-founder Vitalik Buterin at the forefront, is proactively strategizing for a distant yet potentially existential threat: the "Quantum Apocalypse." This unique convergence of immediate bearish technical indicators, profound long-term bullish sentiment, and forward-thinking security planning creates a fascinating and unpredictable landscape for the pioneering blockchain platform.
The Short-Term Tug-of-War: A Correction Towards $2,900 or a Rally to $3,200?
In the immediate term, the market is a battlefield of competing forces. The inability to sustain a position above the $3,000 level has emboldened sellers, and key technical indicators are suggesting a cautious approach. The hourly MACD (Moving Average Convergence Divergence) is indicating a loss of momentum within the bullish zone, while the RSI (Relative Strength Index) has fallen below the 50 mark, suggesting that selling pressure could be gaining the upper hand.
Market analysts are now laser-focused on the $2,900 zone, viewing it as the primary line of defense for the bulls. If this support level can withstand the selling pressure, it could provide the necessary foundation for a fresh increase, enabling Ethereum to reclaim its lost ground and launch another attempt to conquer the $3,000 resistance. Conversely, a decisive break below this critical support could initiate a more substantial correction. In such a scenario, subsequent support targets would likely be found near $2,800, with the potential for further drops to the $2,720 or even $2,650 price points.
A particularly compelling theory circulating among analysts involves the concept of a "liquidity sweep." On-chain data indicates a significant concentration of liquidity—essentially, a large cluster of buy orders and stop-loss orders—residing just below the $2,900 level. Market dynamics frequently see price action gravitate toward these zones to trigger liquidations, effectively shaking out over-leveraged traders before a more sustained move in the opposite direction. Consequently, a brief dip below $2,900 to "grab" this liquidity would not be an unexpected development. Paradoxically, such a move could be the very catalyst required to fuel a durable rally toward the next major target: the $3,200 supply zone. This level is widely regarded as the next significant hurdle, a price ceiling where a large volume of sell orders is anticipated to be waiting.
The volatility surrounding key psychological levels like $3,000 is notoriously difficult to predict, as human emotions of fear and greed often drive exaggerated market reactions. For the time being, the short-term outlook remains uncertain, heavily contingent on whether the crucial $2,900 support can absorb the selling pressure or if a flush-out of liquidity is needed before the bulls can confidently reassert control.
The Bullish Undercurrent: Smart Money's Long Game and a Shrinking Supply
Looking beyond the volatile daily price charts reveals a powerful undercurrent of bullish conviction. A key metric that speaks volumes about long-term investor sentiment is the quantity of Ethereum locked in staking contracts, which has recently soared to a new all-time high.
Recent on-chain data indicates that nearly 30% of Ethereum's total supply is now staked on the network. As of mid-2025, more than 35 million ETH have been committed to validator nodes, a process that helps secure the network while allowing stakers to earn passive income. This trend, which has seen a notable acceleration in recent months, serves as a powerful indicator of long-term confidence. When investors, particularly large holders often referred to as "whales," stake their ETH, they are effectively removing it from the liquid, tradable supply. This reduction in available supply, frequently described as a "supply shock," means that any future increase in demand can have a more pronounced positive effect on the asset's price.
This staking activity is widely interpreted as "smart money" placing a long-term bet on Ethereum's continued growth and success. These are not day traders reacting to minor price swings but rather institutional investors and seasoned crypto participants who are focused on the bigger picture. Their actions signal a deep-seated belief that the intrinsic value of the Ethereum network—as the foundational layer for decentralized finance (DeFi), non-fungible tokens (NFTs), and a vast ecosystem of other applications—will continue to appreciate over time. This accumulation is not limited to staking; the number of wallets with no history of selling has also reached a record high, collectively holding over 22.8 million ETH.
This expanding pool of illiquid supply, driven by a firm belief in Ethereum's fundamental value proposition and its future roadmap, provides a strong counter-narrative to the short-term bearish technicals. It suggests that while the price may experience turbulence in the near term, a substantial and growing cohort of investors is prepared to hold through the volatility, thereby creating a solid foundation for future price appreciation.
The Existential Question: Can Ethereum Outsmart a Quantum Apocalypse?
While traders and short-term investors grapple with hourly charts and staking metrics, Ethereum's core developers are concentrating on a threat that is far more distant but infinitely more profound: the advent of quantum computing. The "Quantum Apocalypse" is a term used to describe the hypothetical future event—often called "Q-Day"—when a quantum computer becomes powerful enough to break the cryptographic algorithms that secure virtually all of our modern digital infrastructure. This includes blockchain networks like Ethereum and Bitcoin.
Such a powerful machine could, in theory, reverse-engineer a user's private key from their public key, which would grant an attacker complete and unfettered control over their digital assets. For a multi-billion dollar ecosystem built on the unwavering promise of cryptographic security, this represents an existential threat of the highest order.
However, the leadership within the Ethereum ecosystem, including co-founder Vitalik Buterin and the Ethereum Foundation, is not idly waiting for this threat to materialize. They are actively and transparently working to make the network quantum-resistant. Buterin has publicly addressed the issue, noting that prediction markets currently forecast the arrival of a cryptographically relevant quantum computer sometime between 2030 and 2035. This timeline provides a crucial window for the network to transition its security protocols to a more robust standard.
The strategy to neutralize this threat is multifaceted and is a core component of Ethereum's long-term development roadmap. Key initiatives include:
• Post-Quantum Cryptography: Researchers are diligently developing and testing new types of signature schemes that are designed to be resistant to attacks from both classical and quantum computers. Two of the most promising approaches are STARKs (Scalable Transparent Arguments of Knowledge) and lattice-based cryptography. STARKs, for instance, would allow users to prove ownership of their assets without ever exposing their private keys.
• The "Lean Ethereum" Roadmap: Buterin and fellow researcher Justin Drake have put forth a vision for a "Lean Ethereum" that aims to simplify the blockchain's base layer. This simplification would not only make the protocol easier to audit and secure but would also facilitate the integration of post-quantum-ready signatures and other advanced defensive measures.
• Emergency Hard Forks: In a worst-case scenario where a quantum threat emerges much sooner than anticipated, Buterin has suggested that an emergency hard fork could be deployed as a final line of defense. This would involve a network-wide upgrade where all users would be required to migrate their funds to new, quantum-resistant "smart" wallets, thereby rendering the old, vulnerable accounts obsolete.
Buterin remains cautiously optimistic about the network's ability to navigate this challenge. The proactive stance, the commitment to public and transparent research, and the multi-layered defense strategy all demonstrate a deep commitment to ensuring Ethereum's security for decades to come. This effort aims to transform a potential apocalypse into a manageable, albeit complex, technological evolution.
Conclusion: A Market at a Crossroads
Ethereum currently stands at a fascinating crossroads, a point where short-term technical uncertainty is juxtaposed with immense long-term fundamental strength and remarkable foresight. The immediate price action is a toss-up, delicately balanced on the crucial $2,900 support level. A sustained dip below this line could send prices into a corrective wave toward $2,800 or lower, possibly to sweep liquidity before a stronger and more convincing rebound. Conversely, if this support holds firm, it could empower the bulls to decisively conquer the $3,000 barrier and set their sights on the formidable $3,200 resistance zone.
When one zooms out from the daily noise, the picture becomes clearer and decidedly more bullish. The record-breaking amount of ETH locked in staking contracts paints a portrait of unwavering long-term conviction from sophisticated investors who are systematically reducing the available supply while simultaneously strengthening the network's security. This patient accumulation provides a powerful buffer against short-term market panic.
Looking even further into the future, Ethereum's leadership is already waging a quiet war against the quantum threat, meticulously laying the groundwork for a post-quantum world. This long-range planning, while not a direct factor in today's price movements, underpins the network's potential for longevity and resilience.
For the investor, the current dilemma—a rally to $3,200 or a pullback first?—is largely a matter of time horizon. The path of least resistance in the coming days and weeks remains ambiguous, clouded by liquidation levels and psychological barriers. But for those with a longer view, the on-chain data and the forward-thinking roadmap strongly suggest that Ethereum is not just building for the next bull run, but for the next generation of the internet. The current price turbulence, while unsettling, may ultimately be remembered as a minor tremor before a much more significant structural shift in value.
ETHUSDTThis is very easy...
best support level 2300 to 2500 for jump price. but was needed for jump price for get enrgy for movement to high levels by fake breakout.
First level of resistance 2800 to 3000.
⚠️Control Money Management in your capital.

ETHUSDT Swing Trade AnalysisEth still struggling to break weekly bearish fvg, rather it's bullish or bearish, it must revisit the orange line which is daily bearish fvg, if it taps this and drops then a good sign , if it doesn't tap this and drops then it's a bad sign for eth, 3rd scenario is if we get any 4hr closing above the green line then I will not take the short and close short on the entry price, then I will short from the 3k area till 2.8k for scalp, if eth rejects from orange line 2583 then I will hold the trade till tp2. short only from the mention zone, if it doesn't tap the bearish fvg i will share another short trade with extended tps. remember that that yellow zone is important eth must retest it or break it to be bullish, without tapping this and drops then it's not a good sign for eth.

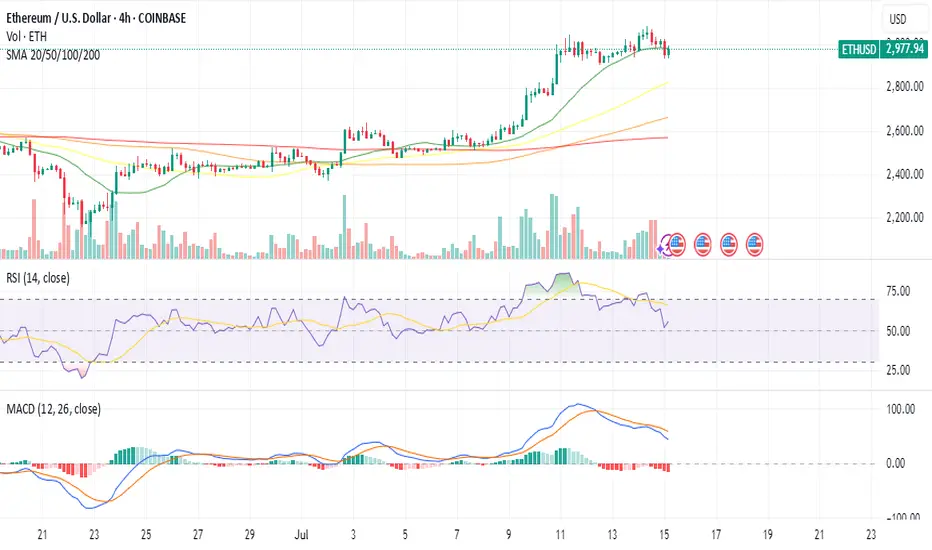
ETH/USDT#ETH
The price is moving within a descending channel on the 1-hour frame and is expected to break and continue upward.
We have a trend to stabilize above the 100 moving average once again.
We have a downtrend on the RSI indicator that supports the upward break.
We have a support area at the lower limit of the channel at 2440, acting as strong support from which the price can rebound.
We have a major support area in green that pushed the price upward at 2440.
Entry price: 2500.
First target: 2545.
Second target: 2539.
Third target: 2641.
To manage risk, don't forget stop loss and capital management.
When you reach the first target, save some profits and then change your stop order to an entry order.
For inquiries, please comment.
Thank you.

Navigating the ETH Volume Wall as Capital Rotates to High-Beta
In the intricate and often volatile theater of the cryptocurrency markets, Ethereum (ETH) currently finds itself in a moment of profound tension. As the undisputed king of smart contracts and the foundational layer for decentralized finance (DeFi), its price action sends ripples across the entire digital asset ecosystem. The current outlook presents a fascinating dichotomy: on one hand, Ethereum is staring down a formidable "volume wall," a dense zone of historical trading activity that acts as a powerful barrier to upward momentum. On the other hand, the tantalizing prospect of a decisive breakout above the key $2,900 level beckons, promising a new leg up for the bull market.
This standoff has created a fertile ground for a classic market phenomenon: capital rotation. As Ethereum grinds sideways, battling for every percentage point against heavy resistance, impatient capital is beginning to flow into more nimble, higher-risk assets within its orbit. Traders and investors are increasingly eyeing "cheap crypto"—smaller, more volatile altcoins built on or related to the Ethereum network. These "ETH beta" plays are rallying in anticipation of an eventual Ethereum breakout, offering the potential for outsized returns.
This comprehensive analysis will dissect the complex dynamics shaping Ethereum's current price outlook. We will explore the nature of the heavy volume wall that is capping its ascent and the strategic implications of the resulting price range. We will then delve into the mechanics of capital rotation, examining why traders are turning to lower-cap altcoins as a proxy for Ethereum's future success. Finally, we will weigh the bullish and bearish cases, charting the potential path to a $2,900 breakout while acknowledging the significant risks that could invalidate the optimistic thesis. For investors and market observers, understanding this intricate dance between consolidation, rotation, and breakout potential is paramount to navigating the next chapter in Ethereum's journey.
Part 1: The Great Wall of Ethereum - Deconstructing the Heavy Volume Range
To understand Ethereum's current struggle, one must first grasp the concept of a "volume wall." This is not a literal barrier, but a powerful technical and psychological construct visible on a price chart. It represents a price range where an unusually high volume of tokens has changed hands in the past. This area of high trading concentration becomes a major point of contention for future price movements, acting as a powerful magnet for both support and, in this case, resistance.
What is a Volume Wall and Why Does It Form?
A volume wall is best visualized using an indicator like the Volume Profile Visible Range (VPVR). Unlike traditional volume bars at the bottom of a chart that show volume per unit of time, the VPVR displays it horizontally, showing volume per price level. A large, protruding bar on the VPVR signifies a "High-Volume Node" (HVN), which is the technical term for a volume wall.
These walls form for several key psychological reasons:
1. Breakeven Sellers ("Bagholders"): A significant number of market participants may have bought ETH within this price range during a previous rally. When the price fell, they were left holding at a loss. Now, as the price returns to their entry point, their primary emotion is relief. Their goal is not to make a profit, but simply to exit their position at breakeven. This creates a steady stream of sell orders as the price enters the high-volume zone.
2. Strategic Profit-Takers: Investors who bought Ethereum at much lower prices see this high-volume area as a logical and predictable place to take profits. They recognize it as a zone of contention and potential reversal, making it an opportune moment to sell a portion of their holdings and de-risk.
3. Opportunistic Short-Sellers: Traders who are bearish on Ethereum view the volume wall as a high-probability area for the price to be rejected. They will strategically place short-sell orders within this range, adding to the selling pressure and betting on a move back down.
When these three forces converge, they create a formidable supply zone that can absorb a tremendous amount of buying pressure. For Ethereum to break through, it requires a catalyst strong enough to overwhelm this confluence of sellers.
Identifying Ethereum's Current Range
For the purpose of this analysis, let's assume this heavy volume wall for Ethereum is situated roughly between $2,750 and $2,850. This range becomes a battleground. When the price enters this zone, it often loses momentum and begins to move sideways in a "chop," characterized by volatile price swings without a clear direction.
The implications of being trapped below such a wall are significant. The market enters a state of consolidation or ranging. This means that for the time being, the explosive, directional trend is on pause. Bulls and bears are locked in a battle for control, and until one side emerges victorious, the price will likely remain contained. This period of consolidation, while frustrating for trend-followers, is a critical phase where the market digests previous gains, flushes out weak hands, and builds energy for its next major move. The key question for every trader is which direction that move will be.
Part 2: The Rotation Game - Chasing Beta in a Sideways Market
When a market leader like Ethereum enters a prolonged consolidation phase, a fascinating secondary effect begins to take hold: capital rotation. Traders and investors, particularly those with shorter time horizons, grow impatient with the lack of volatility in the primary asset. Their capital seeks higher returns and more immediate action, leading them to rotate out of the ranging asset and into more speculative plays. In the context of the crypto market, this often means moving into "high-beta" altcoins.
Understanding "ETH Beta"
In traditional finance, "beta" measures an asset's volatility in relation to a benchmark, like the S&P 500. An asset with a beta of 1.5 is expected to move 1.5% for every 1% move in the benchmark. In cryptocurrency, Ethereum itself often acts as a benchmark for the broader altcoin market.
"ETH beta" refers to altcoins that are highly correlated with Ethereum's price but exhibit much higher volatility. These are typically smaller, newer, or more speculative projects within Ethereum's ecosystem. The logic behind the "ETH beta play" is straightforward:
• If you believe Ethereum will eventually break through its resistance wall and rally, you can simply buy and hold ETH.
• However, if you want to maximize potential returns, you can instead buy a high-beta altcoin. The thesis is that when ETH finally moves up 10%, this smaller altcoin might surge 30%, 50%, or even more.
This strategy is essentially a leveraged bet on Ethereum's success, but without using financial leverage like futures or options. The leverage comes from the inherent volatility of the smaller asset.
The Allure of "Cheap Crypto"
The rotation often targets what is colloquially known as "cheap crypto." This term doesn't necessarily mean the project is undervalued, but rather that its token has a low unit price (e.g., under $1 or even fractions of a cent). This has a powerful psychological appeal:
• Accessibility: It feels more accessible to buy 1,000,000 tokens of a memecoin for $1,000 than to buy a fraction of one ETH.
• Perceived Upside: The low unit price creates the perception of explosive growth potential. It's psychologically easier to imagine a token going from $0.01 to $0.10 (a 10x return) than it is to imagine ETH going from $2,800 to $28,000.
During Ethereum's consolidation, we would likely see this rotation manifest in several key sectors of its ecosystem:
• Layer 2 Solutions: Projects like Arbitrum (ARB), Optimism (OP), and Polygon (MATIC) are prime candidates. They are fundamentally linked to Ethereum's scalability and success, making them a direct beta play. As traders anticipate an ETH breakout, they will front-run the move by accumulating these L2 tokens.
• DeFi Blue Chips and Dapps: Protocols for lending, borrowing, and trading, such as Uniswap (UNI), Aave (AAVE), or Lido (LDO), also fall into this category. Their usage and value are directly tied to the health of the Ethereum network.
• Memecoins and Newer Narratives: This is the highest-risk, highest-reward end of the spectrum. Memecoins built on Ethereum (like PEPE or SHIB) or on its Layer 2s can experience parabolic rallies based on pure speculation and social media hype, driven by the narrative that a rising ETH tide will lift all boats.
This rotation is a double-edged sword. While it signals underlying bullish conviction in the Ethereum ecosystem, it also diverts buying pressure away from ETH itself, potentially prolonging the consolidation phase. However, it is a clear sign that the market is positioning for an eventual breakout.
Part 3: The Bull Case - Charting a Path to the $2.9K Breakout
Despite the formidable resistance, a powerful bull case for Ethereum is building, suggesting that a breakout above the $2,900 level is not a matter of if, but when. This optimism is rooted in a combination of bullish technical patterns, strengthening on-chain fundamentals, and a powerful external narrative.
The Technical Setup for a Breakout
While the price may be moving sideways, a closer look at the chart often reveals underlying strength building beneath the surface. Several technical patterns and indicators could signal an impending breakout:
• Ascending Triangle Formation: A classic bullish pattern. This would be characterized by the price making a series of higher lows while being capped by the horizontal resistance of the volume wall (around $2,850-$2,900). The higher lows indicate that buyers are becoming more aggressive on each dip, squeezing the price upwards against the resistance. A breakout from the top of this triangle would be a powerful technical signal.
• Bullish Engulfing or Hammer Candlesticks: The appearance of strong bullish candlestick patterns at key support levels below the range would indicate that buyers are stepping in with force, absorbing selling pressure and defending the uptrend.
• Resetting Momentum Oscillators: During a consolidation phase, indicators like the Relative Strength Index (RSI) will cool off from "overbought" levels. If the RSI can reset back to neutral territory (around 50) while the price remains stable, it suggests the market is building up energy for another push higher without being overextended. A "hidden bullish divergence," where the price makes a higher low while the RSI makes a lower low, would be an even stronger signal of trend continuation.
• Support from Key Moving Averages: For the bull case to remain intact, Ethereum's price must hold above critical long-term moving averages, such as the 50-day and 200-day Simple Moving Averages (SMAs). These levels often act as dynamic support, and successful bounces from them reinforce the underlying bullish trend.
Fundamental and On-Chain Catalysts
Beyond the charts, Ethereum's fundamental health provides a strong tailwind for a potential rally:
• The Spot Ether ETF Narrative: The single most powerful potential catalyst on the horizon is the approval of a spot Ether ETF in the United States. Following the monumental success of the Bitcoin ETFs, the market anticipates that an Ether ETF would unlock a similar torrent of institutional capital. This narrative alone is enough to encourage accumulation, as investors look to position themselves ahead of a potential approval. Any positive news or regulatory progress on this front could provide the immense buying pressure needed to shatter the volume wall.
• Deflationary Supply Dynamics (The Burn): Thanks to the EIP-1559 upgrade, a portion of every transaction fee on Ethereum is "burned," or permanently removed from circulation. During periods of high network activity, this can make ETH a deflationary asset, meaning more coins are being destroyed than created. This programmatic scarcity is a powerful long-term value driver that makes holding ETH more attractive.
• The Growth of the Layer 2 Ecosystem: The success of Layer 2 solutions like Arbitrum and Optimism is not a threat to Ethereum but a testament to its success. These networks bundle transactions and settle them on the Ethereum mainnet, increasing its overall throughput and utility. A thriving L2 ecosystem drives demand for ETH as the ultimate settlement and data availability layer, strengthening its fundamental value proposition.
• Staking and Supply Sinks: A significant and growing portion of ETH's total supply is locked up in staking contracts to secure the network. This staked ETH is effectively removed from the liquid, circulating supply available for sale on exchanges. This continuous supply reduction creates a "supply shock" dynamic, where even a moderate increase in demand can have an outsized impact on the price.
When these technical and fundamental forces align, they create a powerful case that the consolidation phase is a temporary pause before the next major uptrend. A decisive break and close above $2,900 would liquidate short positions, trigger FOMO (Fear Of Missing Out) buying, and likely signal the start of a rapid move towards the next major psychological and technical target, potentially $3,500 or higher.
Part 4: The Bear Case and Prevailing Risks
A balanced analysis requires acknowledging the significant risks that could invalidate the bullish thesis. The volume wall is formidable for a reason, and a failure to break through could lead to a sharp reversal. Several factors could contribute to a bearish outcome for Ethereum.
Rejection at the Wall
The most immediate risk is a decisive rejection from the volume wall. If buying pressure wanes and sellers take firm control within the $2,750-$2,850 range, it could signal a local top. This would likely be confirmed by a break below the recent series of higher lows and key moving averages. Such a rejection could trigger a cascade of stop-loss orders from long positions, accelerating a move downwards to retest lower support levels, potentially in the $2,400-$2,500 range.
Macroeconomic Headwinds
As a major global asset, Ethereum is not immune to the broader macroeconomic environment. A "risk-off" sentiment sweeping through traditional markets would almost certainly impact crypto. Factors that could trigger this include:
• Hawkish Central Bank Policy: Unexpectedly high inflation data could force central banks like the Federal Reserve to maintain high interest rates for longer, or even signal further hikes. This "tight liquidity" environment is generally negative for risk assets like cryptocurrencies.
• Geopolitical Instability: An escalation of global conflicts can cause investors to flee to perceived safe havens like the US dollar or gold, pulling capital away from more speculative markets.
• Recessionary Fears: Signs of a weakening global economy could dampen investor appetite for risk, leading to broad-based selling across asset classes.
Regulatory Uncertainty
Regulatory risk remains a persistent cloud over the entire crypto industry, and Ethereum is at the center of a key debate. The U.S. Securities and Exchange Commission (SEC) has not definitively clarified whether it views ETH as a commodity (like Bitcoin) or a security. A negative ruling, or even prolonged legal battles suggesting it will be classified as a security, could have a chilling effect on the market. It would create significant compliance hurdles for exchanges and could derail the spot Ether ETF narrative entirely. Any negative headline on this front could be the catalyst that turns the volume wall from a temporary obstacle into an impenetrable ceiling.
Competitive Pressures
While Ethereum remains the dominant smart contract platform, it faces ever-growing competition from other Layer 1 blockchains (often dubbed "ETH Killers") like Solana, Avalanche, and others. These platforms boast high transaction speeds and low fees and are constantly vying for market share in the DeFi and NFT spaces. While a multi-chain future is the most likely outcome, a significant migration of developers and users away from Ethereum to a competitor could erode its network effect and negatively impact its long-term valuation.
Conclusion: A Pivotal Moment of Decision
Ethereum stands at a critical juncture, a crossroads where powerful bullish and bearish forces are locked in a tense equilibrium. The price is pinned against a heavy volume wall, a technical barrier representing the collective memory of the market. This has forced the asset into a period of consolidation, a sideways grind that is testing the patience of even the most steadfast bulls.
This very consolidation is fueling a secondary narrative of capital rotation, where traders, anticipating an eventual breakout, are channeling funds into higher-volatility "ETH beta" plays. The rallies in Layer 2 tokens and other ecosystem projects are a vote of confidence in Ethereum's future, a sign that the market is positioning for upside. The fundamental picture, bolstered by the potential of a spot ETF, deflationary supply mechanics, and a thriving ecosystem, provides a strong foundation for the bull case. The path to a $2,900 breakout seems not only possible but plausible.
However, the risks are undeniable. A failure to breach the wall could lead to a sharp correction, exacerbated by potential macroeconomic headwinds or negative regulatory surprises. The outcome of this battle will be pivotal. A successful breakout would reaffirm Ethereum's market leadership and likely kickstart a new wave of adoption and price appreciation across the entire altcoin space. A rejection would signal a deeper correction and a longer period of uncertainty. For now, the market holds its breath, watching the wall, waiting for the rotation to culminate, and anticipating the decisive move that will set the tone for the months to come.

Ethereum is still bullish!#ETH
The price is moving within a descending channel on the 30-minute frame and is expected to break and continue upward.
We have a trend to stabilize above the 100 moving average once again.
We have a downtrend on the RSI indicator that supports the upward move with a breakout.
We have a support area at the lower boundary of the channel at 2450, acting as strong support from which the price can rebound.
We have a major support area in green that pushed the price upward at 2400.
Entry price: 2460.
First target: 2485.
Second target: 2510.
Third target: 2543.
To manage risk, don't forget stop loss and capital management.
When you reach the first target, save some profits and then change your stop order to an entry order.
For inquiries, please comment.
Thank you.
