ETH/USDT Analysis -> towards upper levelsHello guys!
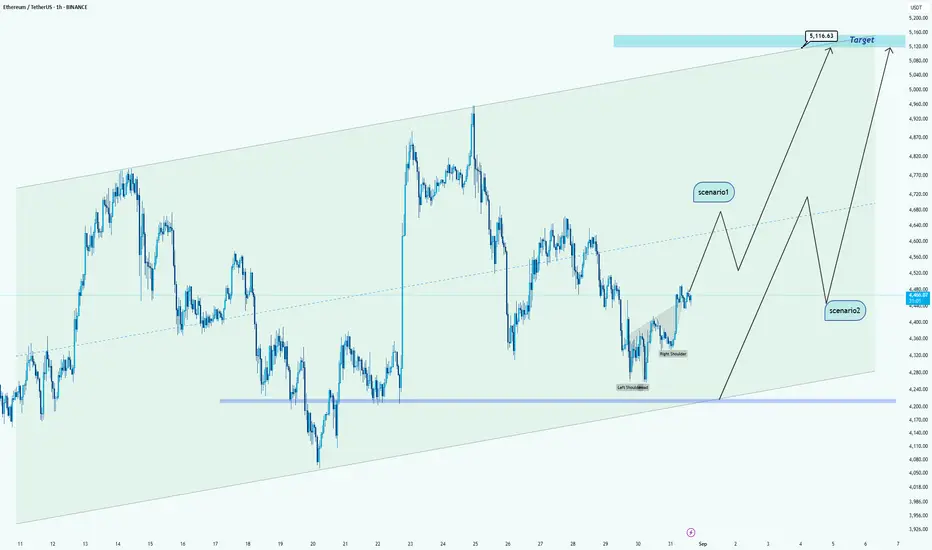
Currently, Ethereum is trading inside a clear ascending channel and has just formed a potential inverse head & shoulders pattern near the channel’s support. This setup gives us two possible scenarios:
🔹 Scenario 1:
If ETH continues its bullish momentum and breaks above the mid-line of the channel, we could see a strong push toward $5,116, which is also aligned with the channel’s upper boundary.
🔹 Scenario 2:
If ETH fails to hold above the current levels, we may first see a retracement back toward the $4,200 – $4,250 support zone (channel bottom). From there, the price can gather momentum and still aim for the $5,116 target in the bigger picture.
Conclusion:
Both scenarios point toward a bullish bias in the mid-term. The difference lies in whether we get a direct rally (Scenario 1) or a deeper correction before continuation (Scenario 2).
ETHUSDT
ETH/USDT (4H) 1. Trend
• The price is in the downward channel (designated orange lines).
• The last candle tests the lower restriction of the channel → Possible reflections or breaking down.
2. Horizers of support and resistance
• resistance (green lines):
• 4,440 USDT
• 4,382 USDT
• Support (red lines):
• 4,268 USDT (currently tested)
• 4,247 USDT
• 4,176 USDT
• 4 090 USDT (stronger support)
If 4,268 is pierced and maintained below, a further exit can be around 4 176–4 090.
3. RSI (Relative Strength Index)
• Currently RSI oscillates below 50 → Bear advantage.
• There is still a strong sale signal (<30), so theoretically there is still a space to decline.
4. Chop (Choppiness Index)
• The indicator shows a fairly "jagged" market → no strong trend, but from the current context of more bear pressure.
⸻
📊 Scenarios:
• Bull (reflection): If the price stays above 4 268 and reflects from the bottom line of the channel → possible traffic towards 4 382 and 4 440.
• Bear (continuation of declines): closing the candle 4h below 4,268 → a signal for further drop to 4 176 and even 4 090.

ETH Market Update📊 ETH Market Update
ETH has formed a trading pattern and is now testing the blue support zone 🔵
👉 This is a critical level — a breakout is coming soon, but the question is: up or down?
⚠️ If CRYPTOCAP:ETH breaks below the blue support, sellers could take control and push price lower.
⚡ If CRYPTOCAP:ETH holds support and buyers step in, we could see a bounce and bullish continuation.
👉 Key takeaway: Wait for clear confirmation before entering — the next breakout will define the trend direction.

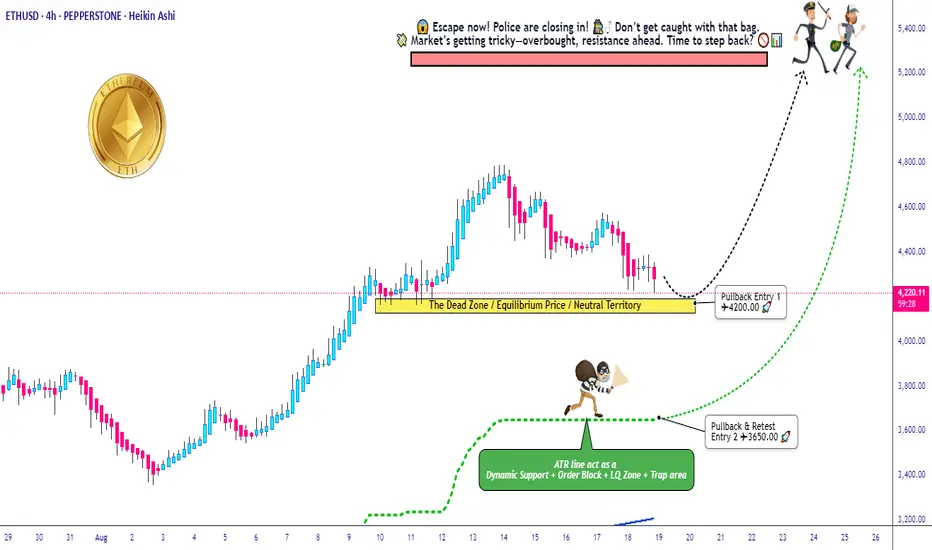
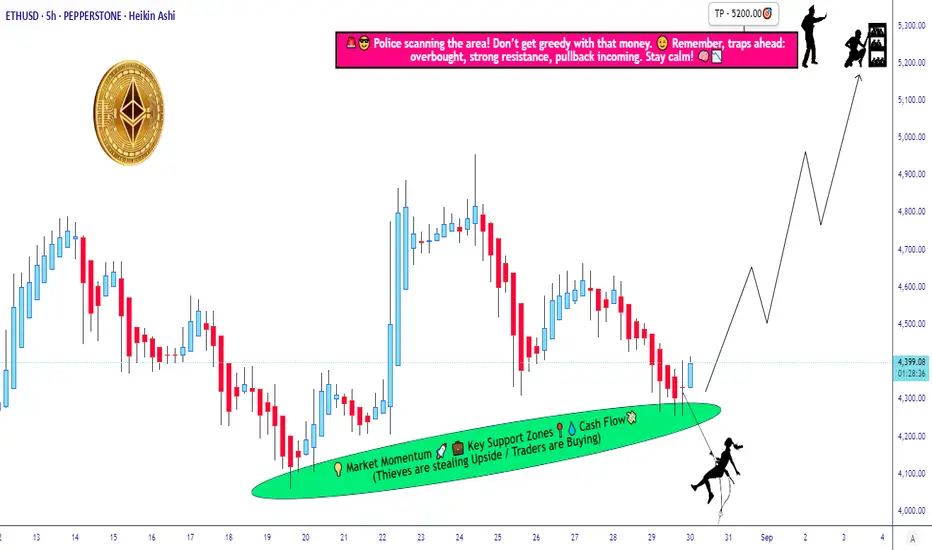
Big Crypto Heist: ETH/USD Swing Plan Targeting 5200 Exit!🚨💎ETH/USD “Ethereum vs U.S Dollar” Crypto Heist Plan (Swing Trade)💎🚨
Dear Ladies & Gentlemen… my Thief OG’s 🕶️💰, the vault is open and the police are distracted — time for the Ethereum Heist Plan!
Entry Plan (Pullback Loot Zones)
Pullback Entry 1: 💵 4200.00
Pullback Entry 2: 💵 3650.00
Load your bags in layers (Thief layering strategy – multiple buy limit orders). Patience is the key, we strike when guards are weakest.
🛑 Stop Loss (Escape Route)
Entry 1 SL: 3850.00
Entry 2 SL: 3300.00
👉 Adjust your SL according to your risk appetite & strategy — every thief has their own escape route.
🎯 Target (Cash-Out Point)
Police barricade ahead! 🚔💨 Secure your loot & exit before capture:
Take Profit @ 5200.00 🤑💸
📜 Thief Note:
This ETH/USD setup is a bullish robbery mission 🕵️♂️. Market guards (bears) are getting weaker, giving us the opening. Our layered pullback entries ensure we don’t rush the vault — we strike smart, not desperate.
⚡ Always remember: news releases = alarm triggers 🚨. Stay sharp, use trailing stops, and never get too greedy.
💖 If this plan helps your heist bag grow — Hit the Boost Button 💥 and power up our robbery crew. Together, we raid the markets daily with the Thief Trading Style. 🏆💪💰
🚀 Stay ready, stay sneaky… The next target is always around the corner.
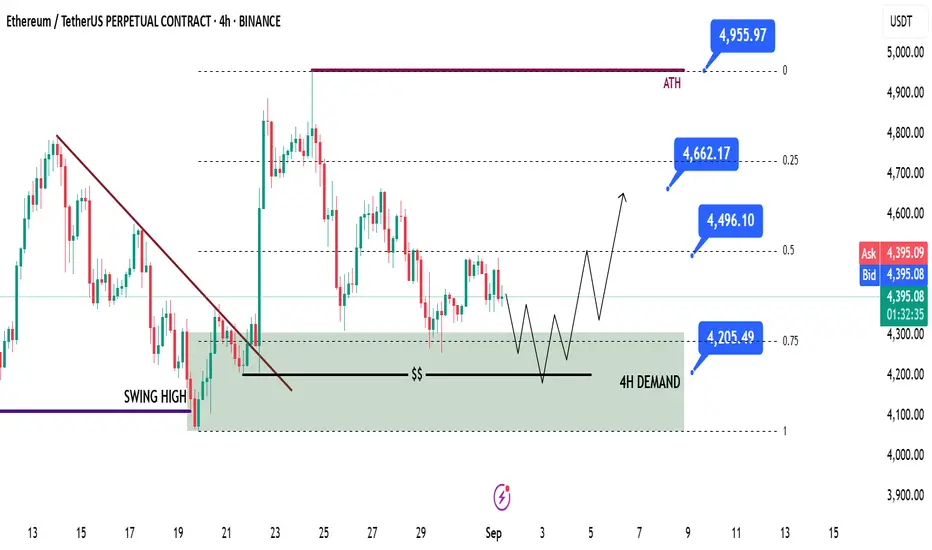
ETH Swing Long IdeaETH Swing Long Idea
📊 Market Sentiment
Overall sentiment remains bullish, supported by expectations of a 0.25% rate cut in the upcoming FOMC meeting. A weakening USD and improving global risk appetite are creating favorable conditions for further upside in crypto assets.
📈 Technical Analysis
Price tapped into the prior swing high and rejected from that level.
This move created a 4H Demand Zone, which I expect to hold.
Additionally, price reacted from the 0.75 range maximum discount zone and is currently bouncing.
📌 Game Plan
I will be looking for price to run liquidity at $4205 before a potential expansion higher.
This level also aligns with the maximum range discount zone.
🎯 Setup Trigger
I will wait for a 4H Break of Structure (BOS) before entering a trade, with LTF confirmation for precision.
📋 Trade Management
Stoploss: 4H swing low confirming the BOS
Targets:
• TP1: $4500
• TP2: $4650
• TP3: $5000 (All-Time Highs)
💬 Like, follow, and comment if you find this setup valuable!
⚠️ Disclaimer: This content is for informational and educational purposes only and does not constitute financial, investment, or trading advice. Always do your own research before making any financial decisions.
Sep1, ETHUSDT Daily Analysis
Intro
For the first time in almost two months, Ethereum has broken below its ascending trendline. In addition, a flat top structure is clearly visible on the 4H chart. These signals make me less bullish on Ethereum compared to before.
That said, there’s still no confirmation of a full trend reversal yet. However, I’ll be more cautious about opening long positions on ETH for now. The key level I’m watching is 4,078.56 — a breakdown below this level could change my long-term outlook on Ethereum and provide a potential short trigger.
⏳ 1H Outlook
On the 1H timeframe, the first setup that caught my attention is a triangle pattern, which has recently broken to the upside. A pullback to the breakout area has also occurred. If price breaks above 4,483.86 after this pullback, it could present a good long opportunity.
Still, I don’t plan to hold this long for the mid/long term — I will take profits at the nearest resistance levels. I’ll keep this approach until the upcoming U.S. unemployment data and other economic news set the broader market direction this week.
📉 Short-side View
At the moment, I don’t see a clear short trigger on Ethereum, nor do I have a strong interest in taking short positions right now.
From a broader perspective, Ethereum may be forming a large range (box) between 4,065.50 and 4,816.84 . Currently, the price sits roughly in the middle of this range, while potential short triggers are much closer to the bottom boundary of the box.

ETH/USDTSimilar to BTC, September isn’t historically the strongest month. For further upside, we’d like to see liquidity taken in the 4000–3355 zone.
Long setups only after clear confirmation.

Volatility Period: Around August 28 (August 27-29)
Hello, fellow traders!
Follow us to get the latest information quickly.
Have a great day!
-------------------------------------
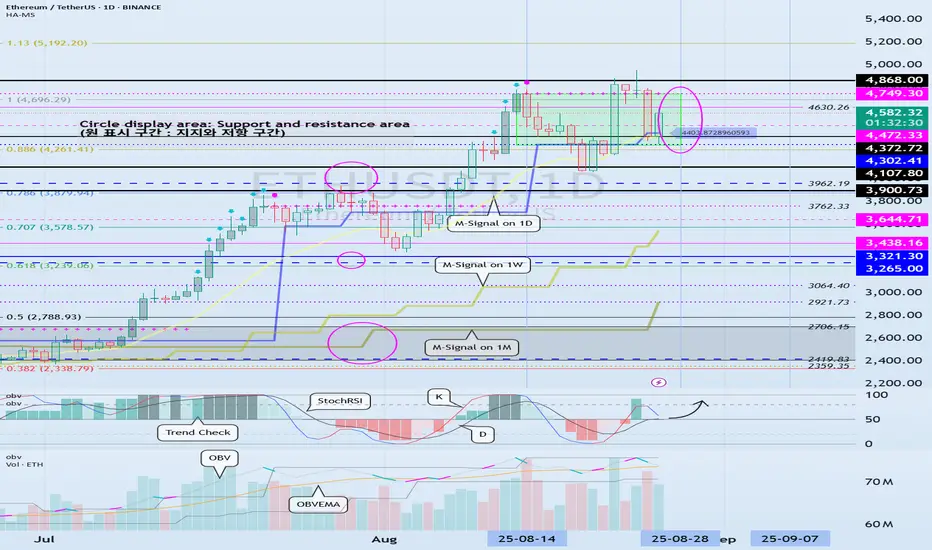
(ETHUSDT 1D chart)
It's rising, with support near 4372.72.
However, since the TC (Trend Check) indicator is at 0, it's unclear where the price will bounce.
Therefore, we need to determine whether support is found around 4630.26 or whether the price falls below 4472.33.
This period of volatility is expected to last from August 27th to 29th.
-
To initiate a cascading upward trend, support must be found around 4749.30.
-
Thank you for reading to the end.
I wish you successful trading.
--------------------------------------------------
- This is an explanation of the big picture.
(3-year bull market, 1-year bear market pattern)
I will explain in more detail when the bear market begins.
------------------------------------------------------
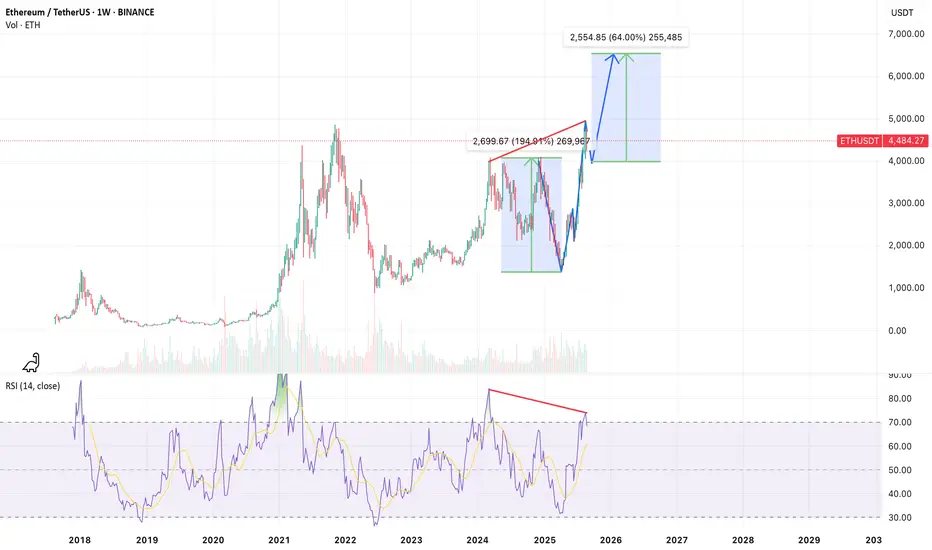
[ETHUSDT] Possible V-Sharp FormationOn the weekly timeframe, ETHUSDT is showing signs of a potential V-sharp reversal pattern. A mild bearish divergence can be observed at the recent highs, indicating the likelihood of a corrective move toward the $4,000 support zone before resuming the broader bullish trend targeting the $6,500 area.
For educational purposes only. This is not financial advice.
ETH 1H Analysis – Key Triggers Ahead | Day 8💀 Hey , how's it going ? Come over here — Satoshi got something for you !
⏰ We’re analyzing ETH on the 4-hour timeframe timeframe .
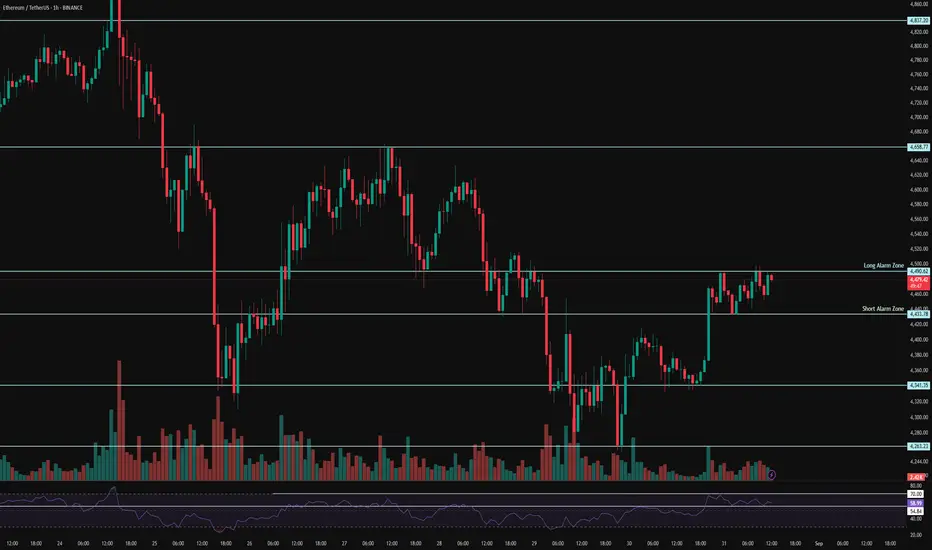
🔭 On the 1-hour timeframe of Ethereum, we can see that after a correction, Ethereum was supported at the $4263 area and moved upward. It had a resistance at the $4341 level which, after breaking and completing a pullback, pushed towards its next higher resistance. Currently, it is in a 1-hour or 15-minute multi-timeframe range, and with a breakout from this pattern, it can give us a trade opportunity.
⛏ Key RSI levels are at 70 and 55. If the fluctuation limit crosses these numbers, Ethereum can have significant volatility and start a new trend.
💰 The volume and number of green candles have increased, and their size also looks bigger. This can be a sign of Ethereum’s bias, showing that buyers are more willing to spend money compared to sellers. The volume and number of red candles have decreased, and they don’t create much selling pressure, although the market is currently in a holiday period.
🪙🪙 On the 1-hour ETHBTC timeframe, after breaking out of its box, Ethereum moved upward and also had a pullback to this box. Now there is resistance at the 0.04145 area, and with a breakout of this level, Ethereum can continue moving upward.
🔔 The alert zones considered for Ethereum are $4433, which is at the bottom of this range as the short alert zone, and $4490, which is at the top of this range as the long alert zone. With a breakout and confirmation above these levels, Ethereum can start its move in the new week. Note that this pattern has strong price action significance, and Ethereum’s monthly candle will also close tonight.
❤️ Disclaimer : This analysis is purely based on my personal opinion and I only trade if the stated triggers are activated .
ETHUSDT: Price Action and TPHello friends. as you seen the chart of ETHUSDT so after pullback on the base we see the positive sign to reach the chart the first p on the 4800 and second tp 5500

Ethereum Analysis (4H)It seems the price is not yet ready for a strong rejection to the downside, and buyers still hold strength. It is expected that, with the interaction or liquidity hunt that previously triggered a strong upward move, we may see another bullish wave. This move would both reinforce a bullish sentiment in the market and allow major players’ orders to be filled.
For a rejection to occur, it will either happen from the premium zone of the previous wave, or a new all-time high might form.
Let’s see how the market reacts to the highlighted red zone.
For risk management, please don't forget stop loss and capital management
When we reach the first target, save some profit and then change the stop to entry
Comment if you have any questions
Thank You

ETHUSD SWING SELL LOADING1. Top123 Pattern Confirmation
The Top123 pattern is a reversal pattern:
Point 1: First high after a strong uptrend (recent swing high near $4,960–$5,000).
Point 2: Pullback low (around $4,370–$4,400 zone).
Point 3: Lower high rejection (below $4,700 resistance zone).
👉 Since price failed to create a new higher high and instead formed a lower high, the bullish momentum is weakening and signaling potential trend reversal.
2. Bearish Momentum Signs
Recent daily candles show strong selling pressure with long wicks and consecutive red candles.
Price rejected supply zone ($4,650–$4,700) → confirming seller dominance.
Break of support level around $4,400 increases the probability of a larger downside move.
3. Supply & Demand Structure
Price is currently retesting broken support as resistance (classic bearish structure).
Short entry zone aligns with the supply zone, which increases the probability of rejection.
Target zone is marked around $3,600–$3,550, which is the next strong demand/support level.
✅ Summary:
This ETH/USD daily setup is a potential short because:
Top123 pattern indicates trend reversal from bullish → bearish.
Bearish momentum visible with lower highs and supply zone rejection.
Price structure aligns with short entry near resistance and target at next demand zone.
Strong risk-to-reward ratio makes the trade favorable.

Small trade on ETH with 1:1 RWBuy the ETH with risk\ration 1:1. We can try to move in the local flat channel and now we are on the middle line on this channel. The stop to below low level of channel, take to up level. Will see...

ETHUSDTI wait for come to 4200$ price that to me give best the position long.
EN: 4100 to 1200
SL: 3990
TP: 4400 - 4500 - 4700

Is Bitcoin still bearish? Probably.
Hi everyone
Important supports have been broken, which I have indicated with black dots in the image.
If Bitcoin falls below $106,000, it probably has the potential to go even lower.
What do you think, buddy?

Ether Still Bullish · We Are Going Up!Good morning my fellow trader, I hope you are having a wonderful Saturday.
Consider this Ether chart again; price action is still happening within the "still bullish" price zone. This is a range that I mapped on the chart as a "pause," a price range for a small break before more rising prices... Come on! We've seen this before.
May-July! The sideways period was even longer than this one and we had not conquered $4,000 nor a new ATH, yet, you remained strong. It is the same all over again.
When we initially extracted the numbers for this bull market, long ago, $4,000 nor $5,000 was ever the goal. We were aiming at a minimum of $6,000, $7,000 or even beyond. If we do good $8,513 it was said. If the bull market is extraordinary, you can see Ether trading at more than 10K.
All these possibilities remain open, all these scenarios but one; it is not the end. Ethereum will not stop growing in 2025 after hitting just under $5K. It will go much higher, we are still bullish; the best is yet to come. Patience is key.
The market is loading up but at the same time we have so much proof that the current chart is an easy hold. Actually, you can buy and go LONG at this point. Why? Because Ether is trading at support. Sell at resistance, buy at support.
We are going up.
Namaste.

ETH 4H Analysis – Key Triggers Ahead | Day 7💀 Hey , how's it going ? Come over here — Satoshi got something for you !
⏰ We’re analyzing ETH on the 4-hour timeframe timeframe .
🔭 In the 4-hour timeframe of Ethereum, we can see that after registering its all-time high, Ethereum was rejected downwards and then took support from the $4,273 area and moved upwards. We need to see how valid this support can remain in the new week. There is also an important resistance at the $4,515 area, and breaking this level could end Ethereum’s corrective trend.
⛏ The key RSI areas are 35 and 58. If the fluctuation passes these levels, Ethereum could enter a new phase of volatility and eventually start its movement.
💰 The size and number of red candles have almost decreased, and with increasing volume and larger candle sizes, Ethereum can start a good trend. Keep in mind that today is a holiday, so not much volume enters the market. On the other hand, there are rumors on Twitter about the death of Donald Trump, which could also prevent an increase in volume.
🪙 In the 4-hour timeframe of the ETHBTC index , we can see that this index broke its box at the 0.03946 area and registered an all-time high for Ethereum against Tether pair. Then it was rejected from this area and showed two rebound reactions at the 0.03946 support, which is the broken box top. With a breakout of the highlighted areas in this index analysis, both Bitcoin and Ethereum could see more liquidity, and this directly affects the ETH/USDT pair.
🔔 The alarm zones that can be considered for Ethereum in this timeframe are the $4,273 and $4,514 areas. The price action in these areas can be of high value, and with increasing volume, they could give us either a short or long trade opportunity.
❤️ Disclaimer : This analysis is purely based on my personal opinion and I only trade if the stated triggers are activated .

Stealing Profits from ETH! Bullish Layer Strategy Activated🔓💰 ETH/USD "Ethereum vs. Dollar" Money Heist Plan 💰🔓
🎯 Plan: Bullish Robbery | Swing/Day Trade
💎 Layered Entries | Precision Loot | Multi-Bag Grab
🚀 Target: 5200.00 | 🛑 Stop Loss: 4060.00
🚨👀 Attention Traders, Crypto Bandits & Market Looters! 👀🚨
The Ethereum vault is wide open – and Thief Trader is here with the LAYERED ENTRY STRATEGY. Stack those buy limits like gold bars in a secret vault. 🏦💎
💥 ENTRY: Any Price is a Good Price 💥
Thief style means we don’t chase – we LAYER.
⚔️ Multiple limit entries:
4400.00
4300.00
4200.00
(Add more layers if you’re savage enough.)
Every dip is a robbery opportunity – we’re not here to beg, we’re here to loot.
🔐 STOP LOSS: 4060.00 🔐
This is Thief’s SL Zone – where the cops show up.
OG Thieves know: adjust your SL to your own heist plan & risk appetite.
💸 TARGET: 5200.00 💸
That’s the police barricade – take the cash and escape before the sirens.
Secure the bag, don’t get greedy.
🧠 Thief Trader Secrets:
📊 Layered entries = survival + sniper precision.
⚡ Swing traders ride it, day traders loot it, investors just chill & count.
🔔 Trail your SL – don’t let profits get hijacked.
⚠️ HEIST PROTOCOL:
✅ No panic entries.
✅ Risk small, layer smart.
✅ Remember: patience = payday.
❤️🔥 Smash that 💥 BOOST BUTTON 💥 if you’re rolling with the Thief Squad.
Follow for the next Market Heist Plan – we rob, we layer, we escape with bags full. 💼💰
“Markets pay the disciplined thieves, not the desperate gamblers.” – Thief Trader
🤑📈🐂 #ETHUSD #CryptoHeist #ThiefTrader #EthereumHeist #LayeredEntries #CryptoTrading #RobTheMarket #MoneyHeistETH
ETHUSD Buy SetupHi everyone.
As the price has touch the 4H OB, Now I'm waiting for a candle close above the swing high in the 15min TF to confirm a CHoCH in lower TF and then I'll set an order to buy.
Let's see what happens next...
Dear traders, please support my ideas with your likes and comments to motivate me to publish more signals and analysis for you.
Best Regards
Navid Nazarian

Middle East Tensions, Upcoming Iran War, Crypto FearThe crypto market is more influenced by collective emotions than any other market. The Fear and Greed Index is a clear example of this reality. Under normal conditions, it can indicate whether traders are overly greedy or fearful. However, when regional crises, such as a potential war in the Middle East, emerge, this index alone is not enough, and sudden panic can disrupt all calculations.
Hello✌️
Spend 2 minutes ⏰ reading this educational material.
🎯 Analytical Insight on Ethereum:
Ethereum remains within a very strong bullish channel 📈, yet a potential pullback of at least 14% is possible, with the key support level around $3,800. Breaking this area could signal a shift in the short- to mid-term trend. Traders should watch volume and momentum closely to anticipate potential entries or exits ⚡.
Now , let's dive into the educational section,
War and Its Impact on Market Psychology ⚔️
According to political and logistical analyses, the region is on the verge of a potential conflict involving Iran that could be larger in scale than the previous twelve-day war. Historically, global markets, especially crypto, react sharply to such situations. In the initial days of this type of crisis, strong bearish candles and rapid declines are almost inevitable, as investor fear peaks and liquidity quickly shifts to safe assets. However, historical market data shows that such declines are often temporary, and price recovery can happen relatively quickly, especially as whales and large investors use the opportunity to accumulate assets at lower prices. This scenario is not a certainty but a probable outcome that traders should incorporate into their risk management strategies.
Whales Hunting Fear 🐋
Whales, or large market players, use moments of mass fear to their advantage. By executing sudden buys or sells, they amplify the emotions of retail traders and usually capture the main profits from nervous hands. This is why many beginners sell exactly at market lows.
Retail Trader Psychology 😨
Beginners often react to collective sentiment rather than analyzing the data. When they see everyone selling, they panic and sell too. In reality, whales are often buying exactly at these moments. This cycle repeats frequently in the market.
Safe Havens During Crisis 🛡
When negative news and political uncertainty dominate, markets tend to move toward safe assets. In crypto, Bitcoin and stablecoins play this role. The higher the fear, the stronger the flow into these assets.
Practical TradingView Tools 📊
To avoid reacting emotionally, using TradingView tools is essential. One of the most important indicators is Volume Profile , which shows the price levels with the highest traded volume. When you see a significant spike in a specific range, it can indicate whale activity.
On-Balance Volume (OBV) helps determine whether price movements are driven by smart money or pure hype.
Relative Strength Index (RSI) is another key tool. When RSI approaches oversold levels during collective panic, it often signals an attractive entry point for whales.
Combining these tools provides practical insights. For example, when RSI is low and Volume Profile shows high activity, the probability of whales exploiting fear spikes is high. Professional traders use these tools not just for price analysis but to assess market sentiment.
TradingView tools allow you to make data-driven decisions instead of emotional reactions. This makes your analysis more valuable to site editors, as it offers both psychological insight and actionable methods.
5 Trading Tips 🔑
never let news of war or political crises force impulsive decisions, as emotional reactions during fear peaks are often the costliest mistakes.
always keep a portion of your capital in stablecoins or safe assets so you can take advantage of buying opportunities during sharp market drops.
instead of focusing on rumors, rely on TradingView tools and data to gain a clear view of money flow and real market positions.
reduce trading volume and focus on risk management during crises, as the market can move against expectations within minutes.
understand that steep drops caused by collective fear are often short-lived, and those who patiently
✨ Need a little love!
We pour love into every post your support keeps us inspired! 💛 Don’t be shy, we’d love to hear from you on comments. Big thanks, Mad Whale 🐋
📜Please make sure to do your own research before investing, and review the disclaimer provided at the end of each post.

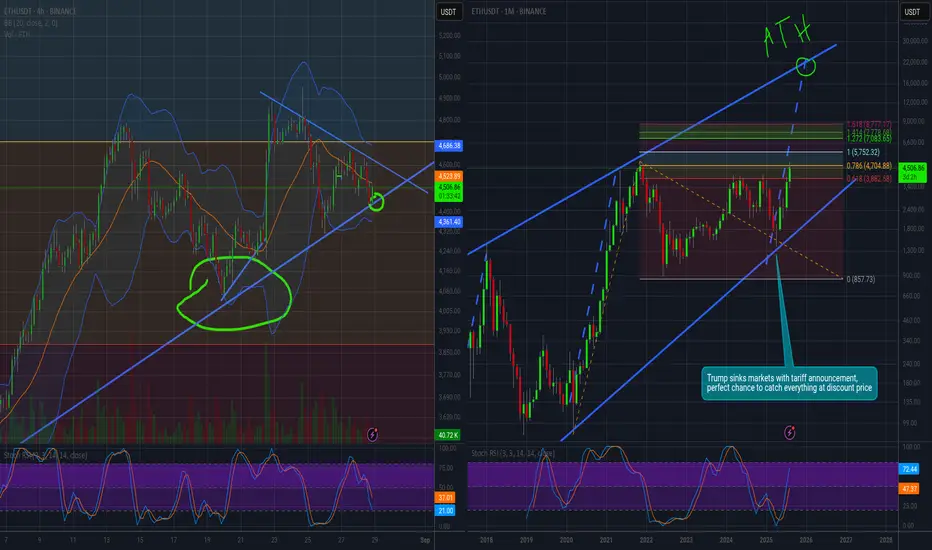
Bull Pennant Almost OverHere's hoping the trend line holds.
If the trend continues we could hit a new price target of 5752 according to trend-based fibonacci extension with 2020's covid impulse dip as the starting point.
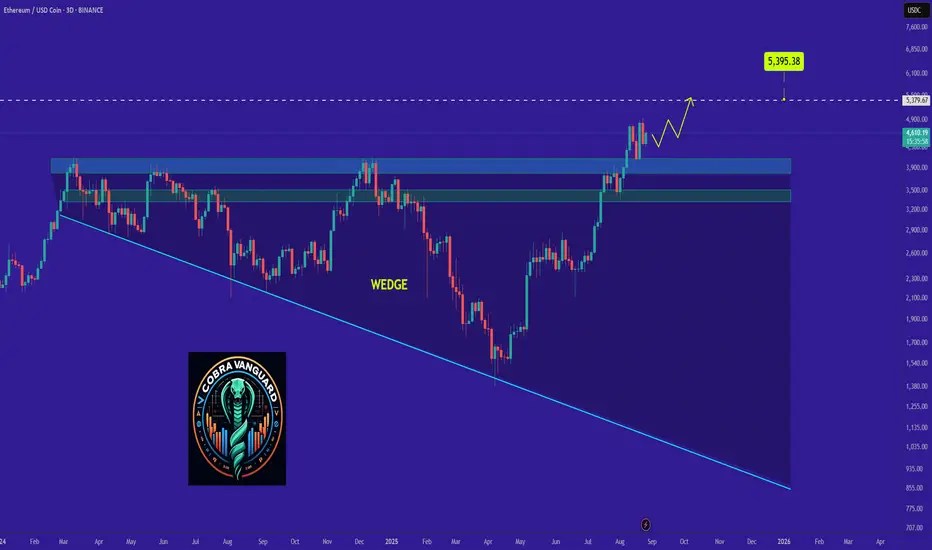
Why ETH Remains Bullish and Its Next Potential Move !As discussed in the previous analysis, the price has finally broken the wedge, and now, with a slight pullback, it could reach above $5k.
PREVIOUS ANALYSIS