Ethereum Elliott Wave Analysis: The Bull Trap Before Wave C!As mentioned in my previous two analyses, Ethereum rejected the $4,740 high and dropped to the $4,050 support zone, where it bounced exactly as projected.
From an Elliott Wave perspective, ETH has already completed a 5-wave impulsive structure and is now inside a corrective ABC phase. At the moment, price action is developing within wave B. Historically, wave B has the tendency to break above the top of wave ⑤, creating a bull trap and sweeping liquidity before the real wave C sell-off begins.
📉 What does this mean for traders?
Wave C is usually sharp, aggressive, and offers great risk-to-reward opportunities on the short side. But instead of rushing into shorts, the smart play is to wait for confirmation.
🎯 Trading Strategy:
1. Allow wave B to complete – watch for a liquidity grab above the $4,840–$4,800 zone.
2. Look for a CHoCH (Change of Character) / market structure break on lower timeframes (4H / 1H) as your entry trigger.
3. Enter short after confirmation, targeting the $4,100 → $3,800 zones first, with potential extension lower depending on momentum of wave C.
4. Place invalidation above the recent swing high to keep risk controlled.
⚡ This is a high-probability short setup forming, but patience and timing are crucial — don’t get trapped in wave B’s fake breakout.
👉 Follow for updates as we track the confirmation of wave C and refine the short targets!
ETHUSDT

Its Ethereum season \ Dont sleep on $ETHIts Ethereum season \ Dont sleep on CRYPTOCAP:ETH
The major resistance line that has remained unbroken for more than 3.5 years is now functioning as a support line.
Corrective waves that form in a short period of time will now only serve as fuel for another parabolic run.

Ethereum Hits a New All-Time High · $5790 Next Followed by $8513Ether is now on a path to a new all-time high and this week is hyper-bullish, as bullish as it gets.
Notice the lower wick on the current session; the week started negative and as it reaches its end, it turns positive. The action is happening at the top of the candle and this means we will see green Saturday, Sunday and for months to come.
The lack of bearish strength on the last retrace shows that sellers are simply not present.
The strong advance today and marketwide bullish action reveals a huge demand for crypto, so strong, that prices can only grow.
Ethereum (ETHUSDT) is now set to hit a new all-time high but that's not all. As I explained in a previous publication, the all-time high is not a major resistance level, it will break easily. This means that Ether will continue growing with the first target being $5,790 on the current move. $8,513 is also a high probability target later this year. We might go even higher.
The bullish bias is now fully confirmed. Ether is going up.
The cryptocurrency market will continue growing. The altcoins market will continue to heat up. This is only the start.
Namaste.

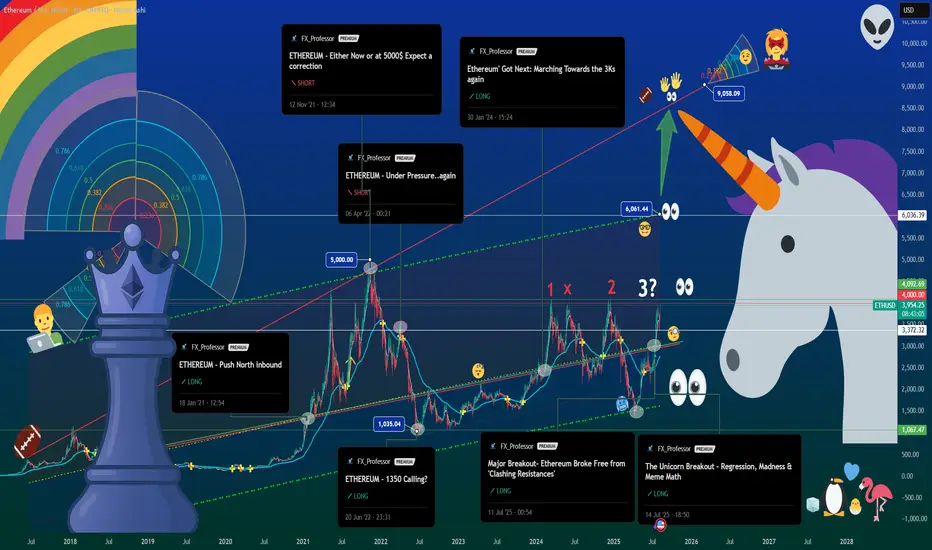
The Unicorn Breakout Part II – Ethereum at $4K, Queen of Crypto🦄👑 The Unicorn Breakout Part II – Ethereum at $4K, Queen of Crypto 📈♟
I’ve had a lot of conversations these past months.
Some friends told me ETH had no power, no influence.
One even called it the “bitch coin.”
Others insisted it lacked dynamics, that it was doomed to trail behind Bitcoin forever.
But the chart… the chart said otherwise.
That’s why, as a trader, so often I close my ears and follow the chart.
📜 The Recap
From “Push North” in 2021, to the “1-2-X” setup, and the July Unicorn prophecy, ETH has kept its dance inside the quadratic regression channel for over 7 years.
In Part I, we called $4,000 the first milestone. Now, it’s reality.
♟ Bitcoin is King, Ethereum is Queen
With recent leadership changes bringing renewed energy and sharper marketing, plus the Petra upgrade quietly powering under the hood, ETH is stepping into the place it deserves. The queen is the most powerful piece on the chessboard — and in this market, Ethereum is moving exactly like one.
📊 What’s Different This Time
-Network activity is pushing toward record levels.
-Transaction counts are surging, signaling deeper engagement.
-The ETH vs BTC conversation is back, and capital rotation is happening in real time.
🛠 Levels I’m Watching:
$4,092 – Current resistance zone.
$6,034 – Mid-regression line, the next battleground.
$8,674 – Unicorn Zone. Euphoric breakout territory.
$3,372 – Short-term support. Below here, $2,912 is on deck.
💙 The Human Note
This run is proof: conviction matters. Sometimes the crowd is wrong, the noise is deafening, and the chart is the only friend that tells the truth.
Trade with discipline, but live with intention. Spend time with those you love. Build things worth remembering. And when you play the game, know when to move your queen.
The Unicorn has hit $4K. The Queen has entered the center.
Next move? Checkmate at $6K? We’ll see.
One Love ,
The FX PROFESSOR 💙
Disclosure: I am happy to be part of the Trade Nation's Influencer program and receive a monthly fee for using their TradingView charts in my analysis. Awesome broker, where the trader really comes first! 🌟🤝📈
ETH Shatters Downtrend with Explosive Breakout | Bulls Take FulChart: ETHUSDT, 1H
Bias: Bullish
Analysis:
Hello, traders! We are witnessing a dramatic and powerful shift in the ETHUSDT market structure that warrants immediate attention.
The Previous Bearish Context:
For several days, Ethereum has been trading within a well-defined bearish channel. This downtrend was characterized by:
A clear descending trendline that has been respected with multiple touches, acting as dynamic resistance.
A series of confirmed lower lows and lower highs, with multiple breaks of structure to the downside (indicated by the "Strong" lows being broken).
Overall seller dominance, pushing the price down from the $4,788 high to a low of around $4,042.
The Bullish Takeover (The Main Event):
The narrative has completely changed in the last few hours. A massive wave of buying pressure has resulted in an explosive move to the upside. The key developments are:
Decisive Trendline Break: A very strong, high-momentum bullish candle has completely shattered the long-standing descending trendline. This is the most significant bullish signal on this chart, indicating the previous downtrend is now invalidated.
Break of Market Structure: This upward thrust has also broken through several previous resistance levels, including the swing high around $4,400. This constitutes a major Change of Character (CHoCH) and confirms a shift in control from sellers to buyers.
Potential Scenarios & Key Levels:
Bullish Continuation (Primary Scenario): With such strong momentum, the path of least resistance is now to the upside. Traders might look for long opportunities.
Potential Entry: A textbook entry would be on a successful retest of the broken trendline or the recently broken resistance level around $4,400, which should now act as support.
TP 1: The previous major high at $4,788 (the '1' on the Fibonacci scale).
TP 2: The next major area of resistance, identified by the indicator as the "Perfect Sell Zone 1", starting around $4,880.
Invalidation Scenario: While the breakout looks powerful, traders must always manage risk. The bullish thesis would be invalidated if the price were to reverse, fall back below the broken trendline, and close decisively below the $4,300 support area. This would suggest the breakout was a bull trap.
Conclusion:
The evidence on the chart is overwhelmingly bullish in the short to medium term. The break of the multi-day trendline is a significant technical event that cannot be ignored. The immediate bias has shifted firmly in favor of the bulls. The key will be to watch for a potential pullback for entry opportunities and to see how the price reacts as it approaches the next major supply zone around $4,900.
Disclaimer: This is not financial advice. This is for educational purposes only. Always do your own research (DYOR) before entering any trade.

ETH New Analysis (4H)After the weekly trigger line was broken and a key supply was cleared, most of the major market participants have been accumulating Ethereum. Considering the momentum and power of the previous bullish trend, we expect nearby supports to hold well and a large distribution phase to form.
In this phase, in order to fill the orders of big players and create a strong bullish outlook before a major correction, the price is expected to revisit the previous bullish wave or even hunt Ethereum’s all-time high.
As long as the green zone holds, we anticipate a price pump for Ethereum in the coming days.
For risk management, please don't forget stop loss and capital management
Comment if you have any questions
Thank You

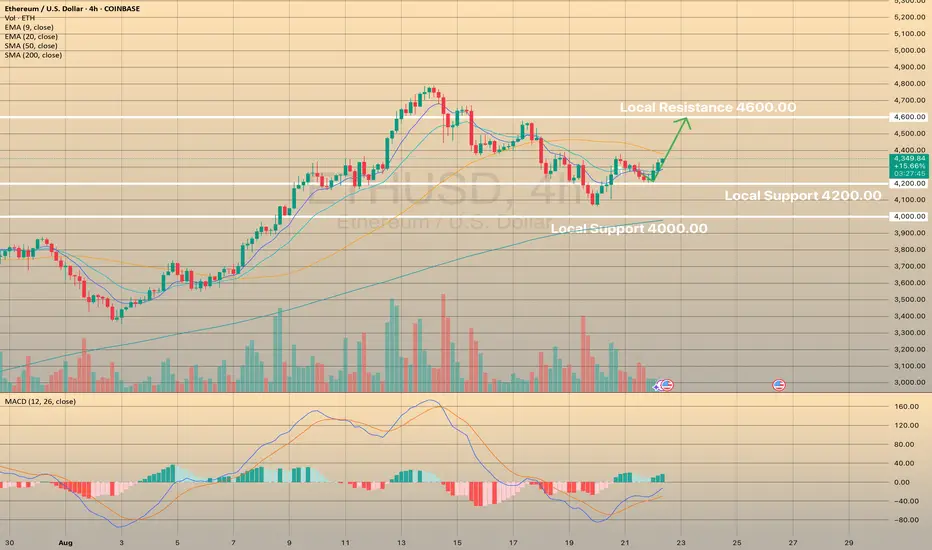
ETHUSD develops new bullish impulseETHUSD develops new bullish impulse
Ethereum is surpassing Bitcoin due to the anticipated approval by the SEC for spot ETFs, the increased adoption by companies, and the positive stance of the SEC regarding liquid staking tokens, which has sparked institutional interest.
Recently the asset managed to hold above the 4,200.00 level. Right now, ethereum is developing a new bullish momentum heading towards 4,600.00 local resistance. MACD has crossed and is in the green zone currently on 4-hour timeframe.
ETHUSDT analysis – 1D OB & Market Structure Scenarios/ AltseasonOn the daily chart, Ethereum is consolidating below the ATH resistance (4859) after a strong rally.
We currently have two major Daily OB demand zones:
First Daily OB around 3200–3600
Second Daily OB around 2400–2800
From here, I see three possible scenarios:
1️⃣ Continuation without deep retracement → Price holds above 4100 and breaks ATH (4859).
2️⃣ Shallow pullback → Price dips into the 3200–3600 OB, then rallies back above ATH.
3️⃣ Deep correction → Price retraces into the 2400–2800 OB before starting a new bullish leg.
⚡ Key point: If any of these three bullish scenarios play out alongside a drop in BTC dominance and a rise in ETH dominance, it could be the real start of an Altseason, with ETH leading the market and altcoins following strongly.
📊 ProfitaminFX | Gold, BTC & EUR/USD
📚 Daily setups & educational trades

Ethereum 7 Days Later · Retrace Or Correction?More information is available now that Ethereum has been retracing for seven days, we can start to make some predictions by analyzing how the token is currently behaving, for example; there isn't much on this chart other than high volume the day that ETHUSDT peaked, the other bearish signals are weak.
The drop is not strong. ETHUSDT is trading safely above EMA55. This move resembles what happened 11-June. A retrace.
On 11-June ETHUSDT peaked at $2,879 and started to retrace. 11 days later, 22-June, ETHUSDT bottomed at $2,111 and that's it, that was the retrace. The entire move was a 26.65% drop, I think we can see something similar.
28-July ETHUSDT peaked again but only briefly, there was a six days long retrace totaling -14.89%. The drop happened from $3,941 to $3,354 but then Ethereum just kept on growing as if nothing happened like before; it is possible to see something similar.
The strength of the current drop, after seven days of bearish action, seems weak. It can intensify in a flash and we see a market crash, but the same dynamics that are present with Bitcoin are also present here. A major crash or flush would only result in a prolonged recovery followed by higher prices.
Ether is likely to move lower but not much lower. Ether is likely to consolidate just to move higher. Ether is growing. Keep it simple.
Namaste.

Ethereum price correction will continue to around $4,000.After Ethereum hit the 4800 resistance level, we are witnessing a price correction. I think Ethereum can goes up again when it hit the Support level at around 4000$.
Important level here for ETH🎯 Key Levels to Watch:
• Above: 4240 / 4340 / 4470
• Below: 4090 / 4010 / 3940
🔥 ETH Liquidation Heatmap:
• Above: 4229 / 4275 / 4316
• Below: 4082 / 4040 / 3972
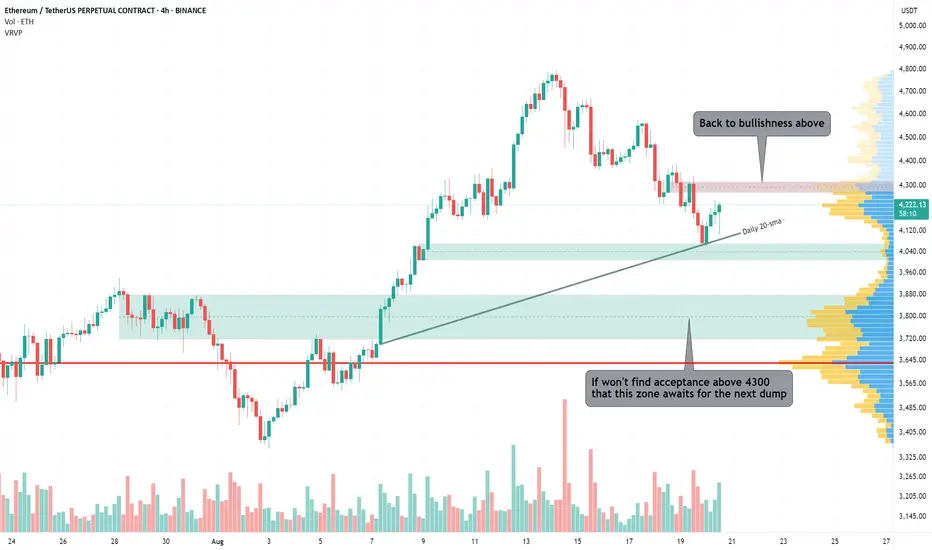
Ethereum just touched Daily 20sma at price ~4066
I bought some there, but frankly, I expected it to fall lower and most of my orders are still there. Unless ETH grows above 4300 and start trading there, chances for another dip to 3940-4010 stay valid.
Why ETH Remains Bullish and Its Next Potential Move !It appears that the pullback is nearing its end, which could potentially lead to a price increase of up to $5000.
PREVIOUS ANALYSIS
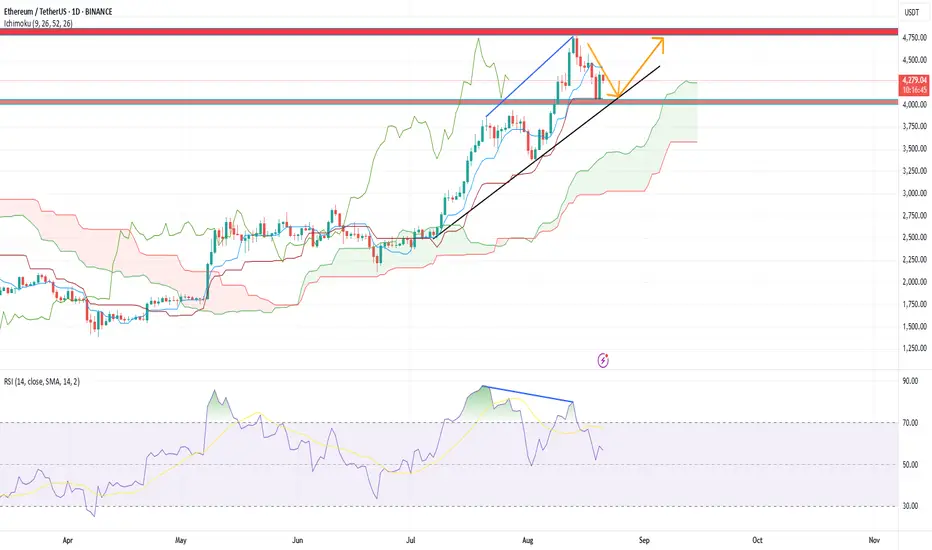
ETHEREUM GETTING BULLISH AGAINOn the daily chart, Ethereum holds above the trendline and 20 MA; yesterday's candle is a bullish engulfing. Sub-4k was tested as expected, and Ethereum is ready to take off again to break its all-time high at 4800.

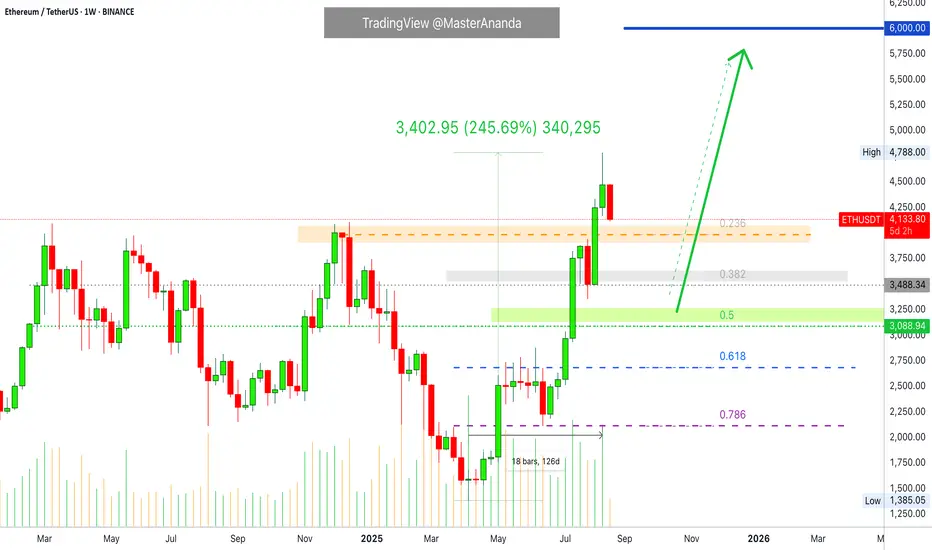
Ethereum: What About Support? $3,000 Next? Watch!Ethereum grew a massive 245% from its 7-April 2025 low and market bottom. The last low pre-2025 bull market. And we are here and this chart is awesome because there is no doubt where we are in this market cycle. We know the market is experiencing growth, Ether is growing, and we know this is only the start.
After strong growth, there is always a correction.
The market tends to seek balance.
ETHUSDT growing straight up for 126 days, four months. 245% total rise.
Where are the support levels?
A strong rise within a bull market is followed by: a mild correction or a strong correction? A long-term multiple months long correction or a two weeks long correction?
Let me help you answer those questions.
Four months will never allow for a correction lasting 3-4 months. This is out of the question. Normally a correction deletes only a portion of the previous move and it tends to last a portion of the previous move.
The equivalent to 0.618 and 0.786 was already consolidated back in May and June. This means that this level does not need to be tested or if it is tested, in an extreme case, then it is likely to hold. Why? Because Ether stopped at this point for more than a month creating a baseline.
The 0.236 Fib. retracement, around $3,900, was not consolidated so this level goes bust as support, on the first try. There wasn't any action around this level on the way up, there won't be any on the way down. So we know Ether to move lower on this drop.
The next level is 0.382 Fib. and this is a strong level. Retraces and corrections within a bull market can easily end here. This is a price of $3,485. There is support around this level as it was consolidated for two weeks before the last high. This level has potential to hold because Ethereum is very strong right now and this zone is below the March, May and December 2024 peaks.
The last level is the 0.5 Fib. retracement. This is another strong support and it tends to stop corrections on its track on a strong bull market. This level can be easily tested. If it is tested, the action isn't likely to last long at these low pries. We are talking about $3,100.
Again, the range between $2,100 and $2,700 is the 0.786-0.618 Fib. retracement and this is a dream buy zone right now and very unlikely that such an opportunity will open up. If it does open, this time, will you buy? Buy when prices are low. Sell at resistance, buy at support.
Ethereum is going down. It is still too early to say how long this correction will go for. Just keep in mind that a retrace can last 1-3 weeks while a correction can last 1-3 months. Both scenarios are possible. Regardless of what the market decides, the bull market is not over, we will see additional growth.
Ethereum will continue growing to hit a new all-time high and beyond.
Namaste.
Bearish | ETHUSD | Ethereum COINBASE:ETHUSD
ETHUSD Weekly – Pullback Risks After Strong Rally
Trend Structure
Ethereum printed a Higher High near 4,800 after an aggressive rally.
The uptrend remains intact with a Higher Low base around 2,000, but short-term momentum is cooling.
Current weekly candles show rejection near the highs with potential for retracement.
EMA Context
Price is extended above the 9 and 35 EMAs, suggesting overbought conditions.
First dynamic supports sit around 3,470–3,350 (9 EMA zone + prior structure).
The 100 EMA around 2,600–2,700 is a deeper corrective target if selling intensifies.
Key Levels + Volume Profile
TP1: 3,354 – major support, aligns with HVN and prior breakout zone.
TP2: 2,960 – mid-volume shelf and structural pivot.
TP3: 2,627–2,708 – strong support cluster with HVN and EMA confluence.
Below 2,600, demand zones extend toward 2,000–1,800.
Targets
TP1: 3,354
TP2: 2,960
TP3: 2,627
Invalidation
A close back above 4,600 would negate the bearish retracement thesis and open continuation toward new highs.
Bias
Near-term bearish/retracement, expecting ETH to test 3,354 and potentially 2,960–2,627 if weakness persists.
Broader structure remains bullish unless 2,000 is lost.

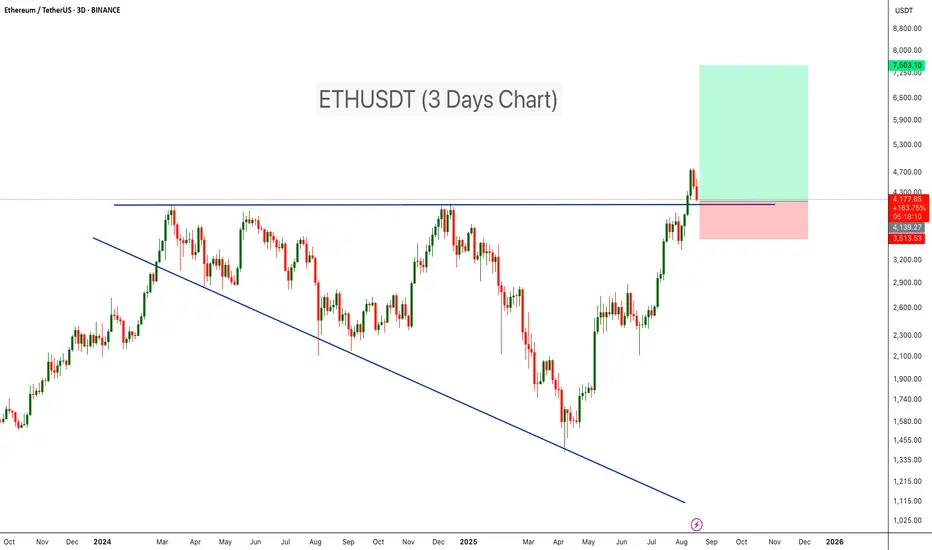
Ethereum Retesting Major Breakout ZoneBINANCE:ETHUSDT has completed a major breakout from a Broadening Wedge Pattern and is now retesting the wedge’s resistance line as support — a bullish continuation signal on the higher timeframe.
- Broadening Wedge Formation: ETH traded within a large broadening wedge throughout 2024 into early 2025, forming expanding highs and lows.
- Breakout Confirmation: The breakout above wedge resistance ($4,10) confirms bullish momentum and shifts market structure in favor of buyers.
-Retest in Progress: Price is currently pulling back, testing the former wedge resistance as fresh support — a textbook technical setup.
-Volume Validation: The breakout was accompanied by a surge in volume, strengthening the case for continuation.
🔷Entry Zone: $4,100 – $4,300
🔷Stop Loss: Below $3,500 to protect against a failed retest.
🔷Targets: $6,500 – $7,500
Cheers
Hexa
The altcoin season begins with Ethereum ┆ HolderStat🔁 Wallet 0xc005…5f7 rotated via Binance: sent 851k USDT to the exchange, then withdrew 116.68 ETH (~$515k) back day later. DefiLlama shows ETH/L2 net inflows outpacing stable hoarding today—classic risk-on rotation. Expect on-chain deployment into majors or high-liquidity blue-chip alts next.
🔝 Score: 21 | Balance: ~$500k | Results: $49.3k→$756.5k (+1,535%, 16 trades; avg buy $830 / sell 3,613; age 67m; rating 136).

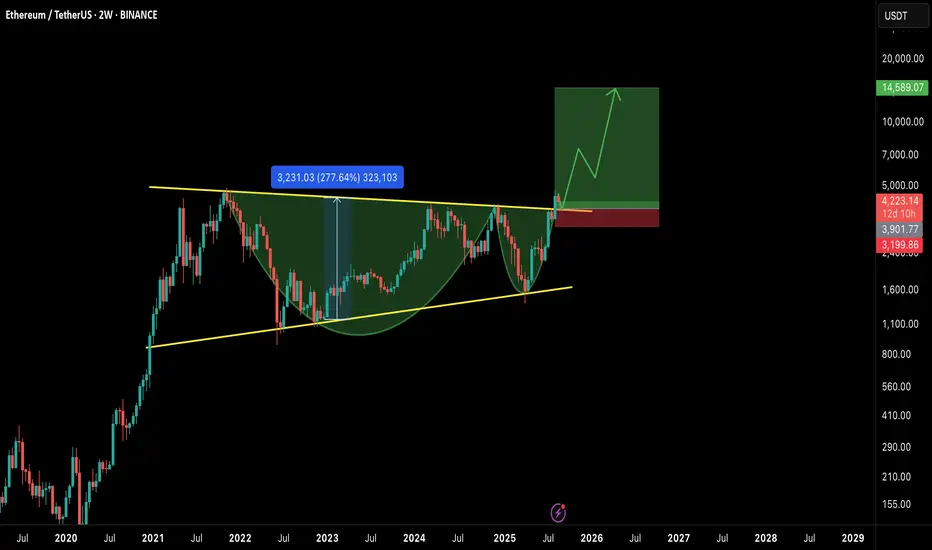
ETH/USDT – Mega Breakout on Higher Timeframe!Ethereum has confirmed a massive breakout on the 2W timeframe, breaking through a multi-year cup & handle and also ascending triangle formation. This is one of the strongest bullish continuation patterns and could fuel ETH into a new long-term rally. 🚀
📊 Chart Analysis
Pattern: Cup & Handle on the 2W chart.
Breakout Zone: Around $4,000–$4,300, now acting as support.
Measured Move Target: ~$14,500 (based on cup depth).
Stop Loss Zone: ~$3,200 (below major support).
✅ Bullish Factors
Multi-Year Accumulation: ETH has spent years consolidating below $4K, and this breakout confirms strength.
High R:R Setup: Risk is limited while the potential upside is ~3x from current levels.
Market Cycle Timing: BTC dominance topping out + potential altseason rotation favors ETH’s outperformance.
Strong Structure: Break above resistance aligns with long-term moving averages flipping bullish.
⚠️ Risk Factors
Macro events (FOMC, inflation data) could cause temporary retracements.
A weekly close back below $4K would invalidate the breakout.
BTC volatility may suppress ETH in the short term before altseason kicks in.
🎯 Targets
TP1: $6,500
TP2: $9,500
TP3: $14,500 (full measured move target)
📌 Conclusion
ETH is showing one of the strongest technical breakouts in years. If $4K+ holds as support, the path to new ATHs and beyond looks wide open. This setup could define the next phase of the bull market.
Bulls are in control — it’s ETH’s time to shine. 🌟
🔔 What’s your target for ETH in this cycle? $10K or higher? Let me know in the comments
ethusdtI think the price will rise to higher levels in the coming period, and we must wait for more time and give it a chance. Continue and be patient. It is only a matter of time.

ETH.D : 5-Wave Bull Run Over –Bitcoin to Outshine EthereumeEthereum Dominance (ETH.D) has completed a textbook 5-wave impulsive rally on the weekly timeframe, signaling the end of its upward cycle and entry into a deep corrective phase. As of August , ETH.D at 13.37% is rejecting the key order block at ~14%, hinting at weakening momentum. This shift favors Bitcoin's outperformance, as capital rotates from ETH to BTC, potentially boosting BTC/ETH ratio and Bitcoin returns during the downturn.
NeoWave Wave Count (Daily Chart):
The rally from ~10.5% lows unfolded in 5 waves: Wave 1 to ~11.41%, Wave 2 correction to ~10.11%, Wave 3 extended to ~13.97% (161.8% of Wave 1), Wave 4 shallow to ~13.32%, and Wave 5 topping at 13.97% with the 1.618 Fib extension (1.141%).
Monowave count (~55-70 subwaves) validates the impulse, with alternation (Wave 2 deep/time-extended, Wave 4 shallow/short). The ascending channel (yellow) has been touched multiple times, and the recent rejection confirms exhaustion.
Weekly Chart Insight:
On the weekly TF, ETH.D has hit a major order block at ~14% (1.425%), not the channel top, coinciding with the 1.618 Fib extension from 2023 lows and historical resistance from 2018 highs (~52%). This multi-year descending channel holds firm, with price failing to break the OB—suggesting reversal to midline ~12.5% or lower (38.2%-50% Fib retrace of rally).
Why Bitcoin Outperforms From Here:
As ETH.D corrects (likely a Zigzag or Flat, targeting 11%-12%), Bitcoin gains dominance, driving better returns for BTC holders. Expect BTC/ETH ratio to climb (current ~12.5, target 14-15), with Bitcoin yielding 10-20% superior performance in risk-off environments. If ETH.D drops below 12.5%, correction accelerates to 10% (78.6% Fib), amplifying BTC's edge.
Trade Idea (Bearish ETH.D / Bullish BTC):
Entry: Short ETH.D (or long BTC/ETH pair) below 13.32% on BOS confirmation in weekly.
Targets: TP1 at 12.5% (channel midline), TP2 at 11% (50% Fib).
Stop Loss: Above 14.25% (OB high, R:R ~1:3).
Sizing: 1-2% capital; trail stops on midline breaks. Watch dominance flips—crypto rotations can spark quick BTC pumps.
ETH bulls, pivot to BTC now! #ETHDominance #NeoWave #BitcoinOutperformance #CryptoAnalysis


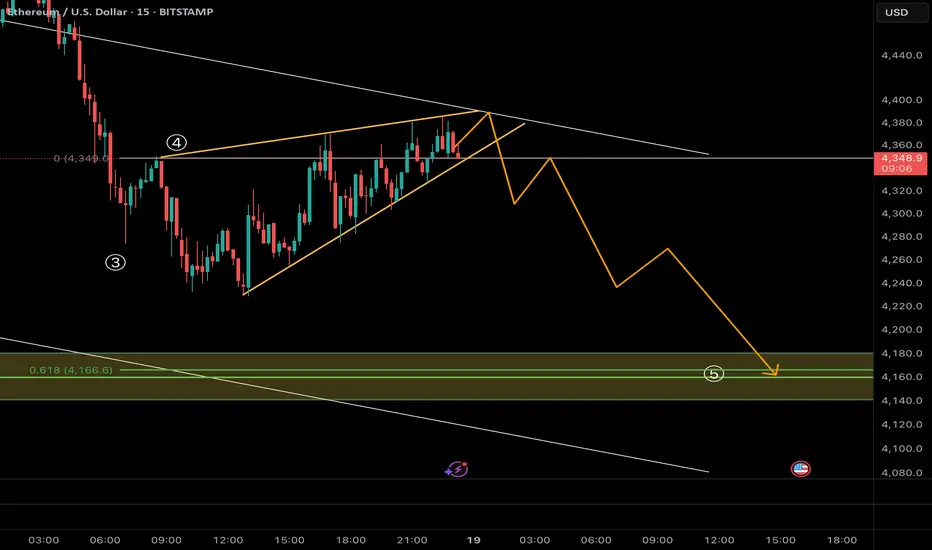
Close view of ETH Short Description : the possible next Move of ETH Shown in graph. ETH can drop to 4100 as 5th wave of correction pattern
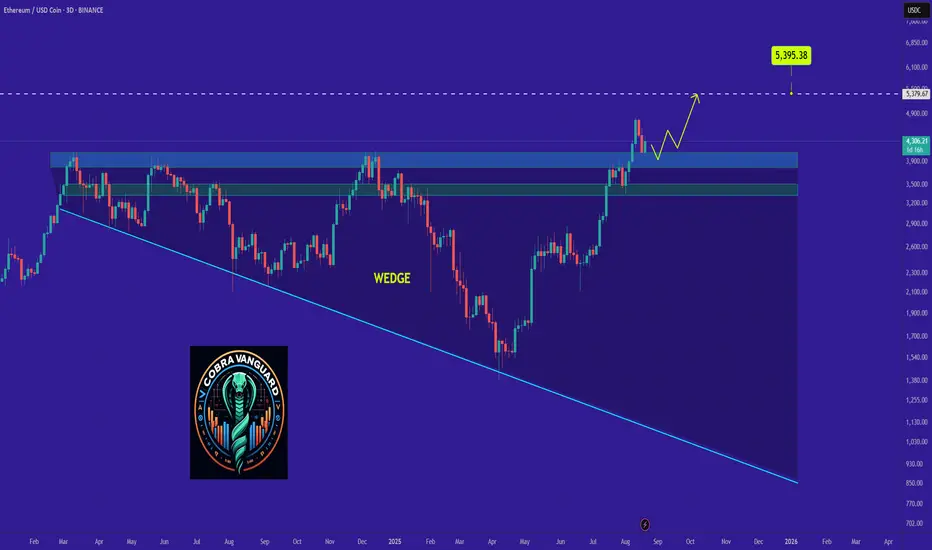
Ethereum's Bullish Market Conditions Intact —$11,111 NextNothing changes here. I am looking at the weekly timeframe and it seems Ether is ultra-bullish, it is literally growing above resistance.
The very insistent and annoying resistance from March 2024 was broken just last week. And as ETHUSDT trades above this level, it started to grow. This week is the first week above resistance and the chart looks great.
Things can change. But things can change. We can see multiple red candles show up and lower prices but this isn't what we have on the chart today. Right now we have strong bullish action, strong bullish candles, strong momentum, the break of resistance, the highest prices in four years and accumulating bullish volume. The chart doesn't point down rather it is saying "additional growth."
Ethereum will continue growing. Just think about it: One day ETHUSDT is trading at $1,500 and starts to go up. Four months later, ETH is trading at $5,000.
Thanks a lot for your continued support.
The next target is $6,000 to stop blank at $7,330 to continue rising until we go beyond $10,000, a price tag of $11,111 for this 2025/26 bull run. There is enough time in 2025 for ETH to produce a full bullish cycle. This chart doesn't need 2026. If it extends, better.
Namaste.
