ETH/USDT 1DAY CHART ANALYSIS !!ETH/USDT on the 1D chart is in a corrective downtrend but currently bouncing toward a major resistance supply zone around 3,500–3,700 USDT.
Price broke below the rising trendline and retested lower, confirming a shift from a strong uptrend to a corrective phase; the main support below is the 2,400–2,550 demand area where the last major rally started.
Above, the grey 3,500–3,700 band is a strong supply/resistance zone formed by prior consolidation and distribution before the last drop, while the top range resistance sits near 4,800.
Bull case: If bulls can push price into the grey zone and break/close decisively above it, structure improves, and ETH can target the upper range toward 4,400–4,800 again.
Bear case: Rejection from the grey zone would likely send ETH back down toward the yellow 2,400–2,550 support, and losing that opens room for a deeper slide toward the 1,400 and 1,000 higher‑timeframe supports marked below.
DYOR | NFA
ETHUSDT

the rise of eth.good eve'
i bring you this really clean chart today.
ethereum divided by bitcoin.
historically, after bitcoins run, money begins to rotate into ethereum, and then into alt coins.
i believe we are at the edge of what could be a pretty solid run in the ethereum ecosystem,
especially since the fusaka upgrade is now live.
scaling eth has never been easier, nor faster, and we believe the speeds are only going to improve as the devs create more breakthroughs in their research.
---
eth/btc came down in a clean 3 wavy move from the recent highs in august.
i choose to label it as a triple zig-zag, the same way i choose to label both eth + btc's waves during the same timeframe.
3-3-3, hypothetically completing at the recent low.
if my postulation is correct, ethereum should return to its all time highs. if it does, and there's enough momentum, we could enter into a price exploration.
not sharing any real targets beyond the ath.
---
eth/btc 🎯 = 0.04327

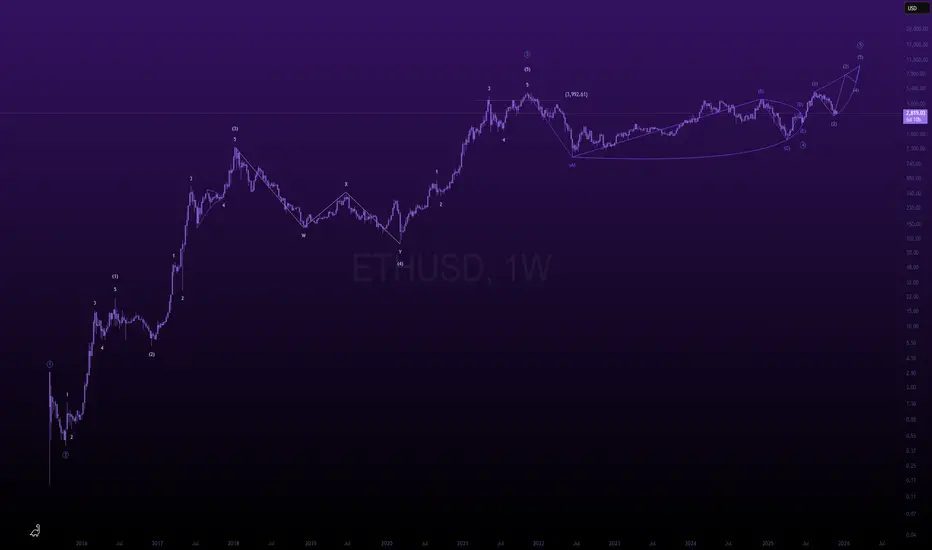
here's how ethereum reaches 10k in 2026.gm,
as promised in yesterdays post, i'd share my macro ethereum case if my post got 5 likes.
---
lets start with the basics,
going back to 2015, ethereum came up in a 1-2 1-2
ever since those times, the impulse has been unraveling very nicely.
i postulate that the 2021 peak was the wave (3) high,
and ever since then, ethereum has been consolidating in a wave (4) - contracting triangle.
some might call it a re-accumulation, but i personally view it as a distribution.
old hands, distributing to new hands,
new hands end up holding price up,
and even create another leg up, but it gets faded.
in wyckoff distribution terms, this final leg up is referred to as "utad test".
in elliott wave theory terms, the final fifth wave out of a triangle is a "thrust".
both are, by design, quick and usually artificially created to create a final exit liquidity event.
---
it's tough to say how high we will go,
but based on our research, generally speaking -
if w3 sees an extension, w5 usually sees a truncation (slightly higher high, or even a double top).
based on this information, i level with you and say, ethereum finishes its macro bull count through an ending diagonal, around 10k. this allows momentum to taper off, and distribution phase to complete with a proper up-thrust-after-distribution.
---
🎯 = 10-12k
ETHUSD | This is not gambling...but surely a high risk setupLooks like ETH is completing a corrective complex (a b c d e) wave into a channel. The current push wave (c) suggests an exhaustion point. This is not gambling, its just probabilities.
If the structure plays out, ETH may begin a correction toward the FVG + fib retracement zone before extending into the channel bottom.
This is a high-risk setup. Because it is a counter-trend. And it depends on rejection from the upper boundary.
A breakout above $3115 will invalidate this setup.
Good Luck!

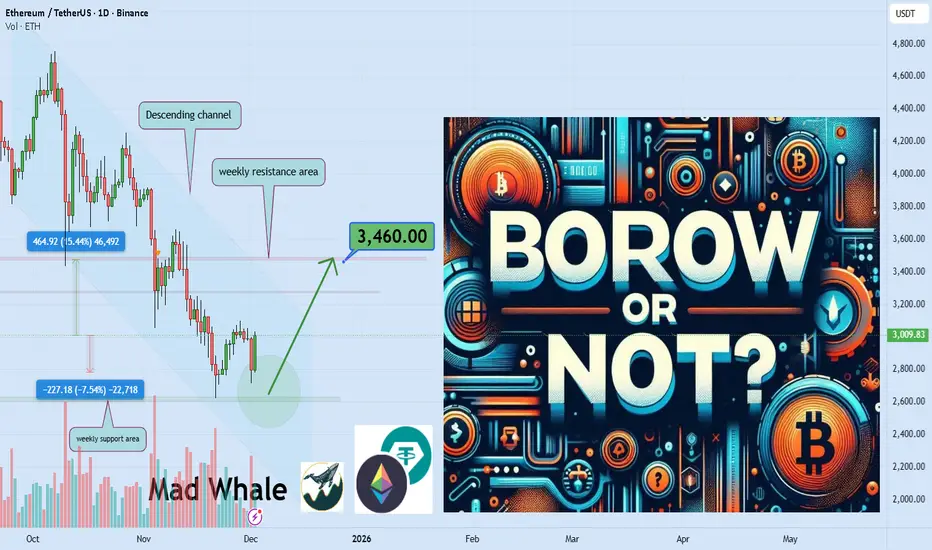
to borrow or not to borrow? why do billionaires borrow so much?Since childhood we were told if you want to sleep peacefully at night never take a loan and always stay debt free but the wealthy seem to follow a completely different rulebook.
How is it that debt creates stress for some people but becomes a growth engine for others.
Hello✌️
Spend 3 minutes ⏰ reading this educational material.
🎯 Analytical Insight on BINANCE:ETHUSDT :
I expect a much bigger rise for ethusdt than what I have shown on the chart. But we should remember that every year when the New Year approaches the market usually goes bearish. We need to wait and pass through that period to see what the final result will be.
Now , let's dive into the educationa l section,
The Basic View of Debt 🧠
Borrowing becomes scary only when it is used for spending not for building value and this is exactly what separates people into two groups.
Why Debt Works for Successful People 💡
Successful individuals turn debt into leverage rather than a burden because compound growth quietly pays the installments while the asset grows larger.
Bad Debt and Short Term Pleasure 🔥
But if you use borrowed money to buy the latest phone take a luxury trip or upgrade your car you only enjoy a short moment before the real pressure begins.
Leverage Behavior in the Market 🧩
The market follows the same rule anyone who enters a position for excitement eventually pays the price but those who seek value creation don’t fear volatility.
The Wealthy Mindset 💬
For the wealthy debt is a mental framework they spread risk instead of running from it which makes their decisions calmer and more precise.
Psychological Pressure on Traders 📉
Traders who always trade only with personal capital often face heavy mental pressure because every price movement equals worry and worry creates mistakes.
The Difference Between Good and Bad Debt 🚀
Once you understand the difference between good debt and bad debt your market view changes good debt builds the future bad debt sells it.
Following the Money and Big Player Logic 🌫
This difference helps you read large investors because they also pull liquidity from places with the lowest psychological and financial cost.
Emotions and Debt in Crypto 🌋
The crypto market reacts deeply to emotions and a trader under stress enters the wrong game but one with the mindset of the wealthy stays steady.
Value Creation Over Time 🌱
Value creation means moving toward things that grow over time and the market reflects this through the behavior of big capital you only need to follow the money trail.
Good Debt and Analytical Structure 🌀
Bad debt makes a trader nervous and impulsive while good debt works like a quiet engine building long term vision and charts teach the same lesson.
📊 TradingView Tools
In this journey there are tools that sharpen your perspective such as the money flow indicator which helps you see when major liquidity enters or exits the market.
Another feature is volume ranges which reveal where decision density is highest crucial for understanding leveraged behavior in price action.
A third useful tool is momentum indicators showing whether a trend moves with real strength or just a short emotional spike.
Combining these tools resembles the wealthy approach to debt using multiple signals to build a logical decision so risk is managed not removed.
Summary 🎯
If you start viewing debt as a tool rather than a fear your market decisions will become clearer and more rational.
Golden Recommendations ⭐
Learn to distinguish spending from investing because the market also recognizes this difference with sharp precision.
Question any move that does not create long term peace because psychological pressure is the biggest hidden debt.
Before making any decision ask whether it builds value or just offers a momentary thrill because the future grows from value not excitement.
✨ Need a little love!
We pour love into every post your support keeps us inspired! 💛 Don’t be shy, we’d love to hear from you on comments. Big thanks , Mad Whale 🐋
📜Please make sure to do your own research before investing, and review the disclaimer provided at the end of each post.
Ethereum continues to dance for dollars. Eth continues to trade inside a wide range. Buyers stepped in again at the same demand zone that has held multiple times, but price is now pushing back into a heavy resistance area on the volume profile.
Momentum shows the same pattern we’ve seen at previous local tops: strong bounce into overbought conditions without a confirmed trend change. Until ETH breaks above this high-volume cluster, the broader structure stays neutral to bearish.
For now, ETH remains range-bound. Key levels are clear, and a breakout on either side will determine the next major move.

ETHEREUM Analysis (12H)From the point where we marked the green arrow on the chart, the Ethereum triangle has begun, and at the point where we placed the red arrow, this triangle has completed and the price has entered a bearish phase.
It seems that we are currently in the late stages of wave C of this phase. Just note that this is the 12-hour timeframe, and this phase has not finished yet; its completion requires more time. We expect wave C to finish within the green zone, which is a supportive flip area.
From the green zone, wave C is expected to complete and the price should enter wave D, for which we have marked the targets on the chart.
Let’s see how it will unfold.
For risk management, please don't forget stop loss and capital management
When we reach the first target, save some profit and then change the stop to entry
Comment if you have any questions
Thank You

ETH mid-term TAEthereum as well as Bitcoin has stopped the distribution on daily time frame and both may have a relief X-mas rally, but it's too early to confirm yet and it's not a reversal of a downtrend either, the indicators remain in the bearish territory which may result in a short-lived rally. Be cautious of the current high risk. Technically mid-term trend remains bearish.

ETH Demand Zone Activated: Trend Shift or Dead Cat?CRYPTOCAP:ETH 3Days Technical Analysis:-
ETH is showing a steady bounce after tapping the 0.618 Fib level, which aligns perfectly with the FVG (green zone) acting as a strong demand area.
Price reclaimed the trendline breakdown region and is now holding above the key support zone.
A sustained move above $3,175 (0.5 Fib) could open the door for a retest of $3,596 (0.382 Fib).
Structure will remain intact as long as ETH stays above the FVG block.
Levels to watch:
• Support: $2,750 – $2,850 (FVG / 0.618 Fib)
• Resistance: $3,175 → $3,596
DYOR / NFA
Please hit the like button if this post helped you in any way.
Thank you.
#PEACE

Ethereum Price Prediction: Can New Holders Fill the LTH Gap?Ethereum is trading at $2,805 at the time of writing, reflecting a 6% daily decline. The asset is sitting just below the $2,814 resistance level after its latest failed attempt to break through $3,000.
Based on current sentiment and market structure, ETH could stabilize and attempt a rebound, but a strong recovery will require consistent investor support. In the near term, Ethereum will likely fluctuate between $2,814 and $3,000 as it searches for direction.
If bullish momentum strengthens and fresh demand remains steady, Ethereum could finally break above the $3,000 barrier. A successful breach would pave the way for a move toward $3,131 and potentially $3,287, invalidating the short-term bearish thesis.

ETHUSDT /// 2DECEthereum lately has been showing signs of weakening after losing the support area around $3400–$3600. With this break, the market structure has shifted toward a more bearish tone, meaning the asset may continue forming lower highs and lower lows as long as downward momentum remains dominant.
At the moment, price reactions around the $3000 zone suggest that supply is still relatively strong. If this structure continues, several potential bearish paths remain valid.
⸻
Possible scenarios toward the $2000 region
Scenario 1
If the $3000 area acts as a local high, Ethereum could continue its downward trajectory toward the $2000 zone.
In such a case, the price might develop smaller corrective upward movements within the broader bearish leg.
⸻
Scenario 2
Another possibility is that the $2800 area generates a short-term bullish reaction.
Such a move could push the price toward the $3600–$3800 range before facing renewed selling interest.
If that happens, a continuation toward the $2000 zone could remain on the table.
⸻
General outlook
In both scenarios described above, a revisit of the $2000 area is one possible development based on the current technical structure.
This outlook is purely scenario-based and may change if the market structure shifts.
⸻
About the possibility of $1000 ETH
Reaching the $2000 zone does not automatically imply deeper downside.
However, the manner in which price approaches that area could provide clues:
• A sharp, capitulation-type decline toward $2000 might suggest that a local bottom has formed.
• A slow, corrective decline could indicate weakening momentum, in which case observing price behavior after reaching $2000 becomes important.
If bearish continuation patterns appear at that stage, lower levels — including the $1000 region — cannot be ruled out as long as the downtrend structure persists.
Once price interacts with the $2000 zone, I will share an updated analysis based on the new market structure.

Ethereum (ETH) Rejected from $3K — Key Support AheadETH recently got rejected at the critical $3,000 resistance, a psychological and technical level that’s held firm amidst broader market volatility. However, bulls shouldn’t panic just yet — Ethereum is now approaching a major support zone between $2,640 and $2,770, where it has previously found strong buying interest. If macro conditions stabilize, momentum could return quickly from this level.
💡 Trade Setup
Entry Zone: $2,640 – $2,770
Take Profit Targets: $3,370 and $4,000
Stop Loss: $2,187
This setup offers a strong risk-reward profile, especially if ETH rebounds as it has done historically from this zone. Watch for volume confirmation and potential bullish divergences on lower timeframes to time entries.

Ethereum (ETHUSDT): Approaching a Major Turning PointHI!
Trend Structure
Since mid-October 2025, ETH has been trending inside a well-defined descending channel, forming consistent lower highs and lower lows. The break of the previous bullish trendline back in July 2025 confirmed the shift into a corrective phase.
Key Support Zone (S&D)
Price is now around $2,730 (Nov 2025) and heading toward the crucial $2,450–$2,300 S&D zone, a strong support area that held the market firmly between May and July 2025.
Expected Price Behavior
A final liquidity sweep toward $2,300–$2,200 is possible before any sustainable upside move. This aligns with the lower boundary of the descending channel.
Deeper Support (DP)
If this level fails, the next major demand sits at $1,950–$1,800, last touched in March 2025.

ETHEREUM Analysis (12H)A large amount of liquidity has been hunted at the top, which corresponds to the all-time high. After this liquidity was taken, the price entered a bearish structure with strong momentum.
For this bearish structure to reverse or slow down, sufficient liquidity needs to be collected from the lower areas of the chart.
There is a possibility of a temporary rebound from the current levels, but the main reversal should come from the lower zone that we have identified.
We still maintain this outlook on Ethereum in the daily and 12-hour timeframes
Do not enter the position without capital management and stop setting
Comment if you have any questions
thank you

Is ETH About to Drop Hard?From my perspective, ETHUSDT is showing clear weakness when combining the latest news with the current price action on the chart.
In the final days of November, the USD strengthened and risk-off sentiment spread across the crypto market , causing liquidity to stall. ETH had no positive catalysts , and multiple reports showed that price continued to remain “stuck” below the 3,000–3,100 USD zone — an environment that leans more toward downside than upside.
On the H4 chart, the 3,100 USD zone has become extremely strong resistance . ETH has been repeatedly rejected at the descending trendline — exactly the same pattern as previous reversals. Buying pressure is very weak , showing the market is not ready for a breakout.
Ichimoku also leans bearish: price is below the cloud , the future cloud is thin and sloping downward , signaling weak bullish momentum. The lower-highs, lower-lows structure further reinforces the downside bias.
If ETH continues to be rejected at 3,100, the highest-probability scenario is a pullback toward 2,950–2,980, before potentially dropping further. A very achievable target is 2,870 USD, which aligns with the support zone shown on the chart. If the market weakens further, the 2,750–2,800 zone may also be retested.

eth taps athgm,
i'll keep this post short and sweet, straight to the point.
eth came down in 3 waves from the recent highs,
we swept the all time highs to catch all the short stops
and we shook out all the bulls after.
we've been consolidating beneath last cycles high for many years now,
and i believe we are getting ready to break out finally.
my upside target is pretty fluid, not attached to any particular number,
more interested in the wave structure itself.
somewhere around 8-10k is fair value,
maybe as high as 20k if we ignite some true momentum.
---
ps. if this post gets 5 likes, i will share my macro bull case on eth.

ETH Chart doesn't look prettyI see Ethereum’s chart not looking pretty for long nor hold positions at these prices.
Price Action
ETH continues to make lower highs and lower lows inside a descending wedge.
Price is moving toward two major demand zones, and the momentum is really weak. Just minor price hiccups.
I'm expecting some choppy or even consolidation movements before a possible test of the lower demand blocks.
OBV is such an underrated indicator!
Look at OBV, this is where the things gets interesting..
OBV is breaking its trendline downward, even while price hasn’t fully broken structure yet.
This is a classic sign of volume distribution. Smart money is exiting positions quietly.
When OBV breaks direction before price, it often predicts the next major move.
At the moment, ETHUSD is looking heavily bearish. Given the fact that BTC is also giving early signs of a bearish trend, I don't think buying ETH is a good idea here. I'll wait for a deeper correction.
Good Luck!

ETH/USDT (4H Timeframe)The chart shows Ethereum’s price action on the 4-hour timeframe with key supply–demand zones, structure levels, and an active long setup.
1. Market Structure
ETH has been in a downtrend, forming lower highs and lower lows, but recently it created a short-term bullish reversal from the demand zone near $2,880–$2,950.
Price broke a small internal structure high (marked “XX-Liquidity”), indicating potential short-term bullish strength.
2. Key Zones
Major Supply Zone (Upper Blue Box):
Around $3,360–$3,414 — a strong resistance area where price previously dropped heavily.
Major Demand Zone (Lower Blue Box):
Around $2,888–$2,949 — where price had a strong bullish reaction.
3. Order Block (OB+)
A bullish order block is marked just below the current price (~$3,000).
Price is pulling back into this OB, suggesting possible bullish continuation if it holds.
4. Current Position Setup
There is a highlighted long trade zone from the OB, targeting the $3,257–$3,257+ region.
Entry appears near $3,000, SL below the OB, and TP at the previous major structure high.
5. Price Reaction
ETH is hovering around $3,003, testing the order block for liquidity.
If OB holds, price may push toward the target zone. If broken, price may revisit the demand zone at $2,880–$2,940.

$ETH - Ping-Pong ZoneCRYPTOCAP:ETH is sitting under this diagonal resistance. Could see a technical bounce around 2.9k (ltf support) , but if we can’t clear 3.1k, we could see it retesting 2.8k to 2.7k
Bottoms don’t form overnight, so Ethereum will probably keep ping-ponging in this 2.6k–3.1k range for a bit before the next move.

ETHUSDT — Bearish Flow Targeting 2,956ETH is still trading below the key intraday resistance at 3032–3045, keeping the bearish structure intact.
As long as price fails to break and hold above this zone, downside pressure is expected to continue.
The current Fibonacci sequence supports a continuation lower, with price showing repeated rejections around the 0.333 / 0.236 levels.
This keeps the market biased toward the next liquidity pocket.
📉 Main bearish target: 2,956
This level aligns with the Fib 1.0 extension, making it the next high-probability destination if bearish momentum persists.
A break above 3045 would invalidate this scenario; otherwise, ETH remains on track toward 2,956.

ETH 4H – Trendline Rejecting, But Does Price Sweep $2,629?ETH tapped into the 0.5–0.786 Fib retracement zone, directly under the macro downtrend line, creating a strong cluster of resistance. Price rejected both the 50 EMA (yellow) and 100 EMA (purple) on the retest, confirming continuation of the 4H downtrend.
The key downside target is the $2,629 liquidity level, where previous wicks, volume clusters, and demand reactions formed. With Stoch RSI fully overbought and rolling over, momentum supports a move lower unless ETH can reclaim the 50/100 EMAs with a strong impulsive candle.
A break above the trendline would invalidate the short-term bearish structure and reopen targets toward $3,140 – $3,260 (0.5 and 0.618 retraces).
Until then, the path of least resistance remains toward liquidity below.

ETH/USDT | Ethereum Breaks 3000 and Momentum Still Points HigherCRYPTOCAP:ETH pushed all the way to 3000 and the bullish view is still fully intact. From the 2600 rebound to here the move has delivered more than 17 percent already and the structure still supports continuation. As long as ETH holds above the 2500 to 2700 demand zone the upside targets remain 3200, 3500, and 4000 in the next major leg. On the supply side the important zones sit at 3200 to 3300 and then 3500 to 3600 where price may slow down before the next breakout. For now momentum belongs to buyers.
Please support me with your likes and comments to motivate me to share more analysis with you and share your opinion about the possible trend of this chart with me !
Best Regards , Arman Shaban

Ethereum Faces Death Cross After 9 Months After $4 Billion SellEthereum is currently priced at $2,921, sitting just under the crucial $3,000 resistance level. Losing this psychological threshold triggered the wave of $4 billion in selling and reinforced bearish sentiment.
In the near term, ETH will likely consolidate under $3,000 and attempt to hold above support at $2,814 or $2,681. If market conditions worsen or investors continue to sell, Ethereum could break below $2,681 and slide toward $2,606 or lower.
If broader conditions stabilize, ETH could regain bullish momentum. A decisive reclaim of $3,000 would open the path toward $3,131 and potentially $3,287. This would helping Ethereum invalidate the bearish thesis and rebuild confidence among holders.
