ETHUSDT, Is it time for the biggest Altcoin?Hi fellow traders, ETHUSDT will be ready to make a move higher from the blue box after it completes the flag correction in ABC formation. Target will be 3429.75. Good luck and trade safe!
ETHUSDT


ETH Analysis (1W)Here I am, presenting the asset I personally dislike the most — ETH.
But the chart doesn’t care about feelings. ETH looks ultra bullish, but only if it breaks above the $4,125 level.
Why this level?
The $3,800–$4,100 range has historically acted as a major distribution zone — a place where market participants have consistently taken profit for years.
If this resistance is finally broken, we could see ETH rally toward $6,900 as a minimum target.
This level is based on the breakout projection of the long-standing macro structure.
Honestly, the target looks even better than the asset itself :)
Good Luck.

How is our Ethereum long going?TSUNAMI TSUNAMI
sardines get lost
whales get liquidated
nobady undestands whats happening
it's the market acting
We are making ethereum great again (MEGA)
mega people owe me that
you've been warned
I was TRIGGERING THE MAJOR ETHEREUM SUPPLY SHOCK
MAJOR
sardines traumatized by my bitcoin long in november (still open)
will be traumatized now by my ethereum long
my new business
CASH MONEY HEROES
i look up to the sky and now the world is MINE
Ive known it aaaaaall my life
I MADE IT, I MADE IT
i used to dream about the life Im living now
i know that theres no doubt
I made it I MADE IIIIIIIIIIIIIIIT
knooooown from the city where no one believed in me
but I never give up the fiiiiiiiight
yeah, but now on TOP
i told you to let it ROCK
now moneys fallin from the SKY-Y-Y-Y-Y-Y
birdman sharkman
swagged out, 100
rooftop hella choppa burning SMOKE
louie bag stay strapped with a priceless GLOBE
high life flippin and get some MORE
paradise the luxury marble FLOOR
when I hit, nig** hit me full of that caaaaaaaash
more money than i seen in a garbage caaaaan
stunna island money and the POWER
thats how we do it make it rain make it SHOWER
#ETH #ETHUSDT #ETHEREUM #LONG #SWING #Analysis #Setup #Eddy#ETH #ETHUSDT #ETHEREUM #LONG #SWING #Analysis #Setup #Eddy
ETHUSDT.P Swing Long Analysis & Setup
Important area of the upper time frame for swing are identified and named.
This setup is based on a combination of different styles, including the volume style with the ict style.
Based on your strategy and style, get the necessary confirmations for this Swing Setup to enter the trade.
Don't forget risk and capital management.
The entry point, take profit point, and stop loss point are indicated on the chart along with their amounts.
The responsibility for the transaction is yours and I have no responsibility for not observing your risk and capital management.
🗒 Note: The price can go much higher than the second target, and there is a possibility of a 500% pump on this currency. By observing risk and capital management, obtaining the necessary approvals, and saving profits in the targets, you can keep it for the pump.
⚠️ Warning : The stop loss is dramatic and large. Place the stop loss based on your strategy and after getting entry and confirmation on the entry point behind the last shadow that will be created. (( This is just my opinion and is not meant to be 100% correct, so be careful with your capital. ))
Spot Investing : ((long 'buy' position)) :
🟢 Entry 1 : 1800
🟢 Entry 2 : 1500
First entry point calculations :
⚪️ SL : 1370 ((23.89%))
⚫️ TP1 : 4500 ((150%))
⚫️ TP2 : 5000 ((177.78%))
⚫️ TP3 : 8000 ((344.44%))
⚫️ TP4 : 10000 ((455.56%))
‼️ Futures Trading Suggested Leverages : 3-5-7
The World Let it be Remembered...
Dr. #Eddy Sunshine
4/4/2025
Be successful and profitable.
Do you remember my first Ethereum swing long signal?
My first swing long signal was provided on Ethereum, which was spot pumped by more than 100% and was profitable :

$ETH Weekly Analysis – ATH soon?ETH is testing the upper boundary of the green zone (~4340–4350), which is acting as key resistance, very close to its ATH.
Scenarios for this trading week:
Bullish : a confirmed breakout and close above 4350 opens the door to the 4,600–4650 target zone, with strong resistance ahead at 4860 (previous all time high zone). If buyers show strength, we can see new All-time High (~4900-5000).
Sideways/Correction : price could move in the 4000–4200 range for consolidation.
Bearish : а drop below 4000 could push ETH down to 3500–3650, even toward the key support around 3300 if the selling pressure grows.
Daily RSI is at 74, that means it's deeply overbought, so be cautious about your long positions.
Disclaimer: The author’s opinion may not align with yours.
BYBIT:ETHUSDT

ETH ROAD TO 20K+I think we are getting closer to the final accumulation stage on ETH.
We can see a potential shape of huge channel in log scale.
After forming median of the channel I would like to see a big and fast correction near 30% from here towards 2900 support which must hold imo.
After that test of smthg around 3600 rgion and double bottom would be the best option just before few months of consolidation before breaking up and starting blow off top part.
Top of that channel depends on timing so the later the better I guess.

Ethereum ETH price analysis📉 Three possible scenarios for #Ethereum CRYPTOCAP:ETH :
🟢 Bullish:
Minor correction to $3950–$4000, followed by a breakout to new all-time highs (ATH).
🟡 Neutral:
Drop to $3400, bounce to $3950 — and then the decision point: breakout or breakdown?
🔴 Bearish:
Deeper correction to $2650 — possibly the last great buying opportunity before the next major rally.
👉 Which scenario for OKX:ETHUSDT resonates most with you?
Let us know in the comments!

ETH NEXT BULLISH MOVE.🟢 ETHUSDT | 1H Bullish Setup
✅ Price broke structure and is in bullish order flow.
✅ Clear POI (Point of Interest) zone at 4,060 – 4,080.
🔍 Price is retracing from highs, yet to tap into POI.
📌 Trade Idea: Wait for price to retrace into POI zone and look for bullish confirmation before entry.
🎯 Potential bounce toward 4,350+ after liquidity sweep and POI mitigation.

ETH | NEW ATH or DUMP ?Ethereum recently peaked at $3900. And allthough this is not a new ATH (close by a few hundred dollars), it is a local high for the year.
My last update was on an inverse Head and Shoulders pattern on ETH, which has since increased over 50%:
(The original idea here:)
The question now, is what's next for ETH - further increase, or are the increases over for the near term and is a correction more likely?
I'm going to say that the increases for ETH are over for now. This is because we correction is most definitely due after such a large increase in a fairly short timeframe. I'm not saying we're heading into a full out bearish cycle, but a 20-25% correction would be most normal at this point.
Additionally, XRP has also made it's peak and lost the high, now trading just under $3. This is a strong sign that the alts have likely already rallied, since XRP used to be the last to increase (if it increased at all, historically. (Thanks Jedd).
I was very lucky to call that top here:
Either way, buyers may use this correction to scoop up on smaller alts over the next few weeks. This ultimately depends on whether the market has ONE MORE pump, and if the correction will bounce back from a 20-25% pullback.
_________________
BINANCE:ETHUSDT

ETHUSD - Technical picture The long-term trend remains bullish: Technical picture
The long-term trend remains bullish: The price is confidently holding above the 20-, 50-, 100- and 200-day moving averages, which indicates a stable uptrend.
TipRanks indicators:
Almost all key MAs (5-200 days) are showing a “Buy” signal, with the exception of MA20 (Sell).
The current price of Ethereum (~$4,188) is significantly above all MAs, which confirms growth.
RSI (14) — 58.75 (neutral), MACD — Buy, ADX — neutral, ROC — Buy.
Result — “Strong Buy”.
TipRanks
Price levels
ETH previously relied on EMA50 (support zone), and demonstrates a continuation of the uptrend on short-term timeframes.
Economies.com
Support and resistance levels
Resistance: Near the psychological mark of $4,000 — an important barrier, the breakout of which can trigger another growth round.
Support: The standard of the ongoing bullish trend is the EMA50, as well as the levels of $3,700–$3,800, where ETH demonstrated stability.
Result
The trend remains positive: ETH is confidently above all key MAs, MACD and other signals confirm the strength of the bulls.
The key level is $4,000: breaking it can return ETH to the growth zone.
RSI at 58.8 and MACD in the Buy zone confirm the potential. However, given the overbought conditions, a small correction or consolidation is possible.
Recommendation: long positions on a rebound from support with a target of $4,000+, or entry upon a confident breakout of the resistance level.

ETHUSDT analysis - 1H FVG and OB SetupsETH has recently rejected from the 4,370 area, showing signs of short-term exhaustion.
On the 1H chart, a clear FVG is located around 4,100, which could act as a liquidity target if selling pressure continues.
Below that, we have a strong Bullish OB around 3,900, aligning with previous demand and potential reversal interest.
If price retraces into the FVG zone (4,100) and shows bullish reaction in lower timeframes, short-term buys could be considered targeting 4,300 – 4,370.
A deeper move into the OB at 3,900 would be a high-probability long setup for swing traders, with upside potential toward 4,500.
For now, structure remains bullish on higher timeframes, but short-term correction is possible before continuation.
📊 ProfitaminFX | Gold, BTC & EUR/USD & Crypto
📚 Daily setups & educational trades

ETHUSDT 4H Breakout: Symmetrical Triangle Targets AheadMEXC:ETHUSDT
Key Elements:
Pattern: The chart shows a symmetrical triangle pattern formed by two converging trendlines connecting the highs (resistance) and lows (support). The breakout appears to have occurred upward from point D, with a measured move of 1.683 times the height of the triangle (from 0.619 to 4.49).
Price Levels:
Entry/Breakout Point (D): Approximately 4.49.
Stop Loss: Set at 4,333.59, just below the upper trendline and recent high.
Targets:Target 1: 4,047.34.
Target 2: 3,963.67.
Target 3: 3,651.82.
The price range spans from around 3,250 to 4,500 USDT.
Indicators:The triangle's height (0.619) and the breakout move (4.49) suggest a calculated target projection.
Green and red candlesticks indicate bullish and bearish periods, respectively.
Analysis:The upward breakout from the triangle suggests bullish momentum, with the price potentially aiming for the listed targets.
The stop loss at 4,333.59 is strategically placed to limit downside risk if the breakout fails.
The targets decrease incrementally, indicating a possible profit-taking strategy as the price progresses.

ETH update 9.06.2025Hello everyone, many of you asked me to publish my vision for ETH.
Here you go!
I believe that the previous impulse movement was only the first upward movement, and now we are in a sideways correction movement — call it what you will, but the fact is that the exit from this flat will be upward.
1. End of the year
2. ETH is accumulating on the Onchain
3. Liquidity overflow from BTC can be seen on the ETHBTC chart, and the overflow began at the very bottom
4. What else can large conservative players accumulate?
5. We are going after liquidity from above and should break 4100 by September
Best Regards EXCAVO


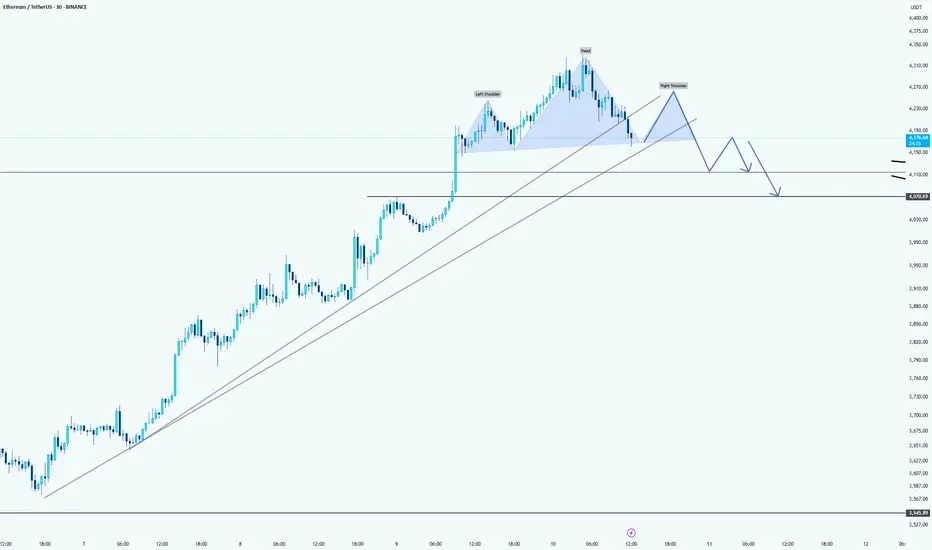
Ethereum: just a little bit correction hereHello guys!
Chart Pattern: Head and Shoulders
The chart shows a Head and Shoulders pattern forming on the Ethereum price action. The trendline drawn across the neckline of the pattern is a crucial support level to monitor.
Potential Breakdown:
If Ethereum fails to hold above the neckline (around $4,130), we might see a pullback and potentially a breakdown from the pattern. This suggests a bearish outlook for ETH in the short term.
Target:
A possible target for this bearish move could be around th e $4,050 - $4,100 range , where the price could find support from the upward trendline (in light gray). The price may retrace towards these levels before deciding whether it will continue higher or confirm further downside.
Uptrend Support:
Ethereum remains in an overall uptrend, as indicated by the sloping upward trendline beneath the price action. If the price pulls back to this trendline and holds, there could still be bullish potential.
$ETH - Secondary Upthrust CRYPTOCAP:ETH | 2h
Possible LTF setup:
- Bounce around 4.1k–4k
- Initial supply retest at 4.2k–4.3k
- Retrace at 4.1k
- Secondary upthrust towards 4.4k–4.5k
local support 4k - holds for bullish continuation
Break below - likely test of 3.8k–3.7k

The key is whether the price can hold above 3900.73-4107.80
Hello, fellow traders!
Follow us to get the latest information quickly.
Have a great day.
-------------------------------------
(ETHUSDT 1D chart)
This period of volatility is expected to last from around August 6th to 14th (maximum from August 5th to 15th).
The key question is whether the price can find support and rise above the 3900.73-4107.80 range after this period of volatility.
The next period of volatility is expected to occur around August 28th, so we need to see if the price can hold until then.
If the price declines, we need to check for support around the HA-High ~ DOM (60) range of 3708.87-3762.33.
If not, there's a chance it could fall below 3265.0-3321.30.
-
(1M Chart)
The TC (Trend Check) indicator has risen above 0, suggesting a high possibility of further upside.
Therefore, the key point to watch is whether it can rise above the 4630.26-4868.0 range.
For an uptrend to continue,
- The StochRSI indicator must remain upward with K > D.
(If possible, it's best to avoid K entering the overbought zone.)
- The On-Board Volume (OBV) indicator of the Low Line ~ High Line channel must remain upward.
(If possible, it's best to maintain OBV > OBVEMA.)
- The TC (Trend Check) indicator must remain upward.
(If possible, it should remain above 0.)
If the above conditions are met, the uptrend is likely to continue.
To sustain an uptrend by breaking above key support and resistance levels,
- The StochRSI indicator must remain below the overbought zone and remain above D.
- The On-Board Volume (OBV) indicator of the Low Line ~ High Line channel must rise above the High Line and remain upward.
- The TC (Trend Check) indicator must remain upward. (If possible, it should remain above the 0 point.)
When the above conditions are met, there is a high probability that the price will rise after breaking above important support and resistance levels.
-
Thank you for reading to the end.
I wish you successful trading.
--------------------------------------------------
- Here's an explanation of the big picture.
(3-year bull market, 1-year bear market pattern)
I will explain more in detail when the bear market begins.
------------------------------------------------------

ETHUSDT 12H chart uptrend1. Breaking out of the downward channel
• Black lines show an earlier inheritance channel.
• The course struck the mountain and it is quite dynamically, which is a strong upward signal.
2. Current price
• ETH is around USD 4,274, just below the resistance at USD 4,304.
• Another resistance is 4,484 USD (potential target if the upward trend persists).
3. Support
• The next support: 4,048 USD - if the course is corrected, then there may be the first "test".
• stronger support below: USD 3,930, $ 3,709, $ 3,487.
4. Indicators
• MacD: MacD line strongly above the signal, the histogram is growing - confirms the upward trend.
• RSI: around 75 - close to the purchase zone, which can mean a short -term correction, but with a strong RSI trend can stay high for a long time.
5. Scenarios
• Bull: Punction and maintenance above USD 4,304 can open the road to 4,484 USD and possibly higher.
• Bear: rejection from USD 4,304 and a descent below 4,048 USD may cause a deeper correction in the direction of $ 3,930 or even $ 3,709.
📌 The short -term market is warmed up, so a small pullback is possible, but the structure looks very bullshit after this burst from the downward channel.

ETH Bearish DivergenceBINANCE:ETHUSDT
Trade Setup:
Target 1: 4,077.09 (0.786 Fibonnaci Golden Zone).
Target 2: 3,922.91 (0.618 Fibonnaci Golden Zone).
Target 3: 3,814.61 (0.5 Fibonnaci Golden Zone).
Target 4: 3,355.71 (0 Fibonnaci).
DCA : 4,397.40 (1.135 Fibonacci)
Stop Loss: 4,523.14 (1.272 Fibonacci).
RSI Analysis: The RSI is showing a bearish divergence, suggesting potential bearish momentum. The current RSI is around 81.56, approaching oversold territory, so caution is advised.

Ethereum Holds Above $4,000: The Start of a New Altcoin Rally?Ethereum (ETH), the largest altcoin by market capitalization, has become the main driver of the current cryptocurrency market surge. Amid Bitcoin dominance falling below its two-year trendline and capital flowing into altcoins, ETH has posted an impressive 20% weekly gain.
After a strong rebound from the $3,354 support level, ETH broke through the key psychological barrier of $4,000, reaching a local high at $4,206. This move has become a clear signal not only for investors but also for traders, who see it as confirmation of a new bullish momentum.
📈 Technical Overview:
ETH broke above its 50-day SMA and consolidated there, strengthening buyers’ positions.
Trading volumes on both spot and derivatives markets increased by 18% compared to the previous week.
RSI and MACD indicators show a growing trend with no signs of overbought conditions.
Bitcoin dominance dropping from 66% to 60% in just two months suggests a capital rotation toward altcoins, with Ethereum—being the sector’s flagship—benefiting the most from this shift.
🚀 What’s Next?
If Ethereum holds the $4,000–$4,050 range as support, the next technical target lies in the $4,450–$4,600 zone. The strengthening trend in the ETH/BTC pair also points to further potential growth, even if Bitcoin moves sideways.
The market is already calling this the beginning of the 2025 Altcoin Season, and Ethereum appears set to be its leading locomotive.

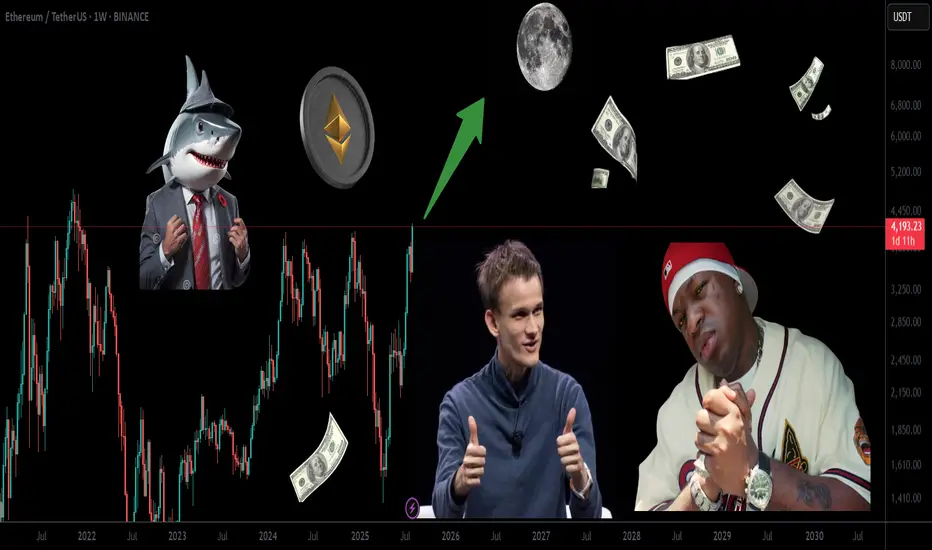
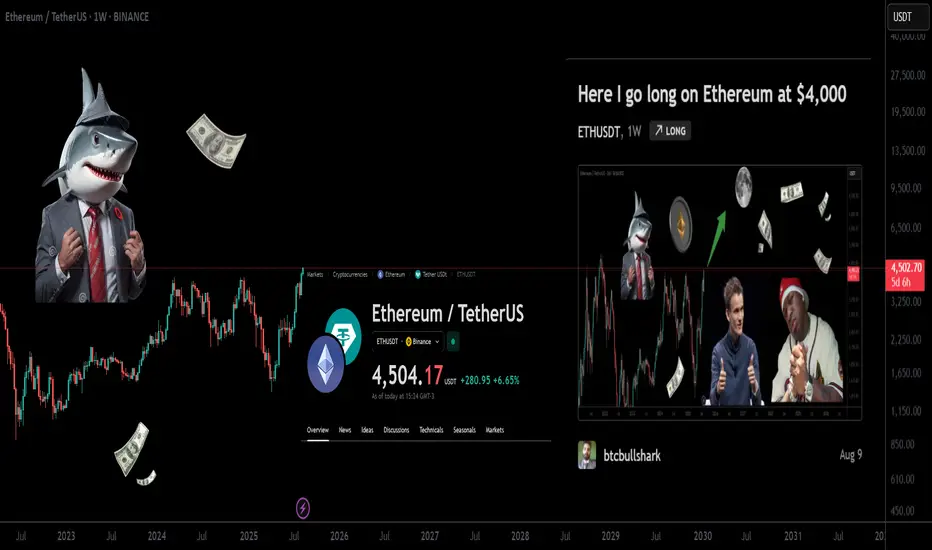
Here I go long on Ethereum at $4,000Here I go long on Ethereum at $4,000
time to make Ethereum great again By borrowing more tethers and placing market orders triggering Ethereum supply shock
right now.
borrowing and placing market orders starting at $4,000.
tether's reserves are hitting Ethereum hard through me here now.
I think I'm triggering the major Ethereum supply shock here now.
THE MAJOR ETHEREUM SUPLLY SHOCK IS HAPPENING HERE NOW.
Cut the random guesses and hopes and just let the pro do it AT THE RIGHT TIME.
MEGA
I wanna make ethereum great again and it's going to be today and it's going to be now. And old btc prices will become new eth prices
Now Ethereum run is officially confirmed by the same director that triggered bitcoin and ripple supply shock.The Martin Scorcese of the market.
birdman sharkman
CASH MONEY HEROES
when i hit ni* hit me full of that caaaash
more money than I seen in a garbage caaan
stunna island money and the power
That's how we do it make it rain make it shower