ETHUSDT

ETH Continues Bullish Momentum Above Broken TrendlineHello guys!
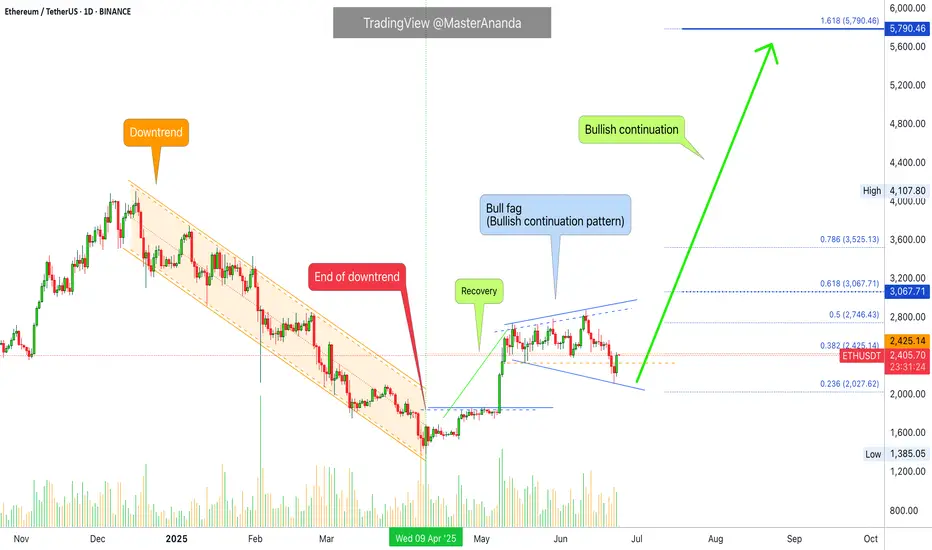
Ethereum has shown a strong bullish rally, breaking through a long-standing descending trendline with significant momentum. Currently, price action is consolidating above the broken trendline, which may now act as a support zone.
🔹 Scenario 1 (Bullish Continuation): If ETH holds above the current range and confirms the broken trendline as support, we could see a continuation toward higher resistance levels around $3,500 and beyond.
🔹 Scenario 2 (Deeper Retest): Alternatively, a pullback toward the $2,200–$2,300 area (highlighted zone) could offer a better accumulation point before the next bullish leg resumes.
This setup suggests that as long as ETH remains above the key support levels, the bullish structure remains intact.

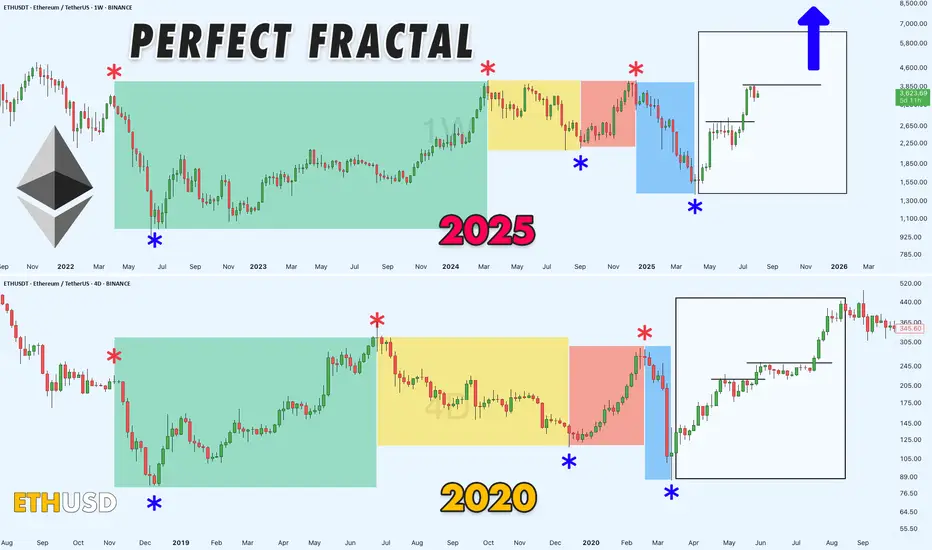
Haven't Posted in a Bit, Here's a Solid Chart for You All!Alright, been a while, but here's the deal: still no altseason in sight.
Meanwhile, ETHUSDT dropping some serious hints of a wild bull run on this fractal chart. It s got that 2020 vibe, though the timing s a tad off especially when you factor in Bitcoin s cycles.
Gonna be a blast watching this play out!
Ethereum vs Small Cap. & The 2025-26 Cryptocurrency Bull MarketThe last three days ended up being a very nice flush, a strong one but the action quickly recovered above the 18-May low.
Ethereum was trading above $2,300 since mid-May and always stayed above this level. It broke suddenly below, out of nowhere, but the action is bullish again. We can say that this was a stop-loss hunt event, a bear-trap and nothing more or else we would see a continuation of the bearish action rather than a strong inverse reaction, a bullish jump.
It is not only Ethereum of course that is experiencing this type of bullish action, some altcoins are going nuts. Really crazy right now producing so much momentum that people are still wondering if the market is going down... Or is it going up?
It is obviously up, just look at the 7-April low.
Ethereum hit a low of $1,385 on 7-April. The higher low yesterday ended at $2,111.
You see what I mean?
The market is ultra-bullish because the last low is so far away. It is impossible that it will be tested even less possible for it to break. Ok, so a market shakeout we agree but now that the shakeout is complete what is supposed to happen next?
Watch the smaller altcoins.
Thank you for reading.
Namaste.
ETH/USDT — Resistance Around $4.0k: Breakout or Rejection?Summary
The weekly chart shows Ethereum testing a multi-year horizontal resistance zone around $3.9k–$4.1k, a level repeatedly tested since 2021. The measured move on the chart projects a potential target of $4,868 — about +$868 or ~21–22% upside — if a confirmed breakout occurs on the weekly timeframe.
---
Technical Analysis (based on chart)
Timeframe: Weekly (1W). The current test is highly significant due to the higher timeframe, with medium- to long-term implications.
Key Levels:
Major resistance zone: ≈ $3,950 – $4,100 (yellow line).
Breakout target: $4,868 (≈ +$868 or ~+21–22% from the breakout zone).
First support if rejected: ≈ $3,300 – $3,600. Stronger support at $2,100 – $2,750.
Price Action: Price has made multiple peaks at this zone (multiple tops), signaling strong supply. However, recent higher lows suggest growing bullish momentum — if a breakout occurs.
Pattern: Multi-year horizontal resistance. Possible outcomes:
Rejection: Acts as a triple-top / horizontal supply zone.
Breakout: Transitions into a range breakout setup with measured target.
---
Bullish Scenario (confirmation needed)
1. Confirmation signal: Weekly close above $4.0k zone with strong follow-through in the next week.
2. Entry strategies:
Conservative: Wait for a retest (resistance → support) before entering, with stop below retest (~$3.7k).
Aggressive: Enter on breakout, stop below breakout candle low.
3. Target: First target ~$4,868 (measured move). If momentum persists, higher targets may be reached.
4. Invalidation: Weekly close back below $3.7k–3.8k after breakout.
---
Bearish Scenario (if rejection occurs)
1. Confirmation signal: Bearish rejection candle (pin bar / engulfing) on weekly + no breakout close.
2. Entry strategies: Short or take profit on longs after confirmed rejection; ideally backed by bearish follow-through next week.
3. Target downside: First support $3.3k–3.6k; stronger drop could retest $2.1k–2.8k zone.
4. Invalidation: Weekly close back above $4.1k with strong bullish volume.
---
Risk Management & Notes
Weekly close is key — avoid reacting solely to intraday wicks.
Volume matters: No volume = higher risk of false breakout.
Position sizing: Keep risk controlled (e.g., 1–2% per trade), stops in logical zones.
Multi-timeframe check: Use daily chart for precise entries and watch for orderflow/news catalysts.
---
Pattern Notes
Multiple Tops / Horizontal Supply: Sellers have consistently defended this level.
Ascending pressure: Higher lows into resistance can increase breakout probability.
Measured Move: Distance from breakout zone to target is about $868 — matching the chart’s projection.
---
Hashtags
#ETH #ETHUSDT #Ethereum #Crypto #Breakout #Resistance #WeeklyChart #CryptoAnalysis #TechnicalAnalysis

$ETH - Rising WedgeCRYPTOCAP:ETH | 4h
Price remains within the ascending wedge on the 4h chart, showing a triple tap on the trendline.
On lower timeframes, watching 3880 as local support for a possible bounce.
Upside levels to monitor are 4120–4215 for potential rejection, though an ideal pullback would see the lower trendline tested at 3770–3680.

ETHUSDTBearish RSI divergence at $4,280 suggests weakening momentum. Possible correction toward $3,981 → $3,786 → $3,373. Liquidity around $3,000 could attract price before the next leg. I expect a pullback before any strong bullish continuation.
BINANCE:ETHUSDT.P

$ETH - New monthly Signal! Been focusing heavily on CRYPTOCAP:ETH lately — price action remains clean, easy to read, and primed for a push into new highs.
By now, most of you should already have a solid position in $Ethereum. We’ve been calling some great entry spots, and if you’re still indecisive… this might be your last real chance.
The $3,400 zone held strong, and in my opinion, that’s the low for the next couple of months. We’ve also just triggered a fresh monthly signal inside this massive multi-month consolidation. If you’re expecting lower prices, you might be waiting a long, long time.
I’ve been eyeing the possibility of $10K since last month’s breakout opened the gate. Keeping our analysis grounded, $7K is the realistic target we should see this year — maybe even within the next two months.
Until the signal expires or the target is hit… keep holding.

Ethereum Hits a New All-Time High? Altcoins Bull MarketEthereum just hit its highest price since December 2024. Here is the thing, first XRP moves forward and we know the rest of the market will do the same. We saw this happen with Bitcoin Cash, it just kept on moving straight up and with this we knew the rest of the market to do the same. Then we have Litecoin and now Ethereum keeps on going higher. What one does, the rest follows.
Crypto will continue to grow; the altcoins will continue to grow and because the altcoins are growing Bitcoin will also continue growing. The altcoins growing and moving forward confirms that Bitcoin's top is not in, far from this being the case. So, Ether will continue to grow, Bitcoin will continue to grow and the smaller altcoins will follow.
Watch Solana go next and Dogecoin. Litecoin will be big of course. If you buy Litecoin now below $200, you will do good when Litecoin trades at $1,000 plus. The thing is that the next advance will change everything with the ETFs. Each time there is a bear market there is a crash and flush you can always buy again at market bottoms and lows. When a Crypto gets ETFs, corrections will not be the same. Demand will be too strong and we will experience long-term growth. Something like how Bitcoin is behaving now but also on some major altcoins. There will continue to be and appear new variations across the market. The altcoins will separate into different groups and cycles. The broader market cycle will continue to evolve. Things will never stay the same. Change is the only constant.
Namaste.

ETH/USDT 12h chart1. Punction of the downward trend
• The black inheritance trend line has been broken up - this is a strong signal of Bycza.
• Breaking was confirmed by a strong candle movement and high growth dynamics.
⸻
2. Key levels of support and resistance
• Support:
• 3930 USDT - previous resistance, now the defensive zone with possible correction.
• 3709 USDT - deeper support.
• 3488 USDT - critical support, below which the upward trend would be negated.
• resistance:
• 4048 USDT - current local resistance (the candle touched and lightly reflected).
• 4304 USDT - another strong resistance.
• 4484 USDT - long -term resistance and potential goal when continuing to grow.
⸻
3. RSI
• RSI is around 70 - close to the purchase zone.
• suggests the possibility of a short correction or consolidation before the upward trend continues.
⸻
4. Scenarios
Bycza (continuation of growth)
• Maintenance above 3930 USDT.
• Breaking over 4048 USDT opens the road to around 4300–4480 USDT.
Bear (correction)
• Rejection to USDTT 4048 and a decrease below 3930 USDT may bring a rate to around 3709 USDT.

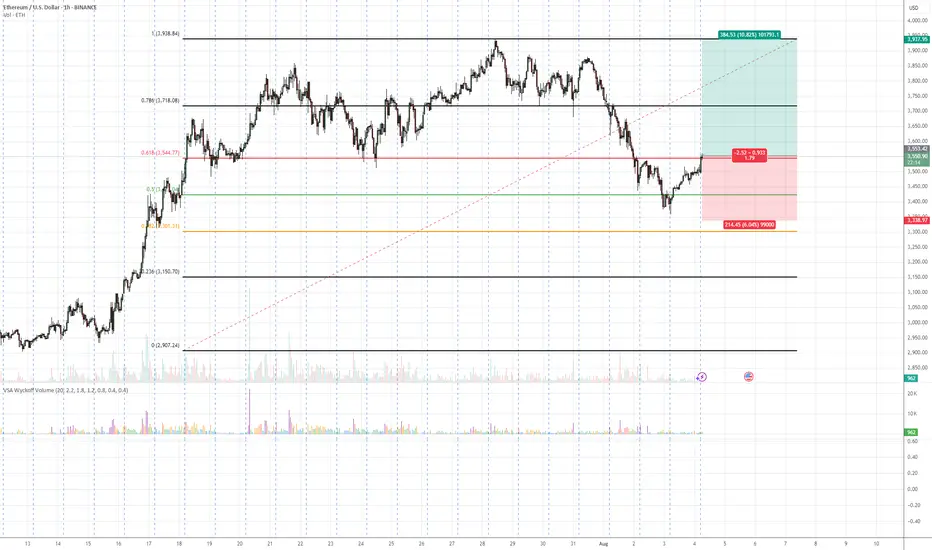
ETH/USDT – Bullish Reversal Potential from Fibonacci Confluence 💡 Idea:
Ethereum is showing signs of demand absorption at a critical Fibonacci support cluster (0.5 – 0.618 retracement). VSA patterns confirm that selling pressure is being absorbed, hinting at a possible markup toward previous swing highs.
📍 Trade Setup:
Entry: Current levels near 3,551
Target: 3,937 (+10.82%)
Stop Loss: 3,338 (below last absorption zone)
R:R Ratio: ~1.79:1
📊 Technical Reasoning (VSA)
1. Stopping Volume at Fibonacci Support
ETH tested the 0.5–0.618 retracement zone from its prior bullish impulse.
Wide spread down-bars on high volume failed to produce significant downside progress, signaling professional buying.
2. No Supply Confirmation
Following the stopping volume, the market printed narrow range candles on decreasing volume, indicating supply exhaustion.
3. Demand Emergence
The recent push above short-term resistance came with increasing volume and wider up-bar spreads, suggesting the start of an accumulation-to-markup transition.
4. Structure & Fibonacci Confluence
Current rally aligns with the Fibonacci golden zone and past structural support.
📌 Trading Plan:
Enter on confirmed breakout above minor resistance with volume expansion.
Scale out partial profits near 3,800 and let remainder ride toward 3,937.
Keep stop below 3,338 to avoid being shaken out by false breakouts.
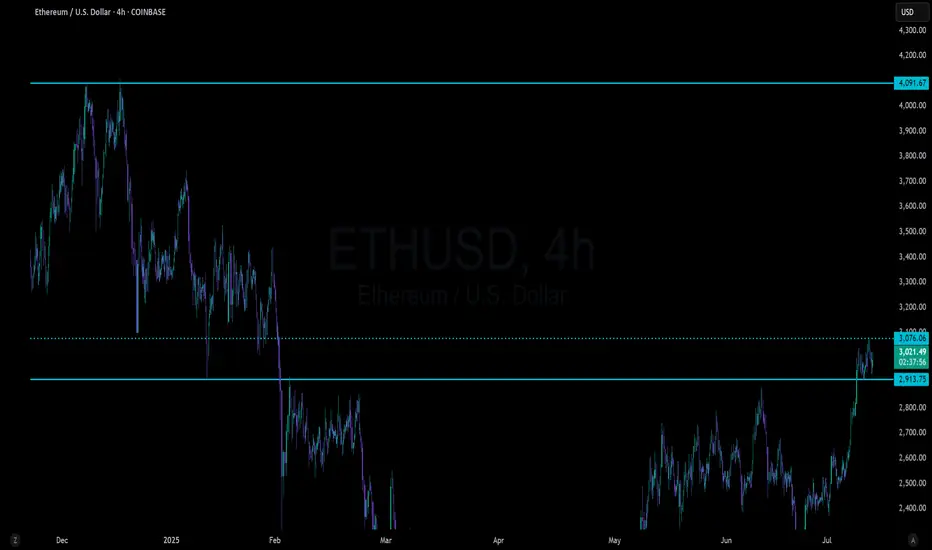
ETH broke a nearly 4 year resistance levelLooking at Ethereum on the daily or weekly Logarithmic chart you can see resistance being consistent since Nov 8th, 2021.
Today, Ethereum has broken through. It was brief, it was fast and it was so small that you can't even see it when zoomed out so far to see the multi year down trend.. However, if you take a look at ETH on the 4hr chart you can see it.
I don't know how ETH will react when breaking such a long downtrend and I look forward to finding out. A retest of the all time high from here seems plausible after such a long downtrend.

Ethereum breakoutEthereum monthly chart shows a clear breakout above the 3800 resistance, targeting 8k.

ETH | Ethereum Game Plan - Swing Long IdeaETH | Ethereum Game Plan - Swing Long Idea
📊 Market Sentiment
Market sentiment remains bullish, supported by expectations of a 0.25% rate cut at the upcoming FOMC meeting. The weakening USD and rising risk appetite across global markets are favoring crypto assets in particular.
📈 Technical Analysis
Price swept the range low (Weekly Fair Value Gap), resulting in a deviation.
It then aggressively reclaimed higher levels and closed above key resistance.
A 12H demand zone was formed during this move.
We’re now seeing a retracement towards that 12H demand zone.
📌 Game Plan
I’m looking for price to hit the 12H demand zone at $3,530 and show a strong reaction.
This level is also below the 0.5 Fibonacci retracement, placing it in the discount area — an ideal entry zone for me.
🎯 Setup Trigger
After price taps the demand zone, I want to see a 1H–4H bullish break of structure to confirm the reversal before entering.
📋 Trade Management
Stoploss: Below 1H–4H swing low
Targets:
• TP1: $3,872
• TP2: $4,090
I’ll trail my stop to lock in profits aggressively as price moves in my favor.
💬 Like, follow, and comment if this breakdown supports your trading!
More setups and market insights coming soon — stay connected!

ETH Testing Critical $4K Resistance!BINANCE:ETHUSDT is trading inside an ascending triangle on the weekly chart, with price compressing between the resistance line and a rising support line. After a strong rally from the $1,500 demand area, ETH has reclaimed the 100- and 200-week EMAs and is testing the triangle’s upper trendline with increasing volume.
A weekly close above $4,000–$4,200 would confirm a triangle breakout and open upside toward $6,000–$7,500, while a rejection could send price back toward $3,200–$3,000 for further consolidation. Wait for a clear weekly close and volume confirmation.
Cheers
Hexa
BITSTAMP:ETHUSD CRYPTOCAP:ETH

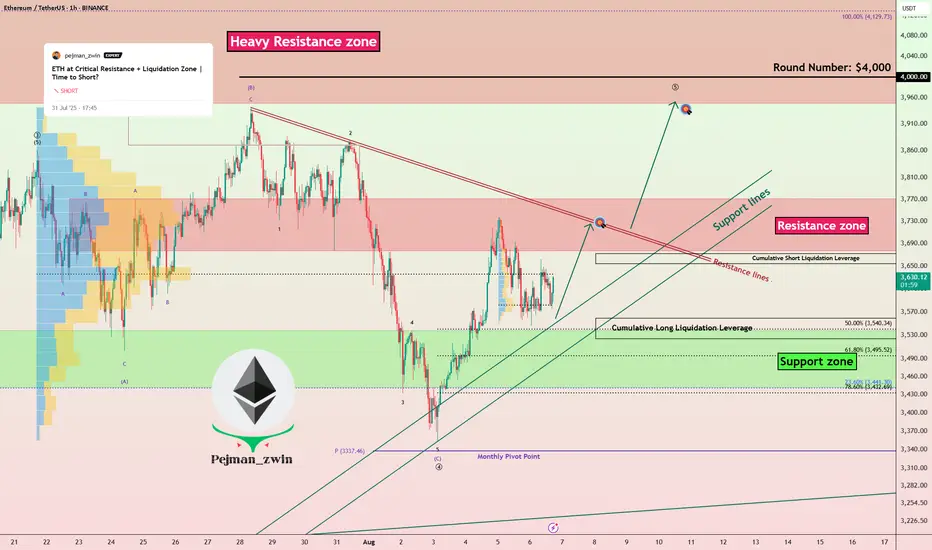
Ethereum Ready to Attack Resistances — Time to Long ETH?Ethereum ( BINANCE:ETHUSDT ) fell to the Support zone($3,538-$3,442) and Support lines as I expected in the previous idea .
Ethereum is currently trading near the Support zone($3,538-$3,442) , Support lines , and Cumulative Long Liquidation Leverage($3,559-$3,524) .
In terms of Elliott Wave theory , it seems that Ethereum has completed the main wave 4 . The main wave 4 has an Expanding Flat structure(ABC/3-3-5) . To confirm the main wave 4, we must wait for the Resistance zone($3,771-$3,677) and Resistance lines to be broken.
I expect Ethereum to trend higher in the coming hours and attack the Resistance lines and Resistance zone($3,771-$3,677) .
Cumulative Short Liquidation Leverage: $3,672-$3,645
Note: Stop Loss: $3,450 =Worst
Please respect each other's ideas and express them politely if you agree or disagree.
Ethereum Analyze (ETHUSDT), 1-hour time frame.
Be sure to follow the updated ideas.
Do not forget to put a Stop loss for your positions (For every position you want to open).
Please follow your strategy and updates; this is just my Idea, and I will gladly see your ideas in this post.
Please do not forget the ✅' like '✅ button 🙏😊 & Share it with your friends; thanks, and Trade safe.
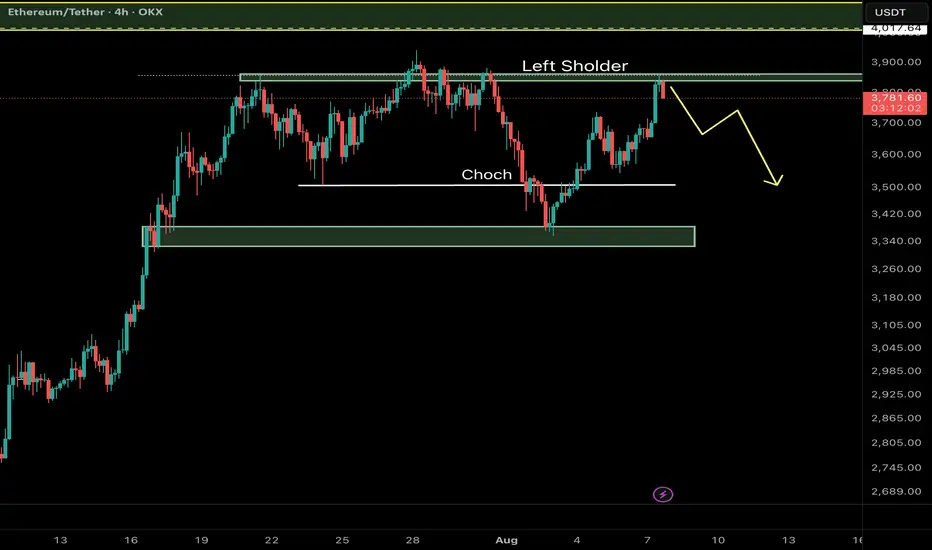
Ethereum (ETH/USDT) – Key Reversal Zone RetestAfter a major CHoCH (Change of Character) on the 4H timeframe, Ethereum has shown a strong bullish move from a high-probability demand zone and is now retesting a critical resistance area aligned with the Left Shoulder of a classic RTM pattern.
⸻
🔍 Key Technical Elements:
• CHoCH confirms the shift from a distribution phase to accumulation.
• Strong reaction from a demand zone near $3,340–$3,380.
• Price is now testing the Left Shoulder, which often acts as a reaction zone before continuation.
⸻
📌 Potential Scenarios:
🔼 Bullish Case (Primary):
If ETH breaks and closes above $3,870, a move toward the next liquidity pool around $4,010–$4,050 is likely.
🔽 Bearish Case (Alternative):
Failure to hold above the current resistance may lead to a pullback toward the $3,340–$3,380 demand zone for another accumulation attempt.
⸻
💡 Educational Note:
In RTM methodology, retests of the Left Shoulder after CHoCH are considered one of the most efficient entry zones — especially when confluence with liquidity voids or imbalance exists.
Follow for more Smart Money & RTM insights.
Ethereum Long Trigger Just Got Valid — Don’t Miss This SetupHey, it’s Skeptic from Skeptic Lab.
In this breakdown, we’re looking at a fresh long opportunity on Ethereum after a clean 45% move from our last trigger.
I’ll walk you through the daily and 4H timeframes, explain why the correction looks weak, and where the next breakout trigger is setting up.
Plus, I’ll show you how ETHBTC can help confirm the move and improve your risk/reward.
If this gave you clarity or value, give it a boost — and I’ll catch you in the next one.
Disclaimer: This is not financial advice. Always do your own research before making any trading decisions.

Ethereum ETH at Key Resistance: Here's My Trade PlanEthereum (ETH) has maintained a fairly bullish structure overall 🟢, but price is now trading into a significant resistance level 🧱📈. I’m closely monitoring for a reaction at this zone — ideally a rejection that leads to a pullback into a key support area 🔄📉.
If ETH finds support and we get a clean bullish break in market structure from there 📊🚀, that could present a high-probability setup to the long side — contingent on price action confirming the bias. 🔍 Not financial advice ⚠️.


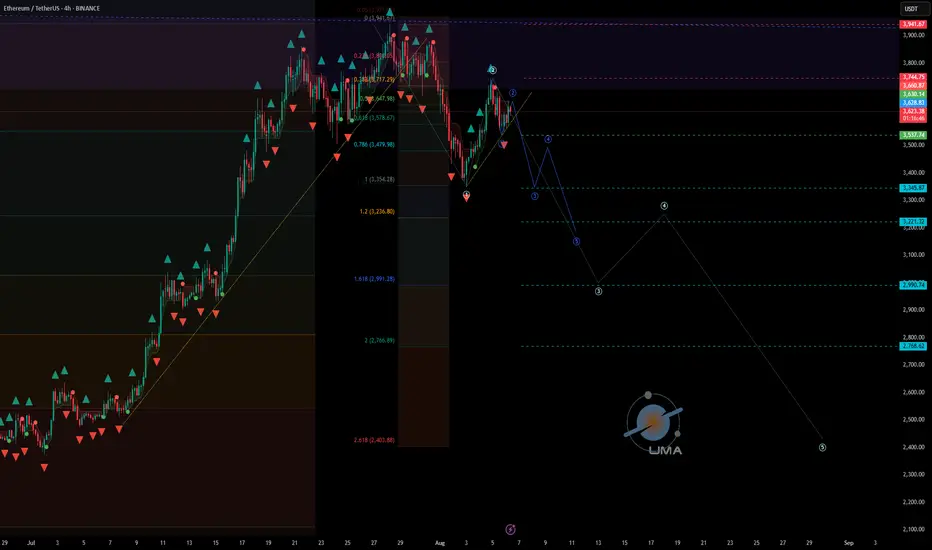
ETHUSDT - UniverseMetta - Analysis#ETHUSDT - UniverseMetta - Analysis
Potential reversal & correction setup in progress
📆 W1 – Weekly Timeframe
🔹 Price is testing a major monthly resistance zone, from which price has previously rejected toward the lower edge of a large triangle structure
🔹 According to the 3-wave structure, ETH has reached 161% of Wave 1 and closed above the 200% Fibo level
🔹 If the price fails to make a new high this week, a top fractal may form — a possible signal for a medium-term correction
📉 D1 – Daily Timeframe
🔹 A double top pattern is forming, along with a potential retest of the trendline
🔹 If confirmed, this could trigger a 3-wave correction structure downward
🔹 A downward fractal is already printed — adding confluence to the bearish scenario
🎯 Correction targets:
• $3,242
• $2,546
⏳ H4 – 4H Timeframe
🔹 Current price action suggests a correction from the recent impulse
🔹 A 3rd wave may initiate upon trendline breakout
🔹 Entry confirmation may come from breakout + retest, or via confirmed double top structure
🔹 Stop should be placed above the high of Wave 1 (H4)
🎯 Trade Setup:
Entry: 0.64930
TP: 0.65404 - 0.65700 - 0.66164 - 0.66676
Stop: 0.64482
‼️ Risk should not exceed 1–3% of your portfolio
This signal/idea is not financial advice
📌 Key Fundamental Triggers to Watch:
🔹 Federal Reserve expectations – a dovish shift could support ETH short-term, but failure to materialize may drive a pullback
🔹 ETH ETF news – updates on applications, approvals, and volume flows can significantly impact sentiment
🔹 Correlation with NASDAQ/S&P500 – weakness in equities could drag crypto lower
🔹 On-chain activity – declining gas usage or demand may indicate lower network utility and bearish pressure
🔹 Weekly overbought condition – many technical indicators (RSI, MACD) point to overextension
ETH/USDT 15m SETUP.ETH/USDT 15m Setup 🚀
Price is approaching a clean POI (Order Block + Imbalance zone).
Expect a short-term dip into the zone followed by a bullish reaction.
📌 Trade Idea:
Wait for price to tap the POI
Look for bullish confirmation
Target upside continuation after liquidity grab & structure shift
High probability long setup incoming!
