$ETH at Crucial SupportThe market took a hit - total cap fell from $4.28T to $3.5T, and CRYPTOCAP:BTC is testing support near $103,800. We’ve seen this setup before: panic, whales moving coins, fear everywhere. Yet November often flips sentiment fast - historically, Bitcoin averages +40% this month.
Ethereum is under heavier pressure, possibly heading toward $2,700-2,500 zone. $3,300 remains the key level to watch staying above it keeps the momentum alive, but a break below could open the door to downside pressure.
But these shakeouts often reset the market before the next trend begins - and when liquidity returns, Ethereum usually leads the rebound.
The crypto market is bleeding, major assets like CRYPTOCAP:BTC , CRYPTOCAP:ETH and others have been slipping while liquidity pulls back and sentiment cools.
The total market cap has dipped; multiple large‑cap coins are down over the last 24 hours. We’re possibly entering a phase where panic gives way to opportunity, but timing and tone matter. What’s your move: sit tight, buy the dip, or wait for a clearer signal?
ETHUSDT

ETHUSDT 4-Hour Chart Analysis. ETHUSDT 4-Hour Chart Analysis.
ETH is forming a falling wedge, a typically bullish reversal pattern, with price just above strong support ($3,389, orange line).
RSI: The indicator is showing bullish divergence—price is making lower lows, but RSI lows are rising, hinting at possible reversal.
Expect further consolidation or small dips toward wedge support, followed by a breakout attempt.
On breakout, resistance is at $3,900–$4,100, then $4,830 as the next major target.
ETH is holding above support and showing bullish RSI divergence. Watch closely for wedge breakout—this could trigger a strong rally if confirmed.
DYOR | NFA

ETH/USDT 1W Chart📊 Market Structure:
Main Trend: Still up (higher lows and highs pattern persists).
Current Phase: Correction in an uptrend.
Local Trend: Down for several weeks (series of red weekly candles).
⚙️ Key Support and Resistance Levels:
Resistance (green lines):
4,753 USDT – recent local high, very strong resistance.
4,373 USDT – previous consolidation level, currently a supply zone.
3,979 USDT – current key local resistance, which previously served as support.
Support (red lines):
3,600 USDT – currently tested support level (coincides with the uptrend line).
3,165 USDT – next strong support level (previous local lows).
2,740 USDT – strong long-term support, potential target for further correction.
📈 Trendline:
The black uptrend line connects successive higher lows since April 2024.
The current weekly candlestick is testing this line (confluence with support at 3,600 USDT).
Maintaining this line = still a bullish medium-term scenario.
A breakout and weekly close below ~3,580–3,600 USDT → a signal of a possible trend reversal.
📉 Volume:
Downward volume is increasing, indicating supply pressure.
A lack of strong demand candlesticks = buyers are cautious in this zone.
🔄 Stoch RSI Oscillator (bottom of the chart):
Located in the oversold zone (below 20).
The %K (blue) and %D (orange) lines are starting to converge → a possible rebound signal in the coming weeks if a crossover occurs upwards.
🧭 Scenarios:
🟢 Bullish
Holding support at 3,600 USDT + trendline.
Confirmation with a bullish candle with higher volume.
Target: Return to 3,980 → 4,370 USDT.
🔴 Bearish:
Closing the week below 3,580 USDT (trendline + support).
Potential decline to 3,165 USDT, and even 2,740 USDT beyond.
RSI and volume suggest that downward pressure remains significant.
📌 Summary:
Key level: 3,600 USDT → decisive point for the market's further direction.
Short-term: Still downward pressure, but a technical rebound is possible (Stoch RSI).
Medium-term: The uptrend has not reversed until ETH closes below the trend line and 3,550 USDT.

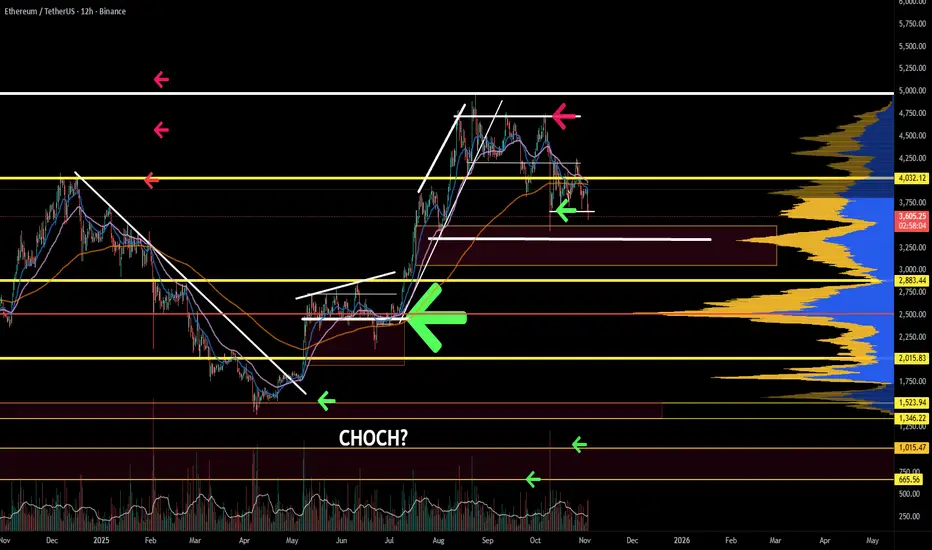
ETHEREUM getting a spanking but its not over yetETH is in a downtrend; however, the structure looks retracive, which means that a corrective move would be almost over. If it is not, this means the price will break structure and fall further down. If the objective is to hunt liquidity, expect further downside.
Ethereum Analysis – November 03, 2025Welcome to DIBA PRISM Daily Analysis 💫
Ethereum is currently in a bullish phase 📈 — compared to its previous market cycles and Bitcoin’s recent performance, ETH still shows room for further upside 🚀
Right now, Ethereum is in a corrective phase, and if it forms a higher low relative to the previous one, we can start looking for potential entry points 🎯
At the moment, price has reached a key zone, so it’s best to wait and observe Ethereum’s reaction before making any move 👀
Patience and timing will be the keys to catching the next big move ⚡
Disclaimer:
This content is for informational purposes only and does not constitute financial or investment advice. © DIBAPRISM
Larry D.Kohn

ETH/USDT Swing Trade | Heikin Ashi Confirmation + Pullback Plan🚀 ETH/USDT: The Great Crypto Heist — Swing/Day Trade Wealth Strategy! 🤑
Ladies and Gentlemen, welcome to the Thief’s Master Plan for ETH/USDT (Ethereum vs. Tether)! 🎩 This is a fun, professional, and calculated swing/day trade setup designed to catch the bullish wave while dodging the traps. Let’s break down this heist with style, precision, and a sprinkle of humor! 😎
📊 Asset: ETH/USDT (Ethereum vs. Tether)
Market: Crypto (High Volatility, High Reward!)
Strategy: Swing/Day Trade with a Thief’s Layered Entry approach
Vibe: Bullish, sneaky, and ready to outsmart the market! 🦹♂️
🧠 The Plan: Bullish Breakout with Technical Confirmation
✅ Bullish Confirmation: We’re riding the bullish wave with a Triangular Moving Average (TMA) pullback. This confirms the trend direction and filters out noise.
✅ Heikin Ashi Magic: A strong bullish Heikin Ashi candle signals momentum. Watch for smooth green candles to confirm the trend’s strength! 📈
🔑 Key Insight: The TMA pullback combined with Heikin Ashi gives us a high-probability setup for a breakout. Stay sharp, Thieves!
🚪 Entry: The Thief’s Layered Approach
🕵️♂️ Strategy: Use a layered entry (multiple buy limit orders) to scale into the trade like a true market bandit!
📍 Entry Levels:
Buy Limit @ $4250
Buy Limit @ $4300
Buy Limit @ $4350
Buy Limit @ $4400
💡 Pro Tip: Feel free to add more layers based on your risk appetite! Stack those orders like a master thief stacking loot. 💰
⚠️ Note: You can enter at any price level within this range if you spot momentum. The layered approach maximizes flexibility!
🛑 Stop Loss: The Thief’s Escape Route
🚨 Stop Loss: Set at $4150 to protect your loot.
⚠️ Thief’s Disclaimer: This is my suggested stop loss, but you’re the boss of your own heist! Adjust based on your risk tolerance. Don’t get caught by the market cops! 👮♂️
🎯 Target: Steal the Profits, Dodge the Trap!
🏦 Target Price: Aim for $4700 as our primary profit zone.
🚨 Resistance Alert: A police barricade (strong resistance) lurks around $4800. This level is overbought and a potential trap for greedy thieves. Cash out early to secure your gains!
💡 Pro Tip: Don’t get too greedy — take profits at your own discretion. The market is full of traps, so escape with your loot! 🏃♂️
👀 Related Pairs to Watch
Keep an eye on these correlated pairs to confirm market sentiment and strengthen your setup:
BTCUSDT ($): Bitcoin often leads the crypto market. If BTC is pumping, ETH is likely to follow. Watch for BTC breaking key resistance at $60,000 for added bullish confirmation.
ETHBTC: This pair shows ETH’s strength relative to BTC. A rising ETH/BTC ratio suggests ETH is outperforming, reinforcing our bullish bias.
SOLUSDT ($): Solana often moves in tandem with ETH. A breakout in SOL above $150 could signal broader altcoin strength.
Key Correlation: ETH’s price action is tightly linked to BTC and overall market sentiment. Monitor BTC’s trend and crypto market cap for context.
🔍 Key Points & Why This Setup Works
TMA Pullback: Acts as a dynamic support zone, ensuring we enter after a healthy retracement.
Heikin Ashi Confirmation: Filters out choppy price action, giving us clear bullish signals.
Layered Entries: Spreads risk and allows flexibility in volatile markets.
Risk Management: Tight stop loss at $4150 keeps the risk-reward ratio attractive.
Market Context: Crypto markets are volatile, but ETH’s bullish structure and correlation with BTC make this a high-probability trade.
📝 Thief’s Code: Risk Management
Dear Ladies and Gentlemen (Thief OGs), this is a fun strategy, but trading is serious business! 🕴️
Set your own stop loss and take profit based on your risk tolerance.
Never risk more than you can afford to lose — this is a heist, not a gamble!
Stay disciplined, and don’t let the market cops catch you off guard! 🚓
“If you find value in my analysis, a 👍 and 🚀 boost is much appreciated — it helps me share more setups with the community!”
Disclaimer: This is a Thief-Style trading strategy crafted for fun and educational purposes. Always do your own research and trade at your own risk. The market is a wild place — stay sharp, Thieves! 🦹♂️
#ETHUSDT #CryptoTrading #SwingTrading #DayTrading #ThiefStrategy #Bullish #TechnicalAnalysis #HeikinAshi #TradingView

ETHUSDT: Short-Term Pullback Toward Trendline Before PotentialHi guys!
On the current 1h chart, Ethereum shows a clear structure of recovery following a liquidity sweep marked as “Hunting happened.” This move indicates that liquidity below the previous lows has already been collected, creating a potential base for a short-term bullish correction.
Price is currently consolidating above a minor support zone (highlighted in pink), showing a possible accumulation phase. The projected path suggests a potential bullish move toward the major supply zone around $4,080–$4,180, which aligns with the descending trendline acting as dynamic resistance.
However, given the overall bearish market structure and the dominance of the descending trendline, the area around $4,100 could serve as a strong reaction zone. A rejection from this level would likely confirm continuation of the broader downtrend, with a possible retracement toward the $3,700–$3,750 area.

the real question is what happens to $ETH at ATH?eth is currently holding above the quarter channel with resistance above between 3500-ATH
there is a potential moonshot to 7k and beyond (13k?), if the markets are indeed in the infant stage of a bull run.
for now eth is heading towards the golden pocket of the move down with support from ath avwap
as htf bullish market structure never broke this could mean that the highs are ran, rsi has bounced the mid point and could be cruising towards the cook zone again, its here i will watch to see a divergence form when the 3M OB and yearly level is approached.
upside 3500, 4500/ATH, 7000, 130000
downside 1900, 1200, 800
its quite possible that we put in a long term range drifting between 5k and 1k before we see expansion upwards
nfa, just food for thought on the htf but most of the volume is supporting price.

Can Ethereum’s Capital Flow Blueprint Target 4600 Next?🎯 ETH/USD "The Liquidity Thief" Strategy 💰
Weighted MA Pullback + Manipulation Grab Blueprint
📊 TRADE SETUP OVERVIEW
Asset: ETH/USD (Ethereum vs USD) | Timeframe: Swing Trade
Market Structure: Bullish Confirmation with WMA Pullback Recovery
Strategy Type: Multi-Layer Accumulation (Thief-Style Entry Method)
🎪 THE GAMEPLAN
Bias: 🟢 BULLISH — Confirmed via:
Weighted Moving Average (WMA) acting as dynamic support
Liquidity pool identification on pullback zones
Institutional accumulation patterns detected
This setup thrives on pullback retracements where smart money accumulates before the next leg up. We're essentially "stealing" liquidity at discount prices during these inefficiency windows.
🚀 MULTI-LAYER ENTRY STRATEGY (The Thief Approach)
Instead of FOMO market orders, we deploy calculated limit order layers at strategic support zones:
Entry Levels (Layer-by-Layer Accumulation):
Layer 1: $3,700 USD
Layer 2: $3,800 USD
Layer 3: $3,900 USD
(Pro Tip: Scale these layers based on your risk tolerance and account size. Tighter layers = more fills; wider layers = better average price)
Position Building: Fill partial positions at each layer, building your total exposure gradually. This reduces average entry cost and maximizes probability of initial profit.
🛑 STOP LOSS (Risk Management)
Hard Stop: $3,500 USD
⚠️ Important Disclaimer: This is YOUR trading decision. No strategy guarantees profits. Position sizing and risk management are YOUR responsibility. Never risk capital you can't afford to lose.
🎯 TARGET & EXIT STRATEGY
Primary Target: $4,600 USD
Exit Rationale:
Strong resistance zone confluence
RSI/Stochastic overbought divergence
Liquidity trap zone (potential reversal catalyst)
💡 Golden Rule: Lock in profits at $4,600 or take partial profits at resistance. Never hold through key resistance on swing trades—greed kills thief traders.
⚠️ Disclosure: Risk management and profit targets are trader-dependent. Adjust based on your strategy framework, market conditions, and account allocation.
📈 CORRELATED PAIRS TO WATCH
Monitor these assets for confluence signals and capital flow indicators:
BITSTAMP:BTCUSD (✅ High Positive Correlation) — Bitcoin sets market sentiment; ETH typically follows in lockstep. When BTC rallies, altcoins like ETH amplify the move upward.
BINANCE:ETHBTC (⚖️ Relative Strength) — ETH strength against BTC equals altseason confirmation. Rising ETHBTC ratio means Ethereum is outperforming Bitcoin—bullish for our setup.
$SPY/ IG:NASDAQ (📊 Risk Appetite) — Traditional equity weakness creates crypto pullback risk. If stocks dump, crypto usually follows. Monitor US market opens for confirmation signals.
TVC:DXY (Dollar Index) (⚖️ Inverse Correlation) — Strong dollar = crypto headwind; weak dollar = tailwind for ETH. A declining DXY supports crypto rally scenarios.
COINBASE:USDTUSD (🔒 Stablecoin Flow) — USDT accumulation signals capital waiting for entry. Rising USDT on exchanges = dry powder ready to deploy into altcoins like ETH.
Capital Flow Blueprint: When BTC holds above support AND USDT shows inflow, altcoins like ETH enter "hunter mode."
🔑 KEY TRADING PRINCIPLES (Thief OG Edition)
✨ Patience — Wait for pullback confirmation before layering in
✨ Position Sizing — Risk only 1-2% per trade; 3% absolute maximum
✨ Confluence — Entry + Support + Volume + Correlation = Green Light
✨ Discipline — Exit at target or stop loss; no emotional HODL mode
✨ Adaptation — Markets evolve; update bias if structure breaks
If you find value in my analysis, a 👍 and 🚀 boost is much appreciated — it helps me share more setups with the community!
#ETH #ETHUSD #Ethereum #CryptoTrading #TechnicalAnalysis #SwingTrading #CryptoDCA #TradingStrategy #LayerEntry #LiquidityZones #AltSeason #CryptoAnalysis #TradeSetup #RiskManagement #Thief #CommunityDriven

Will Ethereum’s tight range lead to a breakout? | Day 34☃️ Welcome to the cryptos winter , I hope you’ve started your day well.
⏰ We’re analyzing BTC on the 1-Day timeframe .
👀 Ethereum on the daily timeframe. Ethereum is currently inside a box-like structure in a trading range format. The top of this trading range is in the $4,161 area, and the bottom of this trading range is in the $3,801 price area, where by breaking these zones, Ethereum can start a stronger and more impulsive leg of movement.
🧮RSI oscillator, which has now formed two important oscillation zones for us — one around 54, which overlaps with our long trigger, and the other around 40, which overlaps with our short trigger. The fluctuation limit crossing these zones can give more momentum to Ethereum’s next move on the daily timeframe.
🕯 Ethereum’s volume, after the flash crash the market experienced, has increased sharply, but the tendency has been pushed toward selling pressure, which has caused Ethereum’s corrections to always come with selling pressure.
📈 For Ethereum positioning, the specified zones have high price action validity, where you can set alerts so that if the price reaches these zones, you can open a position. Or, in the multi-timeframe, you can find the identified support and resistance zones and open positions with lower risk around these areas, moving toward anticipating higher or lower levels, so that in each level, you can add some risk to your position.
❤️ Disclaimer : This analysis is purely based on my personal opinion and I only trade if the stated triggers are activated .

ETH Ethereum Analysis: Waiting for Confirmation at a Key Level📊 Currently analyzing Ethereum (ETH) — on the 4H timeframe, price action has broken structure and tapped into a major external range high, aligning perfectly with a significant resistance zone. ⚡
When we zoom into the 30-minute chart, applying tools like the Anchored VWAP and Volume Profile, we can clearly observe a deep retracement beneath both the VWAP and a key value area. This suggests a period of indecision where price could break in either direction — 🚀 a clean breakout above may trigger a long opportunity, while a rejection and move lower could present a short setup.
At this stage, patience is key — we’re simply waiting for the market to reveal its hand before committing to a bias. 🎯
📉 Disclaimer: This analysis is for educational purposes only and not financial advice. Always conduct your own research before trading.

Ethereum Analysis (2H)In the lower timeframes, after the major dump forming wave A, it seems that wave B has developed as a diametric pattern, with one remaining leg wave g. Wave g is bullish and could target the levels marked on the chart:
targets : 3920$ - 4038$ _ 4142$
The green zone represents the entry area, which is likely to be retested.
For risk management, please don't forget stop loss and capital management
When we reach the first target, save some profit and then change the stop to entry
Comment if you have any questions
Thank You

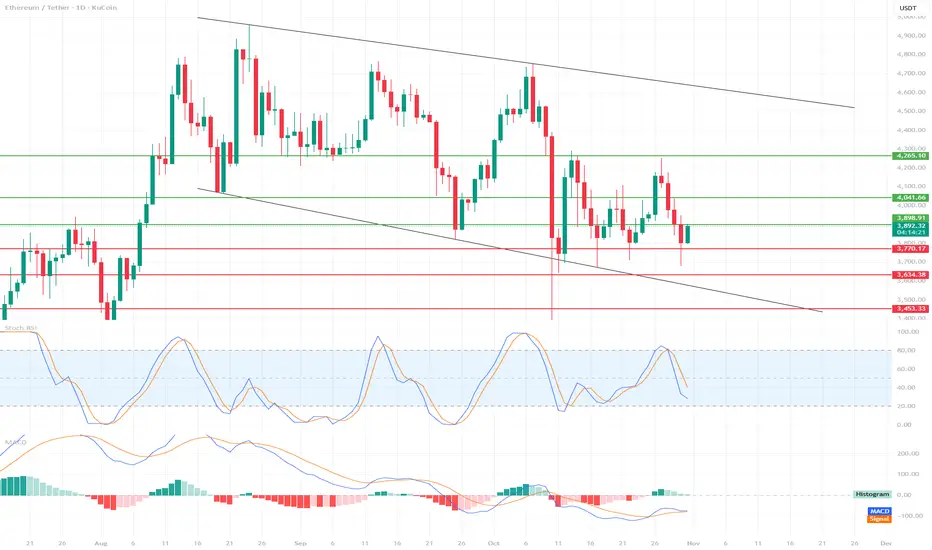
ETH Tests Support – Is This the Beginning of a Rebound?📉 Market Structure
We see a descending channel, bounded by two black trend lines.
Upper Boundary: ~$4,700
Lower Boundary: currently around $3,700, representing strong dynamic support.
The price is currently hovering slightly above the lower edge of the channel, suggesting a possible rebound, but the market remains in a medium-term downtrend.
🔍 Support and Resistance Levels
Support:
$3,770 → currently being tested, crucial in the short term.
$3,643 → next strong support from previous lows.
$3,453 → last line of defense against a steeper decline.
Resistance:
$3,889 → closest resistance, current local ceiling.
$4,041 → strong resistance resulting from prior consolidation.
USD 4.265 → a line that, if broken, could signal a change in the medium-term trend.
📊 Technical Indicators
Stochastic RSI
Located near the oversold zone (below 20), with a slight upward curve.
🔹 Signal: Potential upside move (bounce) in the short term if the %K and %D lines cross upward.
MACD
The MACD line is slightly below zero, but is starting to curve upward and may soon cross the signal line.
🔹 The histogram is starting to decline on the negative side – this is often an early bullish signal (possible change in momentum).
⚖️ Scenarios
🔹 Bullish
If ETH holds above USD 3,770 and the Stoch RSI confirms the rebound, a possible move towards:
3,889 → USD 4,041 → USD 4,265.
A break above USD 4,265 could open the way to USD 4,500+ (upper band of the channel).
🔻 Bearish
Loss of support at USD 3,770 → a signal of weakness.
Then the next downside targets:
USD 3,643, then USD 3,453.
If USD 3,453 breaks, possible tests of the lower band of the channel – even around USD 3,300.
🧭 Summary
Main trend: downward (descending channel).
Short-term bias: neutral-bullish (potential for a rebound from support).
Key level to watch: USD 3,770 – maintaining this level could trigger a rebound, loss = risk of a steeper decline.
ETH-Daily : Bears in Control - Bulls Waiting for Right momentConsidering the liquidity that price may still sweep, Ethereum’s daily structure remains bearish for now, with a possible drop toward 3000 and a potential rebound from the 2700–2900 area.

My November and December expectations.According to my possible wave counts the first week of November may be a sell-off, then the direction may be upwards, and declines may occur after the Christmas holiday.
* The purpose of my graphic drawings is purely educational.
* What i write here is not an investment advice. Please do your own research before investing in any asset.
* Never take my personal opinions as investment advice, you may lose your money.

ETH Outlook after the Dip. What to expect NOW?Finally, the price broke the wedge, and the price experienced a significant drop. I think now is the time for ETH to rise again to 1900 . STRONG SUPPORT 1400 .
Give me some energy !!
✨We spend hours finding potential opportunities and writing useful ideas, we would be happy if you support us.
Best regards CobraVanguard.💚
_ _ _ _ __ _ _ _ _ _ _ _ _ _ _ _ _ _ _ _ _ _ _ _ _ _ _ _ _ _ _ _
✅Thank you, and for more ideas, hit ❤️Like❤️ and 🌟Follow🌟!
⚠️Things can change...
The markets are always changing and even with all these signals, the market changes tend to be strong and fast!!

"ETH - Time to buy again!" (Update)The ETH will increase $2K and reach to the top of the wedge in the coming weeks .
Best regards CobraVanguard.💚

Ethereum 3rd Cycle Inevitable ⚡️
Same structure.
Same rhythm.
Different cycles
Same silence before the storm.
Every CRYPTOCAP:ETH cycle begins the same way, accumulation, disbelief, and then an unstoppable breakout.
The 3rd cycle isn’t a question of if, it’s a matter of when.

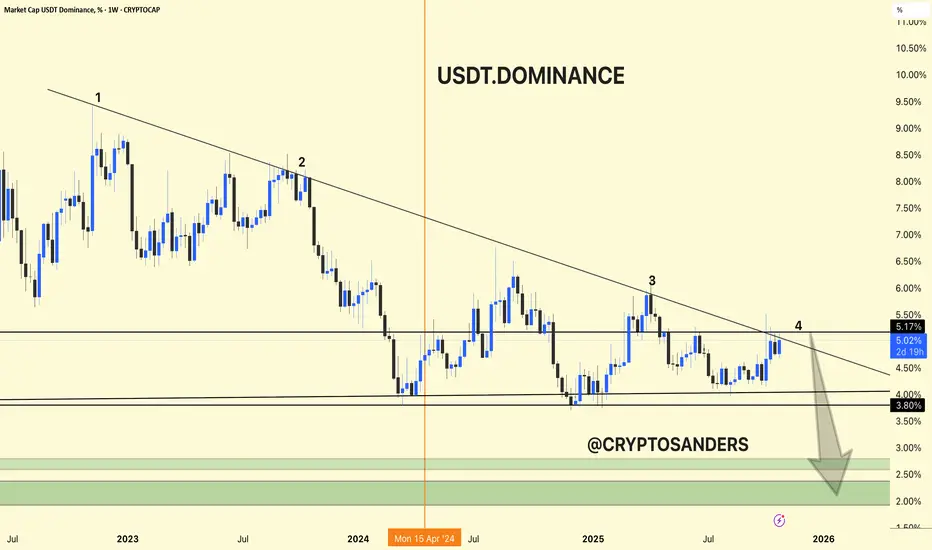
USDT.DOMINANCE CHART ANALIYSIS !!USDT Dominance Chart Update.
USDT dominance is again rejecting at the long-term trendline resistance (point 4), currently around 5.17%.
Structure suggests another potential move lower, with possible targets in the green zone (2.0%–3.0%) if the downtrend continues.
This scenario typically favors fresh capital rotation into Bitcoin and altcoins as traders de-risk from stablecoins.
Summary:
USDT dominance remains weak below the trendline. A sustained drop could spark further altcoin momentum and a broader crypto rally.
ETH/USDT: Price Decline Warning, Caution for Buy Opportunities!The ETH/USDT pair is currently facing clear downward pressure after failing to break through the strong resistance at 4,150.00. The 4-hour chart shows that Ethereum is moving in a short-term downtrend, with prices heading towards the important support level of 3,780.00. The strong rejection from this area indicates that the current market sentiment is leaning towards selling.
The market's cash flow also reflects short-term distribution, and the RSI indicator shows that ETH has previously entered overbought territory, and may continue to correct downward. These factors suggest that Ethereum could continue to face selling pressure, especially if the support levels are not strong enough to hold the price.
Impact of Recent News:
1. Australia's Core Inflation Data Rises Sharply: Australia's core inflation index increased by 1.0% in Q3, exceeding the forecast of 0.8%. This reduces expectations of a near-term rate cut and could affect ETH/USDT if the USD strengthens.
2. Expectations on U.S. Federal Reserve's Monetary Policy: The market expects the Fed to maintain high interest rates, which could strengthen the USD and put downward pressure on ETH/USDT.
Conclusion: Given the current downtrend and pressure from technical indicators, ETH/USDT is likely to continue decreasing over the next 48 hours. However, traders need to be cautious and closely monitor the support level at 3,780.00. If the price shows strong signs of recovery from here, it could present a good opportunity to enter the market.

ETHUSDT 4-Hour Chart Analysis !!ETHUSDT 4-Hour Chart Analysis
Trend: ETH has found support at the intersection of a long-term downtrend line and a horizontal demand zone ($3,850–$3,900 area). This area has held steady several times and is acting as a base for the price.
Structure: The price has recently pulled back after rallying to $4,220, but continues to make higher lows on this timeframe, indicating that the bullish structure remains intact as long as $3,900 remains stable.
Key Levels:
Support: $3,850–$3,900 (trend line and horizontal zone)
Resistance: $4,220 (recent swing high), $4,830 (key target—see green arrow projection)
Perspective: If ETH remains stable above $3,900 and bounces back from this support, the next targets will be $4,220 and then $4,830. A breakdown below $3,850 would weaken this bullish outlook.
ETH remains bullish above support, and an upward move towards $3,900 is highly likely. Watch for a break above and sustain above the $4,220 level for further momentum.
DYOR | NFA

ETH/USDT 1W🔹 Overall Trend
We are still in an uptrend (trend line maintained from the March low).
However, momentum is weakening—a series of lower highs is forming, suggesting a local correction within the main trend.
🔹 Key Technical Levels
🟢 Resistance:
4,179 USDT – the current level that the price is testing as resistance.
4,407 USDT – the next strong resistance, where previous rejections occurred.
4,877 USDT – the main resistance resulting from the August highs.
🔴 Support:
3,916 USDT – almost identical to the above (demand zone).
3,561 USDT – key structural support; loss of this level = possible trend change.
🔹 Formation and Structure
The current pattern could form a potential ascending triangle, with the trendline (black) connecting the lows and the horizontal resistance lines marking the upper boundary of the consolidation.
If a breakout occurs above 4,180–4,400, a move to 4,800+ is possible.
However, if we break the trendline and 3,900, a move to 3,560–3,400 could occur, or even a test of 3,000 with significant selling pressure.
🔹 Volume
Volume is decreasing during consolidation → typical of an accumulation or distribution phase.
No clear breakout signal – the market is waiting for a trigger (e.g., macroeconomic data, ETFs, news about ETH 2.0).
🔹 Stochastic RSI (Bottom of the chart)
Located in the oversold zone (<20).
The %K line (blue) is attempting to cross the %D line (orange) from below – a signal of an early rebound.
If confirmed next week, a local rebound from the 3,900–4,000 zone could occur.
🔹 Scenarios:
✅ Bullish:
Breakout from the trendline + breakout above 4,180 → target 4,400, then 4,880.
Confirmation by increasing volume and the Stoch RSI emerging from oversold territory.
❌ Bearish:
Breakout of the trendline and 3,900 → target 3,560, then 3,200.
Increasing downward volume + no bullish reaction at the support levels.

Growth ahead of the Trump-Xi Jinping meeting in South Korea.CRYPTOCAP:ETH / #Ethereum 🔹 Donald Trump and Xi Jinping (October 19, 2025)
A positive outlook is shaping up for Ethereum, and it sure looks like a classic W reversal is in the works.
There's a ton of negativity swirling right now, with a lot of folks expecting prices to dip even lower (I was bracing for that final flush-out myself, but it looks like they scooped up the dip and are busy forming this reversal setup).
During that Ethereum drop on October 10-11, BitMine Immersion Technologies beefed up its reserves with 104,336 ETH worth $417 million.
As of this writing, the company's sitting on 3.03 million ETH valued at $12.18 billion, making it the biggest corporate whale holding Ethereum.
Whales and public companies are aggressively snapping up Ethereum and stacking their bags.
All that's left is to speculate where Ethereum's gonna top out and where they'll start dumping all this volume 8k? 10k?
I've pulled together some screenshots that back up the bullish signal:
1️⃣ Liquidations on the Hyperliquid exchange: As you can see on the chart above, once we break $5,000, a massive wave of short traders are gonna get wrecked that could spark another leg up in price momentum.
2️⃣ Coinbase order book: Check it out—above $5,000, there are limit orders lined up for profit-taking, so Ethereum might follow a similar path straight up to $8,000.
3️⃣ Current big orders on Binance and Coinbase exchanges.
4️⃣ OKX ETH/USDC liquidation heatmap.
Wrapping it up: On the daily chart, we're seeing a reversal pattern forming as a W (I call it the "pirate reversal" myself), and keep in mind that after the chaos on October 10-11, more than 1.6 million traders got absolutely rekt.
I doubt everyone's gonna pile back in buying or flipping to long positions anytime soon that plays right into the hands of the big market puppeteers and market makers.
They'll pump the price higher, whip up the hype, and offload their Ethereum stacks at the top.
Snapshot:
