The market's energy is fueling a new wave of growth!Yesterday was a significant moment for the crypto market. 🌐 We received clear confirmation of the emergence of a new wave of growth. The upward flow of energy confirmed the intention of buyers, and the result of the day consolidated the volumes and showed the readiness to move to new heights. 📈
🎯 Key levels of support and resumption of growth:
- 3525 is the level where a local suspension of movement is possible to accumulate energy.
- 3443 is a zone that can become a key support and a starting point for the resumption of upward movement.
🔍 Chart analysis:
On the daily timeframe, we can see how the price is organically forming a base for continued growth. Yesterday brought progress with a clear buyer's volume, which supports the upward trend. The energy flow is now focused on forming new support points for further upward movement. 🔥
⚡️ What to expect next?
A new wave of growth is already gaining strength, and the buyer is showing stability in intentions. Keep an eye on the situation and the price reaction at key levels. Be prepared for further opportunities that the market opens up! 🌟
Ethusdtlong

ETH Eyes $2,800 Support: Big Move Incoming?ETHUSDT Technical analysis update
ETHUSDT has been trading within the same range of $2,000–$4,000 for the past 400 days. Currently, the price is forming an inverse head and shoulders pattern. In the coming days, the price could create the right shoulder of this pattern. A possible drop to the strong support zone at $2,700–$2,800 could complete the right shoulder formation. Once the price touches this support level, we can expect a strong bounce from that area.
Good Buy level: $2700- $2800
Regards
Hexa

ETHUSDT: 1HR Time frame Hi guys. According to the chart of ETHUSDT we so the pullback to reach the 3555$ and so countinued to correction . so profitable

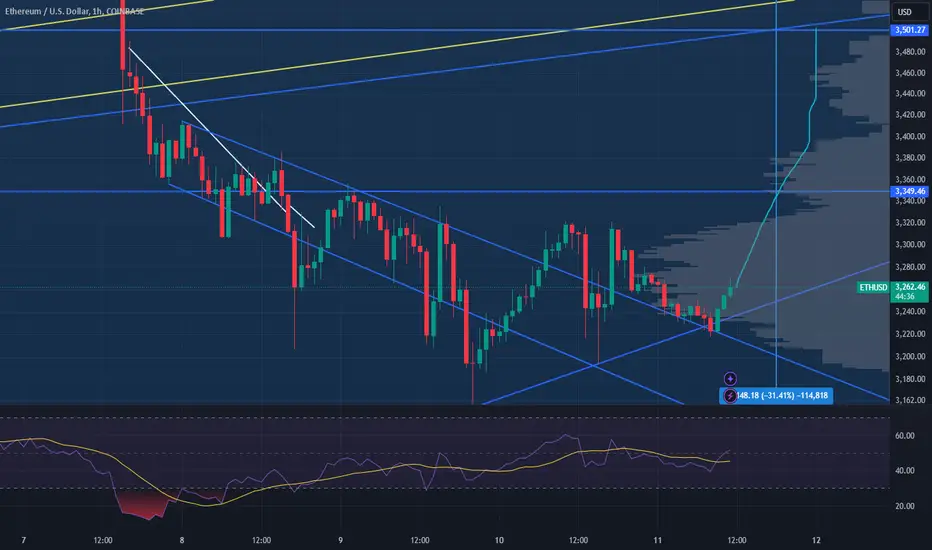
Ether starts grinding up and breaks out of a downward channelThe proper downtrend has been grindingly reversed, we can expect an upward trend here, all RSIs show ETH as oversold, nice confluence of support lines and the prior descending channel's higher boundary established as support
#Ethereum Alert: Breakout Ahead!🚀 #Ethereum Chart Analysis: Potential Breakout Ahead!
Take a look at the symmetrical triangle forming on the CRYPTOCAP:ETH chart.
The price is consolidating within converging trendlines, signalling a potential breakout on the horizon.
🔥 Key Levels to Watch:
Support: ~$3,200
Resistance: ~$3,500
With the current price action, we could be approaching a decisive move. The big question: Will CRYPTOCAP:ETH break upwards or downwards? 🤔
Whatever CRYPTOCAP:ETH does, most of the #alts will follow.
Stay sharp, traders! Watch for volume spikes and confirmation before making moves.
Let us know your predictions below! 👇
DYOR. NFA
#Crypto

ETH - Will it reach back to $2700?The BIGGG TANDY green box marked is where you would get a lifetime worth of eth at a great price so many would want it to come,ideally thats not the point, if it comes then its always better to get that, but as of now the pink box is the main character here.
Wont be amaze to break highs in steeps and break and make a day candle of dollar $750 to change stances!!

Next levels of interest on ETH short term frameBoth our targets were successfully reached on prior levels of ETH
We now look at where next. Given the strength ETH has shown, 3300-3400 level has formed as strong support. Even though bears call for a flush to hunt 3300-3200 liquidity, no attempts to break down have worked. Someone (ETF buyers?) have kept titan-strong support at 3300, which held despite relentless dumping during the holiday season.
Therefore, IF, 3650 is successfully flipped, on retest there is an interesting potential point of entry, which can bring ETH to the 4000-4100 area, where prior resistances exist. Onward we reassess where next.
Long-term we are bullish on ETH as per analysis here
This will be the third attempt to break the HTF resistance line, which will inevitably get broken through. Whether on the third attempt or fourth, we will analyze later.

seems like a short term bullish breakout for ETHas per chart, likely tp levels are marked
invalidation if breaks below the prior range at 3300

ETHUSD | Support zoneETHUSD support zone.
Is Ethereum ready for a big push to the upside?
Let me know what you think!

ETHUSDT Analysis: Blue Box SetupBy now, you’re familiar with my blue boxes , so I don’t need to explain them in detail. This blue box represents a solid demand zone where I expect potential reactions, making it an excellent area for entry.
Key Points:
Strong Demand Zone: Blue box is an ideal area for potential price reactions.
Familiar Setup: You know how I use these boxes for better trading precision.
Risk Management: Always manage risk based on the current market environment.
Confirmation Indicators: I will use CDV, liquidity heatmaps, volume profiles, volume footprints, and upward market structure breaks on lower time frames for validation.
Learn With Me: If you want to master how to use CDV, liquidity heatmaps, volume profiles, and volume footprints to identify precise demand zones, just DM me. I’d be happy to guide you!
Reminder: Be aware of the market's current state and approach it with caution. Successful trading relies on meaningful levels and robust confirmations.
If you think this analysis helps you, please don't forget to boost and comment on this. These motivate me to share more insights with you! Wishing everyone success in their trades.
I keep my charts clean and simple because I believe clarity leads to better decisions.
My approach is built on years of experience and a solid track record. I don’t claim to know it all, but I’m confident in my ability to spot high-probability setups.
If you would like to learn how to use the heatmap, cumulative volume delta and volume footprint techniques that I use below to determine very accurate demand regions, you can send me a private message. I help anyone who wants it completely free of charge.
My Previous Analysis
🐶 DOGEUSDT.P: Next Move
🎨 RENDERUSDT.P: Opportunity of the Month
💎 ETHUSDT.P: Where to Retrace
🟢 BNBUSDT.P: Potential Surge
📊 BTC Dominance: Reaction Zone
🌊 WAVESUSDT.P: Demand Zone Potential
🟣 UNIUSDT.P: Long-Term Trade
🔵 XRPUSDT.P: Entry Zones
🔗 LINKUSDT.P: Follow The River
📈 BTCUSDT.P: Two Key Demand Zones
🟩 POLUSDT: Bullish Momentum
🌟 PENDLEUSDT.P: Where Opportunity Meets Precision
🔥 BTCUSDT.P: Liquidation of Highly Leveraged Longs
🌊 SOLUSDT.P: SOL's Dip - Your Opportunity
🐸 1000PEPEUSDT.P: Prime Bounce Zone Unlocked
🚀 ETHUSDT.P: Set to Explode - Don't Miss This Game Changer
🤖 IQUSDT: Smart Plan
⚡️ PONDUSDT: A Trade Not Taken Is Better Than a Losing One
💼 STMXUSDT: 2 Buying Areas
🐢 TURBOUSDT: Buy Zones and Buyer Presence
🌍 ICPUSDT.P: Massive Upside Potential | Check the Trade Update For Seeing Results
🟠 IDEXUSDT: Spot Buy Area | %26 Profit if You Trade with MSB
📌 USUALUSDT: Buyers Are Active + %70 Profit in Total
🌟 FORTHUSDT: Sniper Entry +%26 Reaction
I stopped adding to the list because it's kinda tiring to add 5-10 charts in every move but you can check my profile and see that it goes on..

ETHUSDT: $5000 is Next Big Target! BINANCE:ETHUSDT
Since our first two entries already have reached two of target profits, now we think there are two possible entries from where we can expect price to reverse from. These two entries will be swing ones so whichever you take, it will be a good investment opportunity. Risk management is key to success, always follow your own analysis and use this analysis only for educational purposes.

ETHUSD: Is This the Dip to Buy? $4000 Resistance in Focus!!BYBIT:ETHUSDT BINANCE:ETHUSDT has recently bounced off the $3000 support zone after a significant correction from the $4000 resistance. This pullback presents a compelling opportunity for accumulation. Strong volume accompanying the bounce suggests underlying bullish sentiment. While the $4000 level currently acts as a formidable resistance, a decisive break above this mark could trigger a substantial uptrend. As always, prudent risk management is crucial. Implement a strict stop-loss order to mitigate potential losses and protect your capital.
COINBASE:ETHUSDT Currently trading at $3390
Buy level: Above $3100
Stop loss: Below $2750
Target : $6000
Max Leverage 3x
Always keep Stop loss
Follow Our Tradingview Account for More Technical Analysis Updates, | Like, Share and Comment Your thoughts

ETH thesis by Titan_KarmaEthereum Investment Thesis
Market Overview
Ethereum (ETH) is trading at $3,431.65, indicating potential for upward momentum. The recommendation is to OPEN LONG positions, supported by a favorable risk-reward setup and moderate confidence in a bullish trajectory.
Key Technical Indicators
Stop-loss: Set at $3,200.00, providing downside protection against unexpected price drops.
Take-profit: Targeted at $3,600.00, aligning with a strong resistance level and maximizing potential gains.
Exit Point: Positioned at $3,500.00, offering a prudent level for partial profit-taking.
Confidence Level
The confidence level for this strategy is 75%, reflecting cautious optimism. The technical and fundamental indicators support an upward trend, though volatility requires close monitoring.
Correlation with BTC
Ethereum shows a neutral correlation with Bitcoin (0.02), suggesting its price movement is minimally influenced by BTC. This allows ETH to follow its own market dynamics.
Position Analysis
Open Long Positions: None currently, presenting an opportunity to take advantage of the recommended strategy.
Open Short Positions: None, indicating a lack of bearish sentiment.
Risk Management Strategy
Entry at the current price of $3,431.65 is ideal to capitalize on potential gains.
A well-placed stop-loss at $3,200.00 minimizes risk in case of downside volatility.
The take-profit level at $3,600.00 provides an attractive target, while the exit point at $3,500.00 ensures partial profit-taking to secure gains.
Recommendation
OPEN LONG positions near the current price, aiming for a take-profit level of $3,600.00. The combination of technical support and moderate confidence in the bullish scenario supports this strategy. Traders should remain vigilant for any changes in sentiment or technical indicators that might influence price movements.

Will ETH Rebound from $3200?ETHUSDT technical analysis update
ETH price has dropped 20% from its peak to the $3100-$3200 level. The 100 and 200 EMA are expected to provide strong support, with the volume profile also indicating good support at this range. Additionally, the Fib 0.5 retracement at $3200 aligns with this level. We see strong support at $3100-$3200, and the price is likely to bounce strongly from this level.
Regards
Hexa

ETHUSDT 2DETH ~ 2D
#ETH Never panic when prices drop.. The bull market is still not over. This drop is a very strong buy signal. buy on this support block,. with a minimum target of 10%++

ETHUSD double top ETHUSD double top
ETHUSD has nicely drawn a double top with a target at $3,000 where I will reopen positions closed at $3,800

Diagonal ETHDiagonal ETH
🔹 Courage, the reversal is not far off, even though cancer hasn't blown its whistle yet.
Pro ETH:
🔼 The spill is exciting, new year discounts on all storefronts, although people are still afraid to buy - and this is the best sign for growth when everyone is scared, ether approached the first serious support in the form of 3570, where we can see an increase in volumes and obvious purchases for large amounts, from the current ones we should expect a return to the slope and a hike to 4070 and 4200 where the main pool of liquidity is accumulated at the moment, the asset has cooled down, confidently holding the 200 MA.
❌ Negative may be a move below 3580, in this case it will open the way to a deeper pullback to 3200-3050, but Santa is a stingy man and will not give so generously.
On RSI:
📈 Hourly is oversold, daily is neutral, why not.
Subscribe, put likes!

ETH ROADMAP - TELL Me WHAT you choose by seeing this?This time you tell me whats inside and Ill reply you!

ETHUSDT: The Calm Before the Storm: A Bullish Flag Pattern!!A compelling bullish setup is forming on the BINANCE:ETHUSDT chart. The recent price action has resulted in a classic flag pattern, characterized by a sharp upward move followed by a period of consolidation within a descending channel. This pattern often precedes a significant breakout to the upside. As the price approaches the upper boundary of the flag, a decisive break could trigger a substantial rally, potentially pushing BINANCE:ETHUSDT to new all-time highs. However, as with any trade, it's crucial to implement a robust risk management strategy, including a well-defined stop-loss order, to protect potential profits.
BINANCE:ETHUSDT Currently trading at $3880
Stoploss $3800
Target $4400
Max leverage 5x
Always keep stoplosss
ollow Our Tradingview Account for More Technical Analysis Updates, | Like, Share and Comment Your thoughts

ETHUSD: Trend continuation | go long BINANCE:ETHUSD Ethereum has found support at daily Anchored VWAP and 50% Fib retracement. Buy entry at 3855, stop loss 3553. First TP 4091 and second TP 4951. Manage your risk and use trailing stop loss.

Ethereum (ETH) struggles at $4,000, but whales continue to accumEthereum’s price has struggled to close above the $4,000 mark for the second time in the last six months. Despite rallying close to this key psychological level, ETH was unable to maintain its position, signaling the need for a stronger bullish conviction to push the price past this barrier.
Whale addresses holding between 10,000 and 100,000 ETH, which have demonstrated strong accumulation over the past five days, purchasing a combined total of 400,000 ETH worth over $1.5 billion. This significant accumulation highlights that large wallet holders continue to have confidence in Ethereum’s long-term growth.
The whales’ buying activity highlights Ethereum’s attractiveness as an investment. Despite recent challenges in surpassing the $4,000 barrier, this large-scale accumulation demonstrates that institutional and high-net-worth investors are not deterred by short-term volatility.
Ethereum’s price dropped by 7% yesterday, now trading at $3,761. The altcoin king is attempting to secure $3,721 as support to avoid further declines. This level is crucial in determining whether ETH can maintain its bullish momentum or face a deeper pullback in the coming days.
Securing the $3,721 support is essential for Ethereum to break above $4,000. If this happens, ETH could reach a new year-to-date high above $4,093. This potential rally would also pave the way for ETH to set new all-time highs, reinforcing the positive outlook for the altcoin.
However, if Ethereum fails to maintain $3,721 support, it may drop toward $3,524. A further decline could send ETH down to $3,327. If this happens, the bullish thesis will be invalidated, and a more significant market correction may follow.

ETHUSDT Trade LogETHUSDT Daily Long Setups
Trade Logic:
- Setup: Long positions distributed across 3 key daily Fair Value Gaps (FVGs) as part of a DCA strategy.
- Entry Zones:
1. First FVG near $3,660 , offering a moderate discount.
2. Second FVG near $3,212 , aligning with deeper retracement and higher confluence.
3. Third FVG near $2,877 , close to major demand and psychological support.
- Risk-Reward: Each entry maintains a minimum RRR of 1:3, targeting the weak high near $4,200 .
Confluence Factors:
- Trend: Strong bullish trend intact, with price respecting the Kijun line and daily BOS (Break of Structure).
- Liquidity Sweep: Potential to trap shorts at lower FVGs, fueling a rally.
- Support Levels: Each FVG aligns with strong historical demand zones, providing high-probability entries.
Macro Context:
- Market Sentiment: Ethereum fundamentals remain strong, with increasing on-chain activity and sustained demand for staking.
- Correlations: Broader crypto market shows bullish sentiment, with BTC leading the trend.
- Economic Indicators: Risk-on environment as equity markets rally, supporting further upside in risk assets like ETH.
Execution Plan:
- DCA across all three entries for optimal risk management and exposure.
- Trail stops as price approaches $4,200 or weak high levels for partial profit-taking.
- Monitor macroeconomic news and potential resistance above $4,200 to adjust targets.

ETHUSD Towards 4000?Ethusd is in range and on range breakout we will see ETH moving toward 4000.
Mange your risk according to account size.
