BTC – Liquidity Grab at $116K Before Deep Correction?Description -
📊 Using the SMC Suite (Order Blocks, Liquidity Sweeps, FVG), BTC is approaching a critical supply zone ($116K–$118K).
• If price taps this orange zone, strong sellers are likely to step in.
• This move may trap late longs and grab liquidity before reversing.
• Downside targets sit around $100K initially, with extended demand near $85K–$80K.
🔑 Key Levels:
• Resistance/Supply: $116K–$118K
• Support/Demand: $100K, $85K–$80K
• Invalidation: Daily close above $122K
⚠️ This is not financial advice — just a liquidity-based interpretation of BTC’s structure .
Fairvaluegap

Bitcoin Going down down?
No fuss.
Weekly Chart.
Bearish Fair Value gap created.
Last Bullish Fair Value Gap closed out.
Unmitigated Bullish FVG around the 90k area.
Same price drop as last retrace to 50% of the FVG.
Could go there, maybe, who knows.
Keep it simple though.
Indicator used for FVG's

“BTCUSD Road to 120K – But Watch the Trap Ahead!”“BTCUSD 🚀 Road to 120K – But Watch the Trap Ahead!”
Bitcoin has shown strong momentum after a liquidity sweep around 108,000, signaling that big players collected orders before pushing price higher. This is a common smart money concept (SMC) move where liquidity is grabbed before the next leg.
🔑 Key Points to Note:
Previous Support Flip: Market reclaimed the broken support, turning it into a base for continuation.
Upside Target: The next major resistance zone is 120,000 – 123,000, where sellers are likely to step in.
Market Behavior: Price often sweeps liquidity before testing strong resistance, so patience is key.
Potential Pullback: Once resistance is tapped, a correction may follow as profit-taking starts.
📌 Educational Takeaway: Always watch how price reacts at liquidity zones and key resistance points. These levels often decide whether the trend will continue or reverse.
📈 For now, short-term bias = bullish toward 120,000, but be cautious for a possible rejection at that zone.

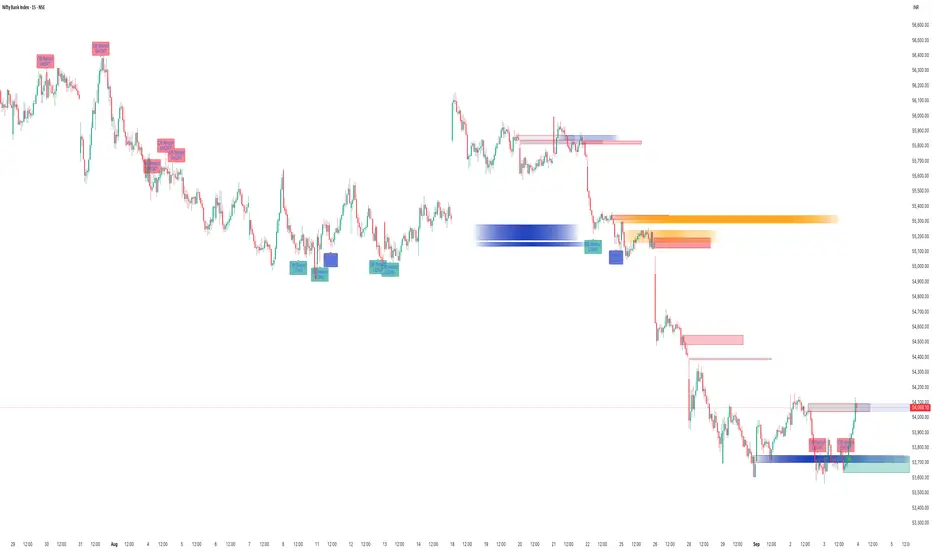
How To Capture Market Moves With SMC Suite Indicator?📊 SMC Suite Capturing Market Moves — Order Blocks • Breakers • Liquidity Sweeps • FVG
The chart above shows how the SMC Suite works in live market conditions on BankNifty. By combining Order Blocks, Breaker flips, Liquidity Sweeps, and Fair Value Gaps, the tool highlights where smart money is entering and where reversals are likely to occur.
🔹 Key Highlights from This Chart
1. Order Blocks — Bullish and bearish OBs correctly marked institutional footprints before price reversals.
2. Breaker Blocks — Invalidated OBs flipped into Breakers, giving continuation entries in trend direction.
3. Liquidity Sweeps — Several highs/lows were taken out, followed by reversals back into structure. These sweeps acted as confirmation for later setups.
4. Fair Value Gaps (FVGs) — The script marked imbalances that later served as retracement zones. Price respected these gaps, providing clean reversal opportunities.
5. Retest Alerts — Each zone was validated only on retests with optional wick rejection, reducing noise and improving signal quality.
⸻
🔹 Why It Matters
This chart shows that SMC Suite is not just drawing zones randomly — it creates a workflow:
• Sweep liquidity ➝ impulsive displacement ➝ zone creation (OB/Breaker/FVG) ➝ retest confirmation.
This makes it easier to follow institutional logic and align entries with high-probability setups.
📌 Conclusion
From strong downside moves to clean bounces, the SMC Suite captured both continuation setups (Breakers) and reversal setups (OB/FVG retests). The integration of liquidity logic makes it a practical trading tool across indices, forex, and crypto.
EURUSD - Bullish momentum for the week!Introduction
The EURUSD has been consolidating for a prolonged period, sweeping both upside and downside liquidity in the process. After the liquidity sweep to the downside, price reacted strongly by moving upwards, indicating a shift in market structure. The pair has since inverted the previously bearish 4-hour fair value gap, which now acts as a bullish reference point, and is currently holding within the 1-hour fair value gap. As long as price maintains this 1-hour FVG support, there remains a strong case for further upside movement.
Liquidity Sweep
The recent downside liquidity sweep was a significant turning point. By driving below key lows and collecting stop orders, EURUSD effectively cleared the market of weak positions. This was followed by a sharp rejection, represented by a wick, which signaled strong buying interest at these levels. Since then, the market has been climbing steadily, showing intent to challenge the higher liquidity levels resting above.
Inversion
Following the liquidity sweep, EURUSD inverted the bearish 4-hour fair value gap. What was previously an area of supply and resistance has now been reclaimed and transformed into a demand zone. This inversion is an important bullish signal because it indicates that sellers were absorbed and that buyers have successfully taken control. As long as this zone remains intact, the path of least resistance continues to lean upward.
1-Hour Bullish FVG
Currently, EURUSD is resting on a 1-hour bullish fair value gap. This area serves as an important support level, and as long as it holds, price is likely to use it as a springboard for further gains. The next targets lie at the upside, beginning with the first objective at the intermediate resistance level labeled “Target 1,” before ultimately pushing towards the liquidity area above. By reaching this zone, the market would sweep short-side liquidations and potentially trigger momentum-driven buying.
Target Area
The primary targets for this bullish move are the two significant highs above the current range. These highs represent zones where stop-loss orders are most likely accumulated. By driving into and above these levels, EURUSD will effectively complete a liquidity grab, providing bulls with a logical profit-taking zone before the market considers a possible retracement. Such a move would align with the general principle of markets seeking liquidity before establishing a new direction.
Final Thoughts
In summary, EURUSD is showing constructive price action following its downside liquidity sweep and subsequent bullish reversal. The inversion of the 4-hour FVG and the current defense of the 1-hour FVG are both encouraging signs for buyers. As long as the 1-hour fair value gap continues to act as a firm support, the probability of an upward continuation towards the liquidity area remains strong. However, traders should also remain mindful that once the liquidity above the highs is collected, a corrective move to the downside could develop. For now, the short-term bias stays bullish, with clearly defined targets on the upside.
-------------------------
Disclosure: I am part of Trade Nation's Influencer program and receive a monthly fee for using their TradingView charts in my analysis.
Thanks for your support. If you enjoyed this analysis, make sure to follow me so you don't miss the next one. And if you found it helpful, feel free to drop a like 👍 and leave a comment 💬, I’d love to hear your thoughts!

Bitcoin - Will the CME gap be filled?Introduction
Bitcoin has been under consistent downward pressure since it reached its new all-time high, and the market has been struggling to regain momentum. During the past weekend, we saw a notable drop in price that created a CME gap, which also happens to align with the bearish 4-hour fair value gap. Since then, the price has been climbing back up, but the recovery has been slow and cautious rather than explosive. The key question now is whether Bitcoin will continue to rise and fill the CME gap or whether it will lose strength and revisit the recent lows. In the following sections, I will go over the levels and scenarios to watch closely.
Daily FVG bounce
Last week, Bitcoin found support at the daily fair value gap, which acted as a strong demand zone. From this level, the price bounced upward and has been grinding higher ever since. Although this reaction gave some relief to buyers, the pace of the move has been rather sluggish, and momentum remains weak. What traders now need to evaluate is how far this move can realistically extend. The daily FVG provided the initial foundation for this bounce, but the real test will come as the price approaches shorter-term imbalances and resistance areas.
Bullish scenario
For the bullish outlook to play out, Bitcoin needs to hold the current 1-hour fair value gap as support. If this level remains intact, it will signal that buyers are in control of the short-term trend and that the recent bounce has the potential to evolve into a more sustainable rally. In that case, the next logical upside target would be the 4-hour fair value gap, which conveniently aligns with the CME gap left behind last weekend’s drop. Filling this inefficiency would not only provide a technical target for bulls but would also help restore some balance to the market structure.
Bearish scenario
On the other hand, if Bitcoin fails to maintain the 1-hour fair value gap and breaks below it with a clear 1-hour candle closure, the outlook shifts to bearish. This kind of move would create a bearish inversion and serve as confirmation that sellers are regaining control. If this occurs, the probability increases significantly that Bitcoin will revisit its recent lows. In such a case, the market could once again test the demand at the daily fair value gap, and depending on the strength of that support, we could even see deeper retracements.
Final thoughts
Bitcoin is currently at an important crossroads where both bullish and bearish outcomes remain possible. The reaction around the 1-hour fair value gap will provide the clearest signal as to which direction the market is likely to take next. If buyers manage to defend this level, the path toward the 4-hour FVG and the CME gap becomes a realistic target, offering room for a meaningful recovery. However, if sellers push the price below the 1-hour imbalance, then the recent bounce may be nothing more than a temporary relief rally before another leg down. Traders should remain cautious, monitor these key levels closely, and adapt to whichever scenario unfolds.
-------------------------
Thanks for your support. If you enjoyed this analysis, make sure to follow me so you don't miss the next one. And if you found it helpful, feel free to drop a like 👍 and leave a comment 💬, I’d love to hear your thoughts!

EURUSD - Is there more bearish momentum ahead?Introduction
Last Friday, the EURUSD experienced a sharp move to the upside following Jerome Powell’s speech, which fueled optimism and created strong bullish momentum. However, the market could not sustain this rally, and by yesterday all the gains were fully retraced. Price dropped back into the bullish inversion fair value gap (FVG), ultimately filling it entirely. While this retracement has cooled off the bullish pressure, it has also introduced some new dynamics into the market that traders should be aware of.
Liquidity sweep
During Friday’s impulsive rally, EURUSD swept liquidity above the recent highs and simultaneously filled all the bearish fair value gaps. This move, while initially strong, did not manage to establish a sustainable break above those highs. As a result, bearish momentum began to reappear, suggesting that the rally was more of a liquidity grab rather than the start of a prolonged bullish trend.
Bullish case scenario
The bullish scenario from here would require EURUSD to reclaim strength and invalidate the recently formed bearish 4-hour FVG. For this to happen, the pair would need a decisive 4-hour candle close above this zone, signaling renewed upside momentum. Should buyers manage to achieve this, the next logical target would be another attempt at the highs that were swept on Friday. A confirmed break above those levels would strengthen the bullish case and potentially open the path to higher price levels.
Bearish case scenario
On the other hand, the bearish scenario appears more probable if EURUSD faces rejection at the bearish 4-hour FVG. A failure to break above this area would confirm that the bearish momentum is still in play. If that occurs, price will likely seek liquidity by moving lower, potentially targeting the bullish 4-hour FVG that sits beneath the liquidity zone. This move would align with the broader bearish structure and reinforce the idea that the market remains under selling pressure despite Friday’s rally.
Final thoughts
In conclusion, EURUSD is currently at a critical juncture, with both bullish and bearish scenarios still on the table. The decisive factor will be how price reacts around the bearish 4-hour FVG. A strong close above could set the stage for a continuation to the upside, while rejection from this zone would likely lead to a liquidity grab to the downside and a revisit of lower fair value gaps. Traders should remain cautious and patient, waiting for clear confirmations before committing to a direction, as the market continues to balance between bullish hopes and bearish pressure.
-------------------------
Disclosure: I am part of Trade Nation's Influencer program and receive a monthly fee for using their TradingView charts in my analysis.
Thanks for your support. If you enjoyed this analysis, make sure to follow me so you don't miss the next one. And if you found it helpful, feel free to drop a like 👍 and leave a comment 💬, I’d love to hear your thoughts!

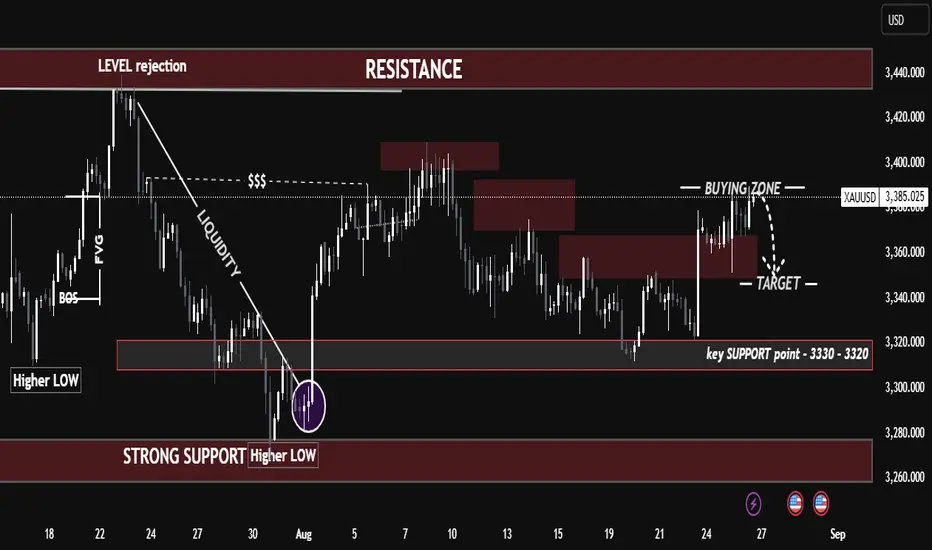
XAUUSD – Key Levels To Watch? What Happend Next🟡 XAUUSD – Key Levels To Watch 🔥 What Happend Next
Gold is currently trading inside a buying zone (3380 – 3400) but facing rejection. Market structure is still holding higher lows, which keeps the bigger trend bullish, but short-term price action suggests a possible retracement move.
Resistance Zone: 3420 – 3440 (strong supply, previous rejection)
Key Support: 3330 – 3320 (major demand, higher low base)
Immediate Target: 3340 – 3360 (if rejection continues)
📉 Short-term bias: bearish correction toward 3340 – 3360
📈 Swing bias: bullish as long as 3330 – 3320 holds
🔑 My View:
I’ll be watching how price reacts around 3330 – 3320. Holding this level could trigger the next bullish leg toward 3420 – 3440. Losing it opens the door for deeper downside into 3280.
EURUSD - Bullish outlook heading into next week!Introduction
The EURUSD experienced a strong surge last Friday, largely driven by Jerome Powell’s speech, which added significant momentum to the market. This impulsive move to the upside successfully filled both the bearish 4-hour and 1-hour Fair Value Gaps (FVGs). The candle that formed was notably strong and bullish, and because of its size and strength, it is highly probable that we will see at least a 50% retracement of this candle before price continues to push higher. Such a retracement would allow the market to gather liquidity and prepare for another bullish leg.
Liquidity Sweep
Before this sharp rally, the EURUSD executed a liquidity sweep at the recent lows, clearing out stop losses and inducing sellers into the market. This is a classic move often seen before a strong reversal to the upside. Following this sweep, price accelerated with an aggressive bullish candle. My expectation now is for the market to retrace into this candle, ideally retracing deeply enough to provide a high-probability entry for continuation to the upside. This liquidity sweep sets the stage for a bullish scenario, as it suggests that smart money has already accumulated positions at discounted levels.
Resistance
As price surged higher, it tapped into a key area of resistance, which aligns with both the 1-hour and 4-hour FVGs. This confluence of timeframes strengthens the validity of the resistance zone and explains why price has reacted from this level. I anticipate that breaking through this resistance will require additional momentum, which may not occur immediately. Instead, we could see a short-term pullback or cooldown that allows the market to gather strength before attempting to push through this supply zone. This resistance area will therefore act as a decisive battleground for buyers and sellers.
Bullish Support
The strong bullish candle formed during the rally now serves as a new area of support. I expect price to respect the 50% retracement level of this candle, which lies around 1.166. This midpoint often acts as a significant level in technical analysis, and holding above it would confirm bullish continuation. As long as price remains above this zone, the momentum remains to the upside, and the probability of another move higher increases. This makes the retracement into this level a potential buying opportunity.
Inversion
Another important factor to consider is the inversion of the 4-hour FVG. On the previous drop, the EURUSD created a bearish 4-hour FVG, which initially acted as resistance. However, with the latest bullish impulse, this same zone has now flipped into an inversion FVG, transforming from a bearish area into a bullish support. This inversion highlights a significant shift in market structure and suggests that bulls are taking control of the price action. This level will be crucial to watch, as holding above it strengthens the case for further upside.
Final Thoughts
In summary, the EURUSD is showing strong bullish potential following the liquidity sweep and the aggressive rally sparked by Powell’s speech. While the market has reached a significant resistance area marked by the 1-hour and 4-hour FVGs, a retracement into the 50% level of the bullish candle would be healthy and provide a potential entry point for buyers. With the inversion of the previous bearish FVG into bullish support, the technical picture favors the upside as long as key support levels are respected. The coming sessions will reveal whether the market has the strength to break through resistance and continue its upward trajectory.

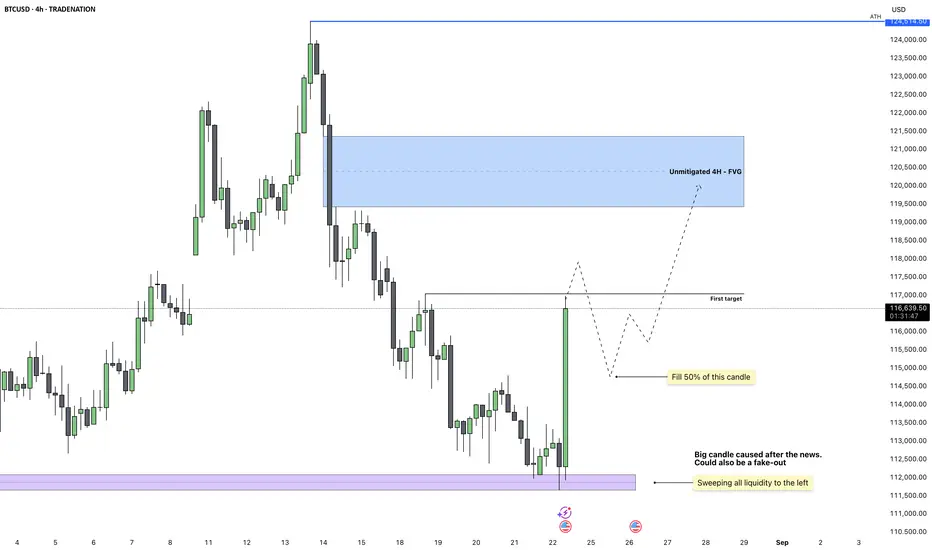
Bitcoin - A Deep Sweep Setting Up the Next ExpansionBitcoin just swept the monthly low of August as well as the previous day’s low. This was a clear liquidity grab that lined up with today’s bullish momentum in the market. The strong reaction from this zone shows that buyers were waiting for these liquidity levels to get cleared before stepping in.
Liquidity Sweep and Reaction
The sweep was significant because it cleared out resting sell-side liquidity to the left. This kind of move usually sets the stage for a reversal, and the large impulse candle confirms strong demand stepping in. While some might see this as just a reaction to external events, the technical picture supports continuation higher.
Immediate Target
The first target is sitting around 117,000. This level lines up with short-term inefficiencies and is a logical magnet for price in the coming sessions. I expect this liquidity pool to be swept before any meaningful retracement.
Retracement Expectation
After hitting the first target, I anticipate a move back down to fill around 50% of the large green impulse candle. Big candles like this often retrace partially before continuing their main direction. That retracement will provide a cleaner structure and a chance for re-entries on lower timeframes.
Higher-Timeframe Objective
Once the retracement plays out, the bigger objective sits higher at the unmitigated 4H fair value gap around 120,500. This area remains untouched and is likely to act as a price magnet as the market seeks balance.
Conclusion
The sweep of key lows combined with the strong impulsive move is a bullish development. I expect price to first tag 117,000, then retrace into the large candle before resuming higher towards the 4H FVG.
Disclosure: I am part of Trade Nation's Influencer program and receive a monthly fee for using their TradingView charts in my analysis.
___________________________________
Thanks for your support!
If you found this idea helpful or learned something new, drop a like 👍 and leave a comment, I’d love to hear your thoughts! 🚀
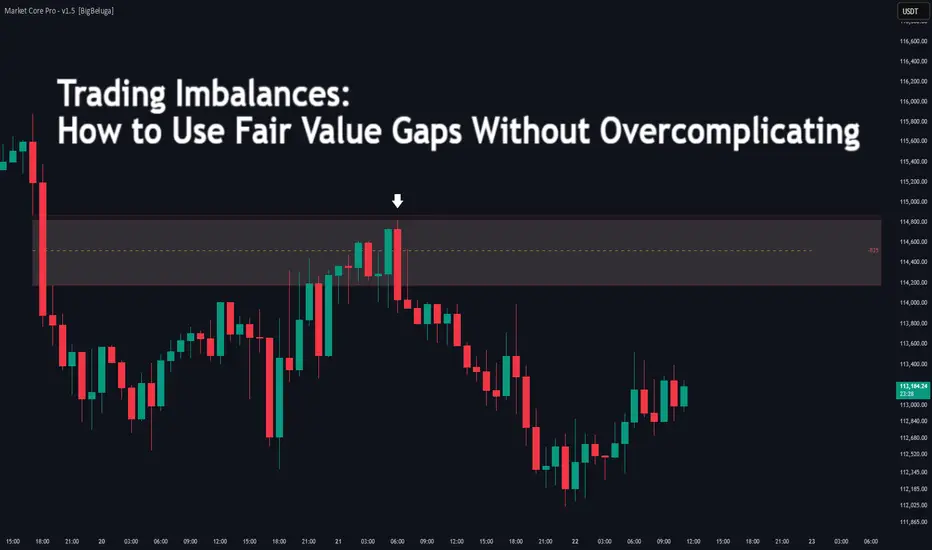
Trading Imbalances: How to Use Fair Value GapsDifficulty: 🐳🐳🐋🐋🐋 (Novice+)
This article is designed for traders who want to understand Fair Value Gaps (FVGs) in a simple, practical way — without drowning in complex Smart Money Concepts terminology.
🔵 INTRODUCTION
If you’ve studied Smart Money Concepts (SMC), you’ve likely come across Fair Value Gaps (FVGs). For many, the concept feels overcomplicated. In reality, an FVG is just an imbalance in price — a spot where the market moved so fast that it didn’t fully trade both sides.
🔑When price leaves a gap behind, it often comes back later to “rebalance.” This gives traders powerful zones for entries, exits, and target setting.
🔵 WHAT IS A FAIR VALUE GAP?
A Fair Value Gap is formed over three candles :
Candle 1: The first move (anchor).
Candle 2: The big impulsive candle (the imbalance).
Candle 3: The follow-up candle.
The gap exists when the high of Candle 1 is below the low of Candle 3 (in a bullish case). This leaves an “untraded zone” inside Candle 2.
Think of it as a skipped step. Price rushed through so quickly, there wasn’t enough time to trade at fair value.
🔵 WHY DOES PRICE RETURN TO FVGs?
Markets seek balance. When an imbalance forms, algorithms and institutional flows often revisit the gap to collect liquidity and rebalance orders.
This doesn’t mean every FVG gets filled instantly — some remain open for days or even weeks. But many serve as magnets for price.
🔑Key point: An FVG is not a magic level. It’s a clue about where inefficiency sits.
🔵 HOW TO TRADE FVGS SIMPLY
1️⃣ Mark the Zone
Identify the three-candle imbalance. Highlight the gap inside Candle 2.
2️⃣ Wait for Return
Don’t chase the impulsive candle. Instead, wait for price to retrace into the FVG zone.
3️⃣ Trade the Reaction
Bullish FVG → wait for price to dip into the zone and show bullish reaction
Bearish FVG → wait for price to retest zone and reject downward
Stops are usually placed beyond the gap, targets set toward the next liquidity pool or swing level.
🔵 EXAMPLE SCENARIO
A strong bullish candle leaves an imbalance.
Price continues higher, but a day later revisits the gap.
At bullish rejection candles form with increasing volume.
Entry taken, stop below gap, target at next swing high.
🔵 TIPS FOR ADVANCED TRADERS
Higher timeframe FVGs are stronger and attract price longer.
Not every gap fills — filter with trend direction.
Combine with OBs (Order Blocks) or liquidity zones for more precision.
Ignore small random gaps in low-volume markets.
🔵 CONCLUSION
Fair Value Gaps don’t need to be mysterious. They’re simply imbalances in the auction process. By waiting for price to return and react, traders can build structured entries with defined risk.
🔑Instead of overcomplicating SMC concepts, think of FVGs as footprints of urgency — and opportunities for balance.
Do you already trade FVGs, or is this your first time hearing about them? Share your setups below!
Bitcoin - Can the bulls defend this support?Introduction
After reaching its all-time high, Bitcoin has faced strong rejection, falling from $124.5k down to $113k with notable bearish volume behind the move. On this downward path, several four-hour bearish Fair Value Gaps (FVGs) were left open, signaling areas of inefficiency that the market may look to revisit. At present, Bitcoin is testing a critical support zone formed by overlapping daily and four-hour FVGs. This support level is of particular importance because holding it could provide the foundation for renewed bullish momentum and a potential recovery in price action.
Bullish scenario
For the bullish case to unfold, Bitcoin must successfully maintain support in the $111.2k to $112.7k range, which represents the current four-hour FVG. This zone serves as a pivotal point where buyers need to defend price in order to keep upward potential intact. If the market stabilizes here, the next logical target will be the four-hour bearish FVG just above. In order to confirm strength, Bitcoin would need to close a clear four-hour candle above this resistance, effectively flipping it into support. Should that occur, it opens the door for price to climb toward the $120k region, a level that would reintroduce confidence among bulls and suggest that the broader trend could still have room for continuation.
Bearish scenario
On the other hand, the bearish scenario becomes more likely if Bitcoin fails to defend the $111.2k to $112.7k four-hour FVG and instead flips this zone into resistance. While a breakdown below this area would be concerning, there is still the possibility of a short-term bounce. In such a case, price could retrace back upward toward the bearish four-hour FVG at $114.7k before facing another critical test. If Bitcoin rejects strongly from that zone and subsequently breaks below $111.2k, the market could experience further downside pressure, potentially setting up a deeper correction. This would reinforce the dominance of the ongoing downtrend that has followed the rejection at the all-time high.
Final thoughts
Bitcoin remains in a pronounced downtrend after its sweep of the previous all-time high, yet it currently sits at a strong support level that offers a chance for recovery. The market’s reaction to this support area will play a decisive role in determining whether a rebound toward $120k is achievable or whether a deeper decline is imminent. The four-hour FVG around $114.7k stands out as a key battleground between bulls and bears. If buyers can reclaim and hold this level, momentum could shift back in their favor, but if sellers defend it and force price lower, the bearish trend is likely to persist.
-------------------------
Disclosure: I am part of Trade Nation's Influencer program and receive a monthly fee for using their TradingView charts in my analysis.
Thanks for your support. If you enjoyed this analysis, make sure to follow me so you don't miss the next one. And if you found it helpful, feel free to drop a like 👍 and leave a comment 💬, I’d love to hear your thoughts!

EURUSD - Will the parallel channel hold?Introduction
The EURUSD is currently trading within a well-defined bullish parallel channel. While this channel suggests an overall upward trajectory, there is an important imbalance in how price has interacted with its boundaries. The upper side of the channel has relatively few touchpoints compared to the lower side, which has already been tested multiple times. This creates an interesting dynamic where both bullish and bearish scenarios remain in play. The pair is also trading within two significant 4-hour fair value gaps (FVGs), and the critical question now is which side will give way first, determining the next directional move.
The Parallel Channel
Within this parallel channel, price action has been leaning more heavily toward the downside, as shown by the fact that the lower boundary has been tested four times already. The upper boundary, however, has only registered a single touch, making it less validated. This imbalance implies that there is notable pressure on the downside, but at the same time, the presence of a bullish 4-hour fair value gap near the lower boundary cannot be ignored. This gap provides a potential level of support that could initiate a reversal back toward the upper side of the channel.
Potential Bullish Bounce from Support
The alignment of the lower trendline of the channel with the 4-hour bullish fair value gap creates a strong technical confluence. This support zone, located around the 1.166 – 1.165 area, could act as a springboard for buyers. If price respects this level, a bullish bounce could occur, pushing EURUSD back toward the upper region of the channel. In this scenario, the market would likely target the remaining inefficiencies left by the bearish 1-hour and 4-hour fair value gaps above, potentially leading to a liquidity grab in that zone.
Bearish Breakdown Scenario
On the other hand, if EURUSD fails to hold the support at the bullish 4-hour FVG, a bearish breakdown becomes increasingly likely. In that case, both the channel structure and the previously supportive FVG would flip into resistance, reinforcing bearish momentum. Should this play out, the pair could decline toward the next major 4-hour FVG around the 1.156 level in the near future. This would represent a meaningful breakdown of the current bullish structure, opening the door for further downside.
Conclusion
The EURUSD sits at a decisive point within its bullish channel. The key lies in whether the support confluence of the 4-hour bullish FVG and the lower trendline will hold. If it does, the pair has room to climb higher and fill inefficiencies above. If it breaks, however, a move down toward 1.156 seems likely. Traders should closely monitor these zones, as the resolution of this consolidation will determine whether EURUSD extends its bullish momentum or shifts into a deeper retracement.
-------------------------
Disclosure: I am part of Trade Nation's Influencer program and receive a monthly fee for using their TradingView charts in my analysis.
Thanks for your support. If you enjoyed this analysis, make sure to follow me so you don't miss the next one. And if you found it helpful, feel free to drop a like 👍 and leave a comment 💬, I’d love to hear your thoughts!

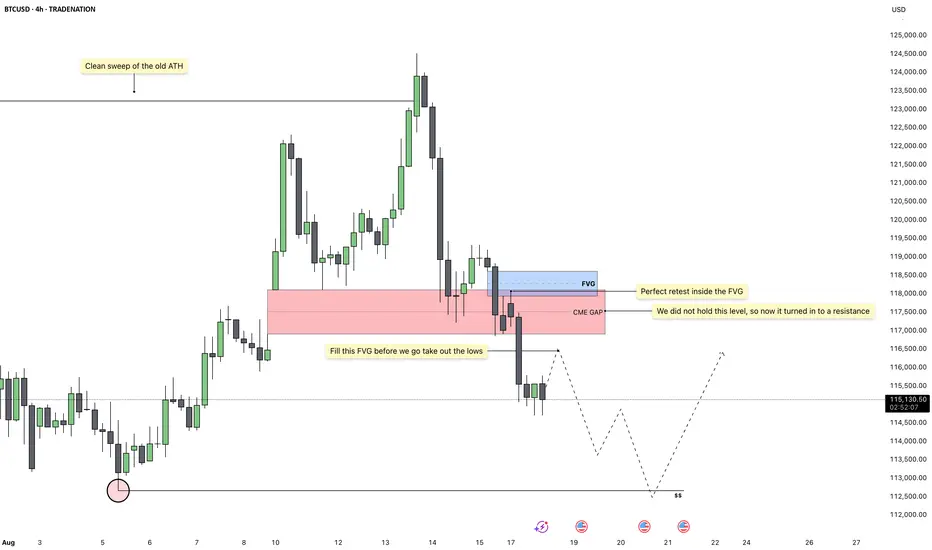
Bitcoin - Bears in Control, Lows AheadBitcoin has recently completed a clean sweep of the previous all time high, which has now given us strong bearish confirmation signals. After the sweep, the market rejected higher levels and failed to sustain bullish momentum, showing clear signs of distribution at the top. This shift in behavior suggests that buyers have lost control and sellers are now taking over.
Fair Value Gap Setup
Currently, price is sitting just below a fair value gap, which remains unfilled. These imbalances often attract price back before continuing in the prevailing direction, and in this case, that direction is down. A small retracement into the fair value gap above would be the ideal setup for a continuation lower.
Bearish Confirmation
The rejection after sweeping the highs and the subsequent breakdown beneath key support levels has created a bearish structure on the higher timeframe. The failed hold inside the fair value gap turned it into resistance, strengthening the case for lower prices. Each retest has been met with selling pressure, confirming that liquidity is now being delivered to the downside.
Liquidity Targets
Once the fair value gap above is filled, the next logical draw on liquidity sits below the current range. That means the lows are now exposed, and the cleanest target to expect price to reach is at 112k. The path of least resistance remains to the downside, as uncollected sell-side liquidity continues to build up beneath the market.
Trading Outlook
As long as Bitcoin continues to respect the newly formed resistance from the fair value gap, the bearish outlook remains intact. A retracement into the gap would likely offer the best entry for shorts, with the expectation that price will then seek out the lows. Only a convincing reclaim above the imbalance would threaten this bearish scenario.
Conclusion
The clean sweep of the old all time high has shifted market sentiment, and the subsequent bearish confirmations support the idea that the next major move is lower. I expect a slight retrace into the fair value gap before price makes its way down to the 112k liquidity pool.
Disclosure: I am part of Trade Nation's Influencer program and receive a monthly fee for using their TradingView charts in my analysis.
___________________________________
Thanks for your support!
If you found this idea helpful or learned something new, drop a like 👍 and leave a comment, I’d love to hear your thoughts! 🚀
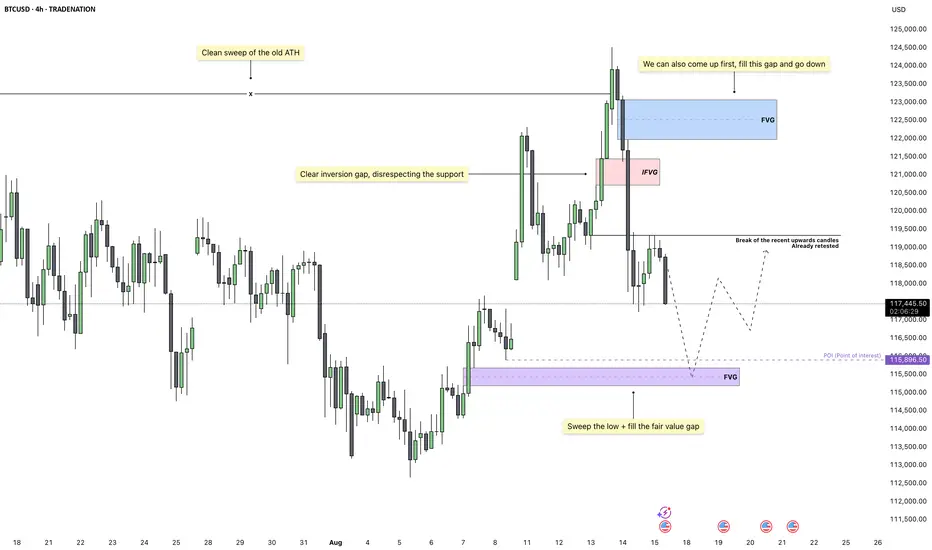
Bitcoin – Momentum Turns Bearish After Topside SweepBitcoin has just completed a clean sweep of the old all-time high, which served as a major liquidity grab. This move has cleared out buy-side liquidity at the very top, creating the perfect environment for a shift in momentum. Price action shows a clear rejection after the sweep, suggesting that the market may now be poised to reach for sell-side liquidity.
Inversion Structure and CISD
On the 4H timeframe, we have a well-defined inversion fair value gap forming immediately after the high was taken. This aligns with the CISD concept, as the liquidity sweep at the top acted as inducement before a sharp displacement to the downside. The CISD level has already been retested, confirming the shift in structure and reducing the likelihood of another deep revisit before the next leg down.
Bearish Pathway
From here, price could either continue to slide directly or first pull back into a nearby imbalance before continuing lower. Both scenarios favor the downside, as the order flow remains bearish after the displacement. A further push down is likely to aim for sell-side liquidity resting below the recent swing low.
Key Downside Objective
The primary target sits at the confluence of a marked liquidity pool and a lower fair value gap. This is a high-probability area for price to react, as it combines the sweep of the recent low with a fill of unmitigated inefficiency. Once that zone is reached, we can reassess for potential reversals or continuation patterns.
Expectation
The market has already shown its intent by taking the highest liquidity first, shifting structure, and respecting the CISD framework. Unless the upside imbalance is filled in a deeper retrace, the path of least resistance remains lower toward the highlighted fair value gap.
Conclusion
With liquidity above already cleared and the CISD retested, the focus now shifts to the liquidity resting below. The alignment between structure, inefficiency, and liquidity targets supports a bearish continuation into the marked zone before any meaningful bounce.
Disclosure: I am part of Trade Nation's Influencer program and receive a monthly fee for using their TradingView charts in my analysis.
___________________________________
Thanks for your support!
If you found this idea helpful or learned something new, drop a like 👍 and leave a comment, I’d love to hear your thoughts! 🚀
EURUSD – Climbing for Liquidity, Then What?EURUSD continues to move within a well-defined ascending channel, respecting both the upper and lower trendlines. After the recent rejection from the lower boundary, price found support inside a fair value gap, triggering a strong bullish reaction. This bounce has maintained the overall bullish structure, keeping the uptrend intact for now.
Fair Value Gap Retest
The fair value gap retest provided a clean entry for buyers, confirming demand at that level. This reaction reinforced the idea that liquidity was likely collected from the lows, giving the market fuel to push higher toward key resistance levels.
Short-Term Bullish Path
From here, price is approaching a major liquidity area above recent highs. This level may act as a magnet, drawing price upward for a sweep of buy-side liquidity. A continuation beyond that could result in a direct test of the upper trendline.
Potential Bearish Reversal Setup
If the upper boundary of the channel is reached, the reaction there will be critical. A sharp rejection from that area could trigger a deeper retracement, potentially driving price back toward the mid-range or even retesting the lower trendline. A liquidity sweep followed by bearish displacement would confirm this shift.
Key Scenarios Ahead
There are two primary outcomes to watch. First, price could sweep the current high and reverse lower, respecting the channel structure. Second, price could break through, reach the upper trendline, and then roll over for a larger corrective move. In both cases, the reaction after liquidity is taken will define the next directional leg.
Conclusion
At this stage, EURUSD is in a controlled uptrend, but the next high-probability move depends on how price behaves around the key liquidity level above. The plan is to monitor for either a sweep and rejection or a push to the upper trendline for a potential reversal.
Disclosure: I am part of Trade Nation's Influencer program and receive a monthly fee for using their TradingView charts in my analysis.
___________________________________
Thanks for your support!
If you found this idea helpful or learned something new, drop a like 👍 and leave a comment, I’d love to hear your thoughts! 🚀

EURUSD Technical Analysis (Educational Breakdown) EURUSD Technical Analysis (Educational Breakdown)
1. Market Structure Overview
The chart shows a clear downtrend phase that started after failing to break the major resistance around 1.1780 – 1.1820.
Price formed lower highs and eventually broke below a rising trendline, signaling a shift from bullish momentum to bearish control.
Recent movement shows a retracement toward a defined entry zone, suggesting a short-term pullback opportunity.
2. Key Levels
Resistance Zone (1.1780 – 1.1820): This area has acted as a strong supply zone in the past, rejecting bullish attempts and triggering heavy sell-offs.
Support Zone (1.1340 – 1.1380): A key demand area where previous reversals took place.
Current Entry Zone: Between 1.1697 – 1.1750, aligning with a minor resistance zone and previous supply reaction.
3. Price Action Insights
Fair Value Gap (FVG) identified earlier near 1.1700 served as a reaction zone before a push downward.
The price is now revisiting an area near the previous imbalance, which aligns with a confluence of resistance and short-term overbought conditions.
If price action rejects the entry zone, a bearish swing toward 1.1534 is likely.
4. Trade Setup Idea (Short Bias)
Entry: 1.1697 – 1.1750 (retest of broken structure).
Stop Loss: Above 1.1772 to avoid stop hunts beyond resistance.
Target: First take profit at 1.1534; extended target toward 1.1400 if bearish momentum persists.
5. Risk Management & Educational Note
This setup is based on supply & demand principles plus market structure shifts.
Always confirm entries with lower-timeframe rejection patterns before executing.
Protect capital with a maximum of 1–2% risk per trade and adjust lot sizes accordingly.
📌 Summary:
EURUSD is currently testing a high-probability short zone after a structural breakdown. If rejection occurs, sellers could push price toward mid-range support at 1.1534, and potentially deeper toward the 1.1400 zone. However, if bulls manage to reclaim and close above 1.1780, this bearish view becomes invalid.

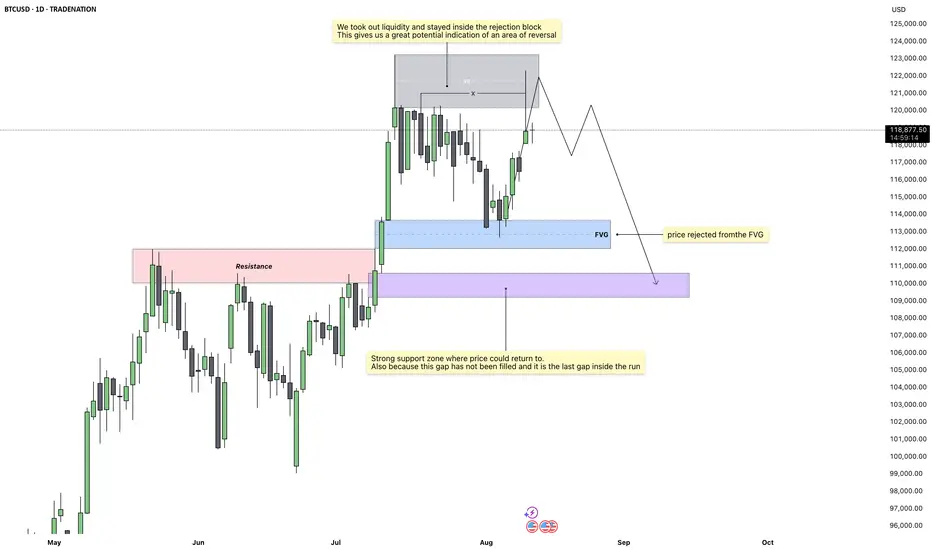
Bitcoin – The Last Stop Before the DropMarket Overview
Price action on the daily chart has shown a decisive move into a key rejection block after taking out recent liquidity. This is a classic sign of exhaustion in the current move, suggesting that momentum may now begin to shift in the opposite direction. The daily close reinforced this idea, showing a clear respect for higher-timeframe resistance levels.
Rejection Block Context
The 4H and daily rejection blocks have aligned, creating a strong confluence zone where sellers have stepped in before. Price did not just test this area, it closed within it, which often indicates a high probability of reversal. This setup builds confidence that the market could be preparing for a retracement.
Liquidity Sweep Confirmation
Before the rejection occurred, price ran through a cluster of resting liquidity above recent highs. This liquidity grab often acts as the fuel for a reversal, as it traps late buyers and allows larger players to shift price in the opposite direction.
Fair Value Gap Target
Below current price, there remains an unfilled gap which is the final gap inside the current run. Historical price behavior shows that such gaps tend to get filled before a fresh move can develop. This unfilled zone provides a clear downside target.
Bearish Scenario
If the rejection holds, I expect price to work its way lower toward the 110k range, filling that remaining gap before any sustained bullish move can resume.
Conclusion
With liquidity taken, a clean rejection from higher-timeframe resistance, and an untouched gap below, the chart is aligning for a potential retracement. I am watching for continued weakness to confirm the move toward the 110k region.
Disclosure: I am part of Trade Nation's Influencer program and receive a monthly fee for using their TradingView charts in my analysis.
___________________________________
Thanks for your support!
If you found this idea helpful or learned something new, drop a like 👍 and leave a comment, I’d love to hear your thoughts! 🚀
EURUSD - Bullish fair value gap and fibonacci support!At the end of July, EUR/USD experienced a sharp and decisive move to the downside, signaling a strong bearish momentum in the market. Following this decline, the pair began to recover, steadily climbing and partially filling the 4-hour Fair Value Gap (FVG). After tapping into the 4-hour FVG, price action has entered a corrective phase, moving lower towards a confluence of bullish levels. This area is defined by both the 1-hour and 4-hour FVGs, which align perfectly with the golden pocket of the Fibonacci retracement tool, a high-probability zone often watched by traders for potential reversals.
Bullish Support
The key bullish support zone sits around the 1.158 to 1.160 range. This area holds significant importance because it combines two strong technical factors: the 1-hour and 4-hour FVGs, as well as the golden pocket Fibonacci retracement. The overlap of these technical elements often acts as a magnet for price and can create a strong foundation for a bullish reaction. If the market respects this zone, we could see EUR/USD push higher in the short term, as traders capitalize on the support to drive price towards higher resistance areas.
Bearish Resistance
On the upside, the main bearish resistance zone lies between 1.170 and 1.174. This area represents the final portion of the unfilled bearish 4-hour FVG and could act as a significant barrier for further bullish progress. If price returns to this level, the strong supply pressure could result in a sweep of recent highs, fully filling the 4-hour FVG before potentially resuming the downward trend. This scenario aligns with the idea that sellers may re-enter the market aggressively once this resistance zone is tested.
Final Thoughts
Given the current market structure, my expectation is that the bullish support zone around 1.158 to 1.160 will hold, providing a potential launchpad for price to revisit and possibly complete the filling of the bearish 4-hour FVG near 1.174. However, if the market breaks decisively below the 1-hour FVG, it could indicate a shift in sentiment, opening the door for a bearish continuation and deeper downside targets. The coming sessions will be critical in determining whether EUR/USD can maintain bullish momentum or if sellers will regain control.
-------------------------
Disclosure: I am part of Trade Nation's Influencer program and receive a monthly fee for using their TradingView charts in my analysis.
Thanks for your support. If you enjoyed this analysis, make sure to follow me so you don't miss the next one. And if you found it helpful, feel free to drop a like 👍 and leave a comment 💬, I’d love to hear your thoughts!

USDZAR. The USDZAR is ready to rally but the daily equal lows are suspect. It would be great to see them swept before it rallies, but that will depend on how they use the news.

Cable & Fibre!So, generally I'm happy with the way the market is going. Though a little bit uncertain about how high it wants to go before it resumes its downward spiral, things are going good so far.
Looking at Cable, on an hourly chart, we see that between 06:00 am and 08:00 am (New York Time), there is FVG formed and to its left, there is a breaker. This a perfect setup for me, but I will wait to see if price actually wants to go above the 1.3477 level to reach for the 4H as well as 1H FVG.
I've put a sell limit on the fibre at 1.1635, but I will remove it for now, 'till I have confirmed whether price will go above 1.1698 level, to go into the 4H FVG, the mid-point thereof. I have a sell limit there with a stop loss at .1745.

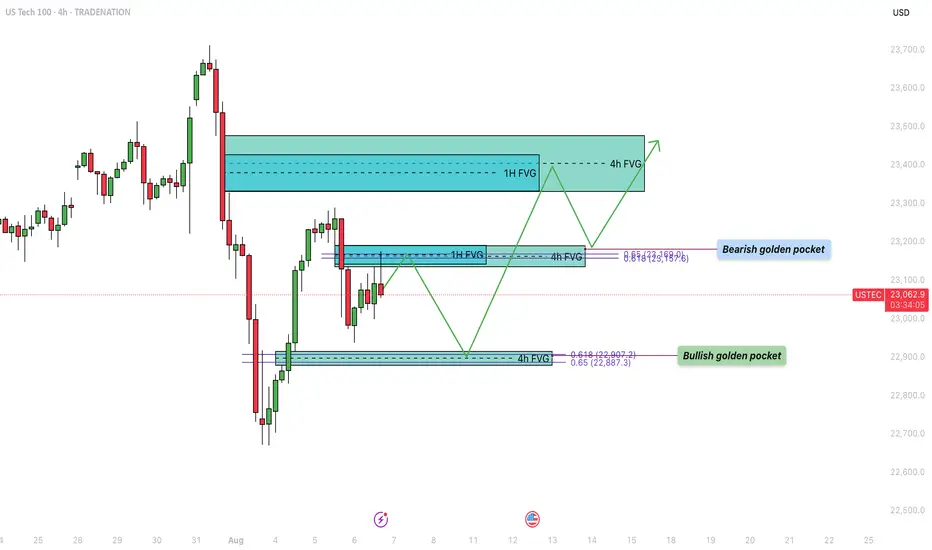
US100 - Bullish trajectory to fill the inbalance zones!Over the past week, the US Tech 100 (US100) experienced a sharp decline, dropping into a significant support zone. During this bearish move, several fair value gaps (FVGs) formed on both the 4-hour and 1-hour timeframes, which remain unfilled. Currently, price action is retracing upward, aiming to fill these imbalances. The structure of the market suggests that both bullish and bearish scenarios are in play, depending on how price reacts to key levels marked by these FVGs and Fibonacci retracement zones.
Bearish Resistance
The first major area of resistance is located around the $23,160 level, which has just been tapped. This zone presents a strong potential turning point due to the confluence of a 1-hour and a 4-hour fair value gap, which perfectly align with the 0.618–0.65 Fibonacci retracement level, also known as the golden pocket. This cluster of technical signals increases the probability that this level will act as a strong supply zone, potentially initiating a rejection back toward the lower support area.
Bullish Support
On the downside, a key level to watch is around $22,900. This zone marks a 4-hour FVG that was formed during the recent upward move. Importantly, this area also coincides with the golden pocket from that very same leg up, offering a compelling confluence for bullish support. If price revisits this level, it may act as a strong demand zone, providing a springboard for the next leg higher, particularly if buyers step in aggressively to defend it.
Bullish Trajectory
If support at $22,900 holds, the bullish trajectory suggests a possible continuation toward the $23,400 region. This upper target contains a large overlapping 1-hour and 4-hour FVG that remains unfilled. Historically, price tends to revisit and fill such imbalances before choosing a definitive direction. A bounce from the lower support zone and a successful break of the $23,160 resistance could pave the way for a clean move toward this higher target, completing the FVG fill sequence.
Final Thoughts
The US100 is currently navigating a key technical crossroads. With multiple unfilled fair value gaps and well-aligned Fibonacci levels on both the upside and downside, the next few sessions will be critical in determining short-term direction. If the $23,160 resistance continues to hold, a pullback to $22,900 could offer a high-probability long setup, while a clean break above this resistance opens the door to filling the higher FVGs.
-------------------------
Disclosure: I am part of Trade Nation's Influencer program and receive a monthly fee for using their TradingView charts in my analysis.
Thanks for your support. If you enjoyed this analysis, make sure to follow me so you don't miss the next one. And if you found it helpful, feel free to drop a like 👍 and leave a comment 💬, I’d love to hear your thoughts!
GBPUSDNo surprises. As you know, cable and fibre move together! What we need to see is about a 50 pip move to reach the highlighted FVGs. The BoE was used to trigger the move and I still expect it to see it got higher, clearing the 1 hour equal highs!
Stay safe and don't blow your account!
