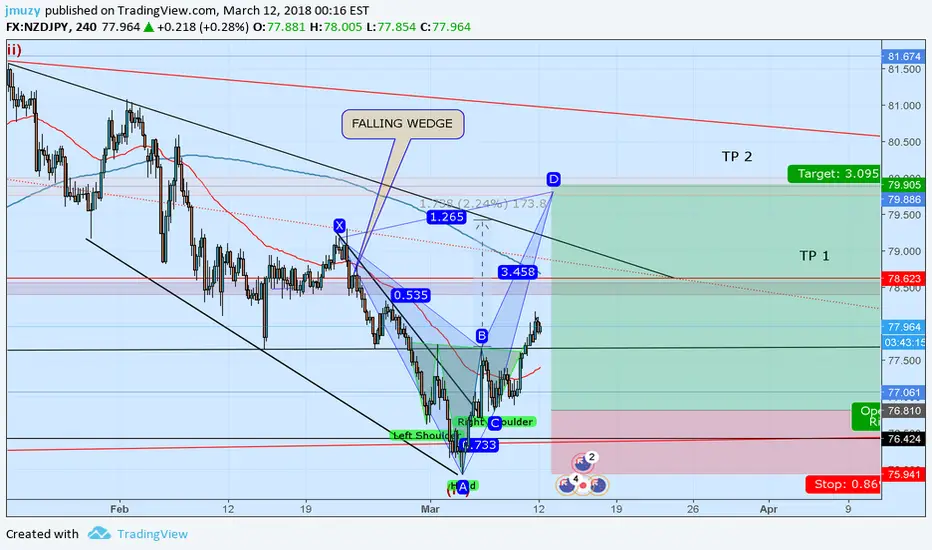
Bullish breakout confirmed; following eve bottom preciselyNot unexpected the great bullish price action I woke up to this morning but still a great feeling to finally see the breakout from the falling wedge I had been expecting finally triggered. What's more than that, if you look at the bpottom wick of the current day candle you will see it bounced upward off of the eve bottom that I have laid out precisely, further giving credibility to the eve bottom I have drawn out. Hopefully more traders(bears specifically) will tqke my hypothesis more seriously now that we are continuing to see it play out to a t. I hope all who have been following my ideas thus far have been accumulating some of the top alt coins at a very cheap discount leading up to this, I remain truly optimistic that we will be experience a bullish 2nd quarter and possibly even a new all time high during this second quarter....For now though we are just trying to take it one step at a time and this first step of a higher high after achieving all these multiple higher lows is monmental. Next we want to see one more consecutive higher high to confirm the bulls have taken back control...after that we will be looking to break the neckline of the double bottom by reaching 10400-10500 by the 4th or 5th of May and hopefully by then we have had enough upward momentum to flip the death cross back over to a golden cross to give us another great bullish boost as well. All those conditions combined I think could certainly eventually lead us to a new ath...but don't be araid to take some profits along the way. Best of luck and thanks for reading!
Falling

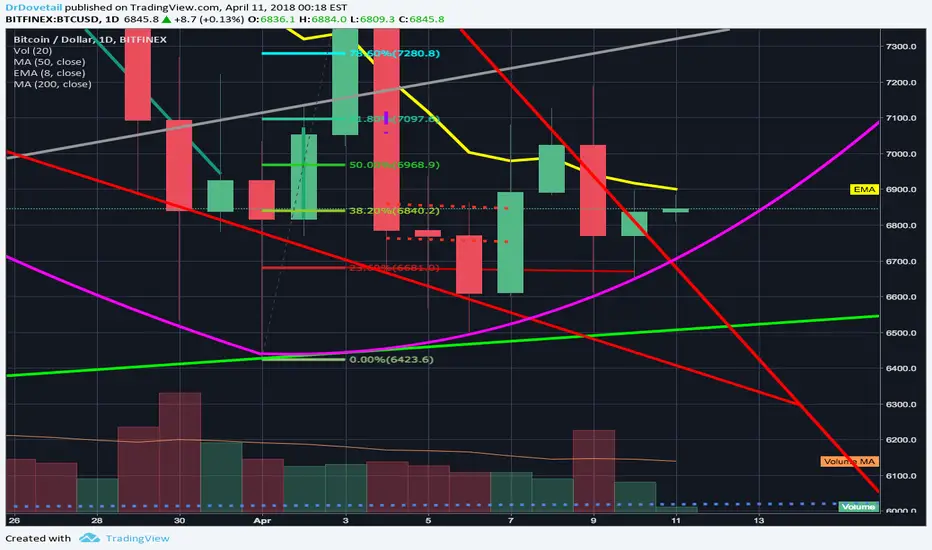
BTC reaching the apex of falling wedge; Adam & Eve still in playA quick update we are reaching a pivotal point as we approach the apex of this falling wedge as well as continuing to follow this potential eve bottom quite precisely. You can see here on the 1 day chart we are currently up outside the falling wedge on the current 1 day candle...like the previous 1day candle, it is finding strong resistance at the t line(in yellow) However this candle has a double reinforced support of both the eve bottoms trendline, and the 23.60% fibonacci retracement line(in red at 6680). This retracement line has served as both very strong support and very strong resistance over the last week or so as the eve bottom has been slowly rounding out and making its turn back upwards, and now that we are above that fib line as well as having it double reinforced with the eve trendline, should prove to provide enough support to keep the price action up out of the falling wedge...which should result in a big bullish volume spike in the coming few days. It could by chance drop back down into the falling wedge and wait until closer to the end of it to breakout which would invalidate and eve bottom but instead likely result in a more traditional standard double bottom considering the falling wedge ends at the exact same pricepoint as february's low....either way we have good odds in favor of one of the 2 double bottoms so I will side with that probability while at the same time of course being prepared for the exact opposite outcome should it occur, where if we dip and stay below 6400 we can trigger a massive head and shoulders that could take us down as far as the 3,000s(less likely in my opinion) If we can find a way to close above the tline on this current candle I'd say we will likely see a big bullish volume spike to confirm the breakout on the follow up candle..for now we shall wait and see.
its ok to revise your pattern bundariesIts ok to revise your pattern boundaries as the chart action provides new data. As you can see I was stopped on this trade in a bulltrap. I have marked my original upper wedge boundary and my revised boundary. I always chart based on best fit. I consider things like number and strength of touchpoints with the line among other things. In this case I choose to view the price action on 3/24 where we break above the original upper boundary, the activity was very weak. I choose to connect 3 points on my boundary rather than the two if you look at the 3/24 price action as the upper boundary point. Now that their was a break of my trendline that allows me to connect it to the 3/24 high to reconstruct the new upper boundary to my wedge. As you can see a long position taken at ~7120 quicky becomes a loser and get stopped at ~6900 as a loser. This initial entry was small with a double down entry to be executed above 7201 that was not filled. -3% on this trade, this was the bulltrap.
Happy trading, stay agnostic.

XMR - Monero falling wedgeOn the 1H time frame we see good signals on the StochRSI and a MACD cross that could lift things off for a potential breakout.
(This is not financial advice, this is a volatile market where anything can happen)

BTC Possible restest strong support and downtrend continuationBTC currently in a falling wedge.
Was not able to break out yet.
If it won't break out soon I think it will test strong support at the .786 at 6599 USD again (grey fib level).
Break out of falling wedge does not mean that the bear market is over. Lots of resistance above it.
If the 6599 support breaks I think BTC will be headed towards at least 4400-5000; between the yellow and white fib levels.

BTC Critical LevelBulls want to see Falling Wedge breakout sooner than later. Wedge breakout target to test descending channel upper boundary at 9000. Bears want to see trading below 6400 range for continued downside.

Bitcoin Vision Clear As Day -> Dont Fight The Technicals We have a clear picture being painted, down before we can go up. We need a capitulation in order to get back up. So just sit tight and wait for the right entry. Market is very depressed due to price action, buyers that are entering are quickly exiting positions causing the market price to decline. We will be breaking down the final support that we have and then its a free fall down to lower levels where we started this trend of around $5,000 area.
This area should have lots of support and buyers coming in. Best case scenario is that we bounce from the $5k level and start the next bull run that will get us up to the $15k levels by Q2 -
Q3 We should experience a retest of the $7500ish area with a then massive bull run into Q4 to put us near the ATH.
Our worse case scenario is that we bounce from the $5k then fail a retest of the $8,500-10k area and come back down to the $3,000 level fail at the $5k and retest $1,800. This scenario is unlikely. I would say 18-23% likely hood.
This is not to be used as trading advice, just some friendly charting!
Check out my other charts and subscribe!

Final shakeout for Bitcoin? Double bottom & Falling Wedge?Adam and Eve double bottom for Bitcoin looking more and more likely after a successful retest of the double bottom lows.
Let's see if the volume continues to head back up and capital continues to re-enter the market.

BTC is suffering from P.EAs you can see BTC got really excited, tried to get it up to 7.2k . The girl was so sexy, he only lasted a few minutes. Get it when it drips on the ground


Bitcoin breakout falling wedge and going to 10700I think btc break out of falling wedge and is going 2400$ up as wedge height , target is 10700 and it`s clearly fit elliott waves theory.
feel free to comment your idea here.

EOS - Falling. But reversal incoming?Appears to be a falling wedge pattern. In any event, the TA for this weekend doesn't look great. RSI is descending. Trade within range, but monitor carefully
Breakout: when?

BCH/BTC Falling Wedge (Bullish)Bullish Trend - Falling Wedge - Watch for a breakout of the upper trend line for a great BUY opportunity.

LTCUSD - Falling wedgeLooking at the 4h chart of LTCUSD , there is a falling wedge which is currently sitting on support. If it breaks this support, we will either break bearish but if it bounces off the bottom of the wedge, we might break bullish.

$btc / $usd Falling Wedge - Possible Bull ScenarioPossible Bullish scenario for BTC
Falling Wedge
Bullish Reversal
Descending Volume Profile
Near major fib levels

Bad scenario to BTC.Dears,
O Bitcoin depois de ter rompido a LTB e que sem força e voltou abaixo da linha e acabou perdendo força compradora deixando somente um topo duplo. Depois de uma semana de queda forte o preço testou e perdeu suportes importantes encontrando um ponto de suporte proximo a retração de Fibo em 61.8% e acabou por fazer um pequeno "pullback" que acabou devolvendo praticamente todo movimento. Então no momento temos uma lateralização. Com uma volatilidade bem menor do que o esperado.
Acontece que depois da formação de topo duplo temos agora uma BEARFLAG, uma figura que continuaçao, onde teriamos a continuidade portanto do movimento de queda. Podemos projetar o preço caindo mais uma vez abaixo dos 8k.
O preço deve testar pra isso novamente a região de suporte em 8300 e tambem a LTA.
O final da projeção de queda é perto de 6800.
Por outro lado tambem podemos ter a formação de um fundo tripo nesse suporte de 8300 e a retomada de alta buscando a LTB com mais força e finalmente rompendo.
Isso é nesse caso uma visão otimista para o preço.
The Bitcoin after having broken the LTB and that without strength and returned below the line and ended up losing buyer force leaving only a double top. After a week of strong fall the price tested and lost important supports finding a point of support near the retraction of Fibo in 61.8% and ended up making a small "pullback" that ended up returning almost all movement. So it's not a moment, a last back-up. With a much lower volatility than expected.
It turns out that after the top formation, as low as possible, a BEARFLAG, a figure that continues, where is a continuity, therefore the movement of fall. We can project the falling price once more below the 8k.
The price should test for this time in the 8300 support region and also the LTA.
The end of the fall projection is close to 6800.
On the other hand we can also have a formation of a tripod bottom in the support of 8300 and a high resumption seeking a LTB with more strength and finally breaking.
This is a case of an optimistic view for price.

Breakout Long idea Falling wedge + HarmonicsLooking for buy opportunitys all the way up. Please facilitate on a lower timeframe. :)
ETH/USD Downtrend Breaking Basically, this prediction will live if BTCUSD will continue to fall after it reaches $10200-10300, which is now a support line.


London bridge is still falling! Get out of d way or get crushedSo my last analysis on BTC was proved to be true. Much before it touched 11k mark to fall down again, I had published that it's going to fall down. Exactly at my predicted time, we're at 10.3k again.
I would again advise you to stay away from bull traps, from the dummy head and shoulders, diamonds, cups and what nots. Open your eyes and see it yourself. It's going back to 9.4-9.7k again. It will rise up again from there so that more people can draw some lines here and there to post about bullish(buls**t) reversals, encourage you to buy and push volumes/price further up. Once their objective is achieved, they'll cash out the fiat and let you take the burden of falling bridge.

Bitcoin falling wedge breakoutOnce we break upwards out of this falling wedge I will be opening more longs with a target of the top red trendline.
It could take some time to breakout and slowly bleed along the top of the falling wedge line that's why I'm opening longs once we breakout.
I will add more long positions if we retest the falling wedge and confirm the trend reversal.
twitter.com

Down move still strong. $8730 coming. Possibly down to $7740My analysis:
If we breach the $ 9350 barrier here, the price will fall fast to 8730. There should then be some hesistation orbiting around 8800-9200. after that the price may drop even more to 7730.
See the pink horizontal lines which represent the levels that price should pass (based on my analysis).
I think the price is moving natutally to 7740 USD.
I've placed a SHORT trade at $9458. let's see how it will move.
I've placed other level. The last one is 6000 USD. It's a possible scenario. If we go below 7740, the price has a (bad) chance to go down even to 6000. If that's the case, that 6000 level
will come fast. But it's too far to take it into consideration right now
I've place BULLISH levels also in green at 12050 ,12200 and 13000, but they are too far from now
------------------
IN FRENCH:
Mon analyse:
Si nous descendons en dessous de 9350 dollars, je pense que le prix s'affolera et passera rapidement a $8730. Ensuite il y aura hésitation en orbitant autour des 8700, et
il y aura un risque de chute jusqu'à 7730.
Je ne vois pas le prix descendre en dessous des 7000.
J"ai passé un ordre de vente a la baisse (sur bitfinex) a 9458. On verra bien. Je compte stoppé dès qu'on passera en dessous de 8730. Ensuite je ferai une autre
analyse et voir s'il faut encore speculer vers le cap des 7730.
Il y a d'autre niveaux sur le graph :des niveaux haussiers mais que je prend pas en compte pour l'instant, car le marché semble etre baissier
Le prix pourrait descendre juqu'a 6000, mais c'est encore trop tot pour dire

BTD/USD - Is BTC Going to Fall From Sky Start @ 01:30 UTCVery short video simply to mark a spot on my charts of when BTC is supposed to fall to like $7800.
I came across a tweet that mentioned this and after clicking through tweet after tweet came across the orginal post. I think the guys name as Marcus Landom or something like that. Supposedly he's pretty accurate in his calls on cyrpto, so i thought I would post this video to make my chart with a vertical line of when the fall it supposed to begin. Apparently it's supposed to fall rather quickly.
I guess we will see. Let me know your thoughts.
