SYK watch 365-366: Proven Resistance to tariff recovery wave SYK struggling with previous highs now resistance.
The key zone for bulls to break is $365.54-366.31
If it dips, not much support until $343.86-347.98
Fibonacci

LULU watch $268 (again): Double Golden fibs may Break this timeLULU bounced back into the tight confluence of Goldens.
Golden Genesis at $267.70 and Golden Covid at $268.74.
These mark a major landmark in the lifetime of any asset.

ANET watch $66.72-67.41: Proven support but burnt? Bounce or DieANET retesting a well proven support zone $66.72-67.41.
It held very well during recent tests, but is weaker now.
Bulls would prove very strong if able to bounce from here.

AGCO eyes on $88.47: Golden Genesis fib may End Bounce or PopAGCO earnings bounced to a Golden Genesis at $68.47
That is the highest gravity object for a long ways away.
What happens here will determine medium term trend.
It is PROBABLE that we orbit this a few times.
It is POSSIBLE that a Break-n-Retest runs up.
It is PLAUSIBLE for a rejection to new lows.
================================================

AEHR watch $8.79-8.89: Key Resistance to tariff recovery waveAEHR trying to recover from the bottom.
Hitting key Resistance repeatedly at $8.79-8.89
If sdip then watch the Golden Covid fib at $7.90

JNJ watch $156.72-158.17: Double Golden zone to determine TrendJNJ consolidating around a major zone defined by dual Goldens.
Key is Golden Genesis at $156.72, and Golden Covid at $158.17
This is an important zone that everyone is now keenly aware of.

HOOD eyes on $49.16: Golden Genesis fib that may End BounceHOOD recovering nicely from the tariff bottoms.
Currently orbiting a Golden Genesis fib at $49.16
Looking likely to retest next fib below at $45.44

T-MOBILE stock Chart Fibonacci Analysis 043025Trading Idea
1) Find a FIBO slingshot
2) Check FIBO 61.80% level
3) Entry Point > 240/61.80%
Chart time frame: C
A) 15 min(1W-3M)
B) 1 hr(3M-6M)
C) 4 hr(6M-1year)
D) 1 day(1-3years)
Stock progress: A
A) Keep rising over 61.80% resistance
B) 61.80% resistance
C) 61.80% support
D) Hit the bottom
E) Hit the top
Stocks rise as they rise from support and fall from resistance. Our goal is to find a low support point and enter. It can be referred to as buying at the pullback point. The pullback point can be found with a Fibonacci extension of 61.80%. This is a step to find entry level. 1) Find a triangle (Fibonacci Speed Fan Line) that connects the high (resistance) and low (support) points of the stock in progress, where it is continuously expressed as a Slingshot, 2) and create a Fibonacci extension level for the first rising wave from the start point of slingshot pattern.
When the current price goes over 61.80% level , that can be a good entry point, especially if the SMA 100 and 200 curves are gathered together at 61.80%, it is a very good entry point.
As a great help, tradingview provides these Fibonacci speed fan lines and extension levels with ease. So if you use the Fibonacci fan line, the extension level, and the SMA 100/200 curve well, you can find an entry point for the stock market. At least you have to enter at this low point to avoid trading failure, and if you are skilled at entering this low point, with fibonacci6180 technique, your reading skill to chart will be greatly improved.
If you want to do day trading, please set the time frame to 5 minutes or 15 minutes, and you will see many of the low point of rising stocks.
If want to prefer long term range trading, you can set the time frame to 1 hr or 1 day.

Verizon stock Chart Fibonacci Analysis 043025Trading Idea
1) Find a FIBO slingshot
2) Check FIBO 61.80% level
3) Entry Point > 44/61.80%
Chart time frame: D
A) 15 min(1W-3M)
B) 1 hr(3M-6M)
C) 4 hr(6M-1year)
D) 1 day(1-3years)
Stock progress: A
A) Keep rising over 61.80% resistance
B) 61.80% resistance
C) 61.80% support
D) Hit the bottom
E) Hit the top
Stocks rise as they rise from support and fall from resistance. Our goal is to find a low support point and enter. It can be referred to as buying at the pullback point. The pullback point can be found with a Fibonacci extension of 61.80%. This is a step to find entry level. 1) Find a triangle (Fibonacci Speed Fan Line) that connects the high (resistance) and low (support) points of the stock in progress, where it is continuously expressed as a Slingshot, 2) and create a Fibonacci extension level for the first rising wave from the start point of slingshot pattern.
When the current price goes over 61.80% level , that can be a good entry point, especially if the SMA 100 and 200 curves are gathered together at 61.80%, it is a very good entry point.
As a great help, tradingview provides these Fibonacci speed fan lines and extension levels with ease. So if you use the Fibonacci fan line, the extension level, and the SMA 100/200 curve well, you can find an entry point for the stock market. At least you have to enter at this low point to avoid trading failure, and if you are skilled at entering this low point, with fibonacci6180 technique, your reading skill to chart will be greatly improved.
If you want to do day trading, please set the time frame to 5 minutes or 15 minutes, and you will see many of the low point of rising stocks.
If want to prefer long term range trading, you can set the time frame to 1 hr or 1 day.

Old Dominion Stock Chart Fibonacci Analysis 043025Trading Idea
1) Find a FIBO slingshot
2) Check FIBO 61.80% level
3) Entry Point > 148/61.80%
Chart time frame: D
A) 15 min(1W-3M)
B) 1 hr(3M-6M)
C) 4 hr(6M-1year)
D) 1 day(1-3years)
Stock progress: A
A) Keep rising over 61.80% resistance
B) 61.80% resistance
C) 61.80% support
D) Hit the bottom
E) Hit the top
Stocks rise as they rise from support and fall from resistance. Our goal is to find a low support point and enter. It can be referred to as buying at the pullback point. The pullback point can be found with a Fibonacci extension of 61.80%. This is a step to find entry level. 1) Find a triangle (Fibonacci Speed Fan Line) that connects the high (resistance) and low (support) points of the stock in progress, where it is continuously expressed as a Slingshot, 2) and create a Fibonacci extension level for the first rising wave from the start point of slingshot pattern.
When the current price goes over 61.80% level , that can be a good entry point, especially if the SMA 100 and 200 curves are gathered together at 61.80%, it is a very good entry point.
As a great help, tradingview provides these Fibonacci speed fan lines and extension levels with ease. So if you use the Fibonacci fan line, the extension level, and the SMA 100/200 curve well, you can find an entry point for the stock market. At least you have to enter at this low point to avoid trading failure, and if you are skilled at entering this low point, with fibonacci6180 technique, your reading skill to chart will be greatly improved.
If you want to do day trading, please set the time frame to 5 minutes or 15 minutes, and you will see many of the low point of rising stocks.
If want to prefer long term range trading, you can set the time frame to 1 hr or 1 day.

KNIGHT SWIFT stock Chart Fibonacci Analysis 043025Trading Idea
1) Find a FIBO slingshot
2) Check FIBO 61.80% level
3) Entry Point > 36.6/61.80%
Chart time frame: D
A) 15 min(1W-3M)
B) 1 hr(3M-6M)
C) 4 hr(6M-1year)
D) 1 day(1-3years)
Stock progress: C
A) Keep rising over 61.80% resistance
B) 61.80% resistance
C) 61.80% support
D) Hit the bottom
E) Hit the top
Stocks rise as they rise from support and fall from resistance. Our goal is to find a low support point and enter. It can be referred to as buying at the pullback point. The pullback point can be found with a Fibonacci extension of 61.80%. This is a step to find entry level. 1) Find a triangle (Fibonacci Speed Fan Line) that connects the high (resistance) and low (support) points of the stock in progress, where it is continuously expressed as a Slingshot, 2) and create a Fibonacci extension level for the first rising wave from the start point of slingshot pattern.
When the current price goes over 61.80% level , that can be a good entry point, especially if the SMA 100 and 200 curves are gathered together at 61.80%, it is a very good entry point.
As a great help, tradingview provides these Fibonacci speed fan lines and extension levels with ease. So if you use the Fibonacci fan line, the extension level, and the SMA 100/200 curve well, you can find an entry point for the stock market. At least you have to enter at this low point to avoid trading failure, and if you are skilled at entering this low point, with fibonacci6180 technique, your reading skill to chart will be greatly improved.
If you want to do day trading, please set the time frame to 5 minutes or 15 minutes, and you will see many of the low point of rising stocks.
If want to prefer long term range trading, you can set the time frame to 1 hr or 1 day.

Buy gold, there is a rebound in the short term!Fundamentals:
Focus on US economic data and Fed dynamics;
Technical aspects:
Gold fell below 3290 as expected, and even fell below 3280 beyond expectations. Our short positions also made a lot of money. At present, gold continues to fall to around 3272. Although the short momentum is relatively obvious, it is already close to the recent low support of 3265-3260. I think that before the NFP market, gold may not form a unilateral downward trend, so there are still repeated ups and downs in the short-term trend. Therefore, when approaching the low support area of 3265-3260, we might as well consider short-term long gold.
Trading strategy:
Consider going long gold in the 3275-3265 area, hoping that gold can rebound to the 3285-3295 area.

Gold Short: Update to wave counts and H&SThis is an update to the Gold short idea that I posted yesterday. I showed how we can draw another head-and-shoulders and demonstrated how to use Fibonacci extensions set take profit targets.

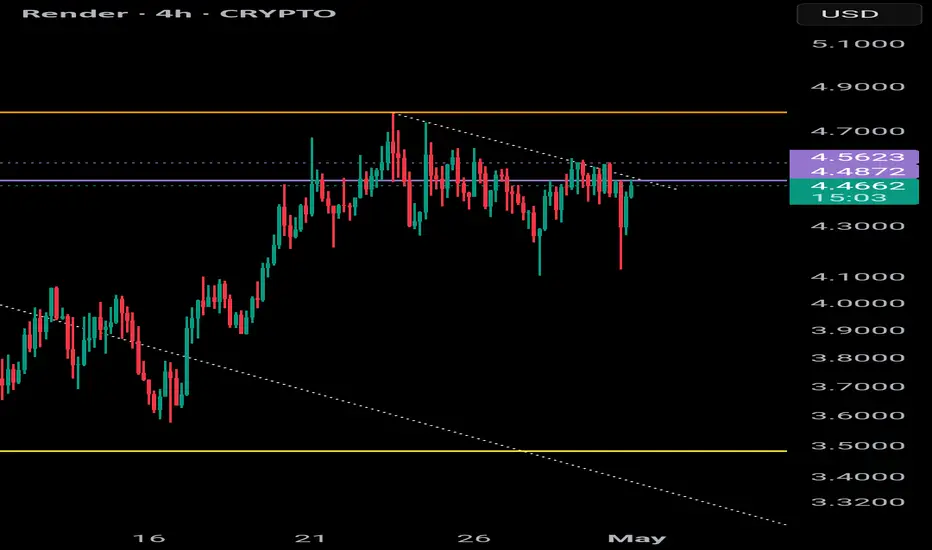
RENDER Conditional longRENDER appears to be reacting to
the fibonacci levels. Currently finding
resistance @ the 382. If price starts to
break above this level I believe the next
natural step would be the 236
Conditional order long if we break
4.52 (which also represents a break of
a downtrend on the micro Timeframe -
zoom into the hourly)
Setting TP @ 6.3 which is just
underneath key resistance points.

RENDER conditional longRENDER appears to be reacting to the fibonacci levels. Currently finding resistance @ the 382. If price starts to break above this level I believe the next natural step would be the 236
Conditional order = long if we break 4.52 (which also represents a break of a downtrend on the micro Timeframe - zoom into the hourly)
Setting TP @ 6.3 which is just underneath key resistance points.
GBPUSD ANALYSIS From the previous trading day we see that the market closed on bearish but looking at the big picture we can see that the pair is still in a bullish tend

EURJPY ANALYSISA quick breakdown into what to expect on eurjpy for the new trading day after seeing the daily candle close really bearish and the 4hr still pushing to the downside in terms of structure

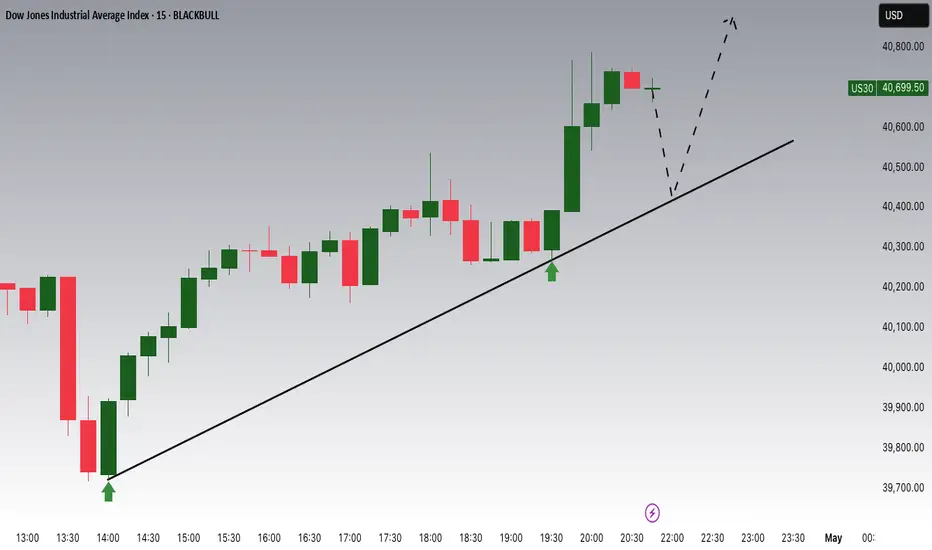
Dow Jones Potential UpsidesHey Traders, in today's trading session we are monitoring US30 for a buying opportunity around 40400 zone, Dow Jones is trading in an uptrend and currently is in a correction phase in which it is approaching the trend at 40400 support and resistance area.
Trade safe, Joe.
Franco-Nevada Breakout — Is $160 the Launchpad?With gold breaking to new all-time highs and capital rotating into high-quality royalty names, Franco-Nevada looks poised to lead the charge in the next leg of the bull market.
After spending nearly 3 years in a wide consolidation ($106–160), FNV has now posted a clean monthly close above $160 — the key resistance level that capped every rally since 2020. This is not just any breakout — it's the classic "base + breakout" structure that often precedes major upside moves.
🔍 Technical Highlights:
✅ Multi-year base breakout confirmed on monthly close
✅ Strong confluence of Ichimoku, MAs & low-volume node just above $160
✅ $160 flips from resistance to structural support (role reversal)
🎯 Measured Move Target: $230
📍 Initial Target Zone: $208–215
📈 Retest of $160 offers a ~30% upside with tight risk
🛑 Risk Management: A pullback that holds $160 on weekly/monthly close would validate the breakout.
Breakdown below $160 on volume would put the move on hold and reintroduce range risk.
💡 Bottom Line: This is a textbook breakout with asymmetric risk/reward. While gold gets the headlines, Franco-Nevada may quietly be leading the charge in royalty sector performance.

LINK/USDT 4H Chart ReviewHello everyone, let's look at the 4H chart LINK to USDT, in this situation we can see how the price was moving in a downward channel, from which we saw an exit to the top and the formation of a new local uptrend line.
Let's start by defining the targets for the near future that the price has to face:
T1 = 15.08 USD
T2 = 16.87 USD
Т3 = 17.93 USD
Т4 = 19.07 USD
Now let's move on to the stop-loss in case the market continues to fall:
SL1 = 13.98 USD
SL2 = 13.12 USD
SL3 = 11.74 USD
SL4 = 10.76 USD
SL5 = 9.48 USD
If we look at the RSI indicator we can see how the price correction gave a strong rebound on the indicator, which could potentially give strength for new growth.

SPX as an exampleCorrect me if I'm wrong, but this has got to be one of the craziest monthly candlesticks the stock markets have ever printed, and perfectly completes a potential wave 4 in a 5 wave count.

GBPUSD I Weekly CLS, KL - M OB, Model 1 , Target 50% CLSHey, Market Warriors, here is another outlook on this instrument
If you’ve been following me, you already know every setup you see is built around a CLS range, a Key Level, Liquidity and a specific execution model.
If you haven't followed me yet, start now.
My trading system is completely mechanical — designed to remove emotions, opinions, and impulsive decisions. No messy diagonal lines. No random drawings. Just clarity, structure, and execution.
🧩 What is CLS?
CLS is real smart money — the combined power of major investment banks and central banks moving over 6.5 trillion dollars a day. Understanding their operations is key to markets.
✅ Understanding the behaviour of CLS allows you to position yourself with the giants during the market manipulations — leading to buying lows and selling highs - cleaner entries, clearer exits, and consistent profits.
🛡️ Models 1 and 2:
From my posts, you can learn two core execution models.
They are the backbone of how I trade and how my students are trained.
📍 Model 1
is right after the manipulation of the CLS candle when CIOD occurs, and we are targeting 50% of the CLS range. H4 CLS ranges supported by HTF go straight to the opposing range.
📍 Model 2
occurs in the specific market sequence when CLS smart money needs to re-accumulate more positions, and we are looking to find a key level around 61.8 fib retracement and target the opposing side of the range.
👍 Hit like if you find this analysis helpful, and don't hesitate to comment with your opinions, charts or any questions.
⚔️ Listen Carefully:
Analysis is not trading. Right now, this platform is full of gurus" trying to sell you dreams based on analysis with arrows while they don't even have the skill to trade themselves.
If you’re ever thinking about buying a Trading Course or Signals from anyone. Always demand a verified track record. It takes less than five minutes to connect 3rd third-party verification tool and link to the widget to his signature.
"Adapt what is useful, reject what is useless, and add what is specifically your own."
— David Perk aka Dave FX Hunter ⚔️

GOLD → Consolidation. Traders are waiting for news...FX:XAUUSD remains in consolidation at 3370-3270. Traders are in no hurry to take any action, as there is a lot of important news ahead. Let's take a closer look at the situation...
On Wednesday, gold is trading lower, remaining in a sideways range as traders await the release of US GDP data for the first quarter. A sharp slowdown in growth is expected, and a possible contraction in the economy could increase bets on a Fed rate cut and support gold. Meanwhile, the dollar is holding steady amid tariff news and expectations for key employment and inflation data.
A retest of the range support is forming. The approach is quite sharp, and the pre-breakout potential has been exhausted. A false breakout of support could trigger an upward correction.
Support levels: 3270, 3245
Resistance levels: 3314, 3329, 3352
If the dollar continues to fall after the news, this could support gold and the price could continue to trade between 3370 and 3270. Unpredictable news could trigger a breakout and a fall.
Best regards, R. Linda!
