4 possible scenario on bitcoinConsidering Bitcoin's ascending channel, Fibonacci expansion and retracement levels, and the current fundamental situation, these movements can be predicted for Bitcoin.
This is purely a technical analysis and should not be used for trading!
Fibonacci

GOLD → A false breakdown of support will lead to growthFX:XAUUSD is trading within the range of 3370-3270. Since the opening of the session, the price has lost its potential for further decline. There is no news on Friday, so after retesting the liquidity and support zone of 3283-3270, the price is likely to return to growth.
Gold stabilizes near $3,350, but growth is held back by the dollar
On Friday, gold held its ground after recovering, but further growth is limited by the strengthening dollar and hopes for progress in the tariff war negotiations...
Optimism about corporate earnings in the US and easing recession fears are supporting demand for the dollar. However, ongoing uncertainty in US-China relations is keeping interest in gold alive.
Markets are waiting for new signals from the White House and the Fed, which will determine the further movement of gold prices towards the end of the week.
Focus on supporting the trading range. A false breakdown of 3283-3270 could change the balance of power, leading to a rebound or growth.
Resistance levels: 3314, 3342, 3370
Support levels: 3283, 3270, 3244
There is no news today, except for the unpredictable Trump and the general situation with the tariff war. Any speech or tweet could shake the market. However, after a neutral week, gold remained within the range, and the market is likely to keep the metal within the flat on Friday. Accordingly, I expect a rebound from support and growth to the intermediate resistance lines indicated above.
Best regards, R. Linda!

LTC Mid Term Analysis As far as I can see, Litecoin is still moving within a wide channel that has remained reliable for years.
If you ignore the volatility and short-term fractals, Litecoin has consistently provided profits to early investors who were patient enough to wait.
Before this summer, I anticipate that LTC will reach at least $100 to $106.
The main target should be much higher, but predicting the future is a bit more difficult at the moment.
Due to new U.S. policies and other fundamental events, the target price should be kept at moderate levels for now.

XRP Short Term Analysis (4H)XRP is exhibiting bullish signals supported by multiple technical indicators.
An Inverse Head and Shoulders pattern has clearly formed on the chart, indicating a potential reversal from the previous bearish trend. Additionally, the downward trendline appears to be breaking out with increasing volume, which reinforces the breakout confirmation.
From an Elliott Wave Theory perspective, we seem to be in wave 3, which is typically the most impulsive and extended leg of the five-wave cycle.
Given the structure and momentum, a conservative price target lies at the $2.30 level, representing the measured move from the neckline of the H&S formation.
Further upside may follow if wave 3 unfolds as expected, but short-term corrections should also be anticipated.
Risk management remains essential, as macroeconomic factors and fundamental news may cause volatility.
— Thanks for reading.

S (EX FTM) Update (4H)Like many other altcoins, S has formed an Inverse Head and Shoulders pattern, signaling a potential trend reversal.
Additionally, a bullish flag formation has broken out on the lower timeframes, further confirming the upward momentum.
The current price structure appears suitable for long positions, especially with confluence from multiple technical signals.
A conservative target lies around the $0.64 level, based on the measured move projections from the flag and neckline breakouts.
— Thanks for reading.

Aptos Will Prove Its Worth (Daily Analysis)After breaking out from a simple trendline, Aptos (APT) has gained significant momentum, similar to many other altcoins over the past two weeks.
However, Aptos is currently presenting a unique structural situation. It appears to have completed a full five-wave bearish impulse and has now transitioned into a new five-wave bullish impulse. From a daily timeframe perspective, Aptos seems to be developing wave 1 of this new cycle.
A closer examination of Aptos’ historical price movements reveals some interesting patterns: • During the previous bullish phase, Aptos formed a reversed Head and Shoulders pattern. • Following the breakout of a key trendline, Aptos rallied to levels that were largely unexpected by the market. • The previous cycle took exactly four months to reach its lower high, aligning precisely with the Fib Time Zone (Level 4) before retracing.
Assuming that history tends to repeat itself (and being conservatively pessimistic), Aptos could potentially reach the $10 region again this summer.
There are two major additional reasons supporting this outlook:
Wave 3's potential target in this cycle aligns perfectly with a high-liquidity zone, increasing the probability of a strong upward move. (Refer to the previous bullish cycle’s Wave 3 in the Fib retracement for additional confirmation.)
A new reversed Head and Shoulders pattern appears to be forming right now, which, if confirmed, would further strengthen the bullish case.
Using the Fib Time Tool again, the estimated timeline for reaching the target without any major pattern formation points to late July.
However, if the Head and Shoulders structure fully forms before the breakout, it could extend the move by an additional month, but would likely result in a much higher target beyond $10.
Invalidation level for this analysis: Below the $4 mark.
— Thanks for reading.

VRAUSDT correction is done time to flyVRAUSDT is presenting a clear completion of a WXY corrective structure into the defined Area of Interest, offering a potential re-accumulation opportunity. Price is currently reacting from the major demand zone with initial upside targets around 0.005284 and a secondary target aligning with the Supply Zone of Interest near 0.015081. The overall structure suggests a corrective phase conclusion with prospects of a new bullish impulse. Future validation will depend on sustained bullish momentum from the current demand area.

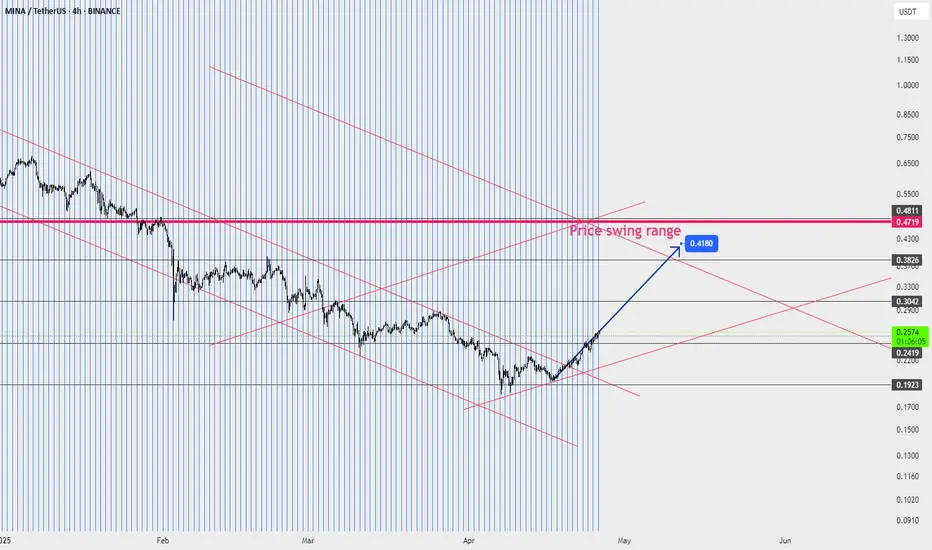
MINAIn my opinion, buying profits from any support level for spot trading can continue up to the price swing range I specified on the page, and of course, this is my opinion and the market maker is someone else.
ARTYFACT I Game-coin with huge upside potential. The bull run is officially back, and if history repeats, gaming coins are going to lead some of the biggest moves this cycle. While I typically stick to Bitcoin and proven setups, this is one of the rare altcoins I’m taking a calculated shot on: $ARTY.
From a technical perspective AMEX:ARTY looks to have formed a clean base. We’re seeing elevated volume while price remains suppressed at the lows, which often signals accumulation from stronger hands. If this breakout confirms, a 2 standard deviation expansion projects a potential target around $5.
This isn’t about hype—it’s about observing the early signs of a potentially scalable ecosystem. Artyfact is building out multiple components that could drive attention if the broader gaming narrative gains traction:
🎮 A gaming platform working toward AAA-quality experiences with integrated GameFi elements
🛍 An NFT marketplace with profit-sharing mechanics tied to in-game assets
🌐 A developing metaverse layer that supports events like esports tournaments and exhibitions
🪙 The AMEX:ARTY token has defined utility across payments, staking, governance, and ecosystem rewards
On-chain and tokenomics data also support this thesis:
• Market cap remains very low
• Over 80% of AMEX:ARTY supply is already in circulation
• Holder count is increasing
• Major rollouts are coming, including planned launches on PlayStation, Xbox, AppStore, and Google Play
I’ve personally taken a position here. This is not financial advice—crypto involves risk and this setup is high volatility by nature. But if momentum enters the gaming sector, this could be one of the coins that benefits disproportionately.
📈 Bullrun target: $5 based on standard deviation breakout model
Check the chart below for my technical breakdown, entry, and price targets.
"Adapt what is useful, reject what is useless, and add what is specifically your own."
— David Perk aka Dave FX Hunter ⚔️

ACCENTURE Stock Chart Fibonacci Analysis 042525Trading Idea
1) Find a FIBO slingshot
2) Check FIBO 61.80% level
3) Entry Point > 290/61.80%
Chart time frame: D
A) 15 min(1W-3M)
B) 1 hr(3M-6M)
C) 4 hr(6M-1year)
D) 1 day(1-3years)
Stock progress: A
A) Keep rising over 61.80% resistance
B) 61.80% resistance
C) 61.80% support
D) Hit the bottom
E) Hit the top
Stocks rise as they rise from support and fall from resistance. Our goal is to find a low support point and enter. It can be referred to as buying at the pullback point. The pullback point can be found with a Fibonacci extension of 61.80%. This is a step to find entry level. 1) Find a triangle (Fibonacci Speed Fan Line) that connects the high (resistance) and low (support) points of the stock in progress, where it is continuously expressed as a Slingshot, 2) and create a Fibonacci extension level for the first rising wave from the start point of slingshot pattern.
When the current price goes over 61.80% level , that can be a good entry point, especially if the SMA 100 and 200 curves are gathered together at 61.80%, it is a very good entry point.
As a great help, tradingview provides these Fibonacci speed fan lines and extension levels with ease. So if you use the Fibonacci fan line, the extension level, and the SMA 100/200 curve well, you can find an entry point for the stock market. At least you have to enter at this low point to avoid trading failure, and if you are skilled at entering this low point, with fibonacci6180 technique, your reading skill to chart will be greatly improved.
If you want to do day trading, please set the time frame to 5 minutes or 15 minutes, and you will see many of the low point of rising stocks.
If want to prefer long term range trading, you can set the time frame to 1 hr or 1 day.

SUIUSDT: Bullish Breakout from Rounding Bottom FormationSUIUSDT presents a rounding bottom formation, with price action successfully breaking and closing above the neckline resistance, confirming a strong bullish continuation signal. The immediate plan is to monitor the defined Buy Back Zone for potential re-accumulation opportunities should price retrace.
The neckline region, now converted into a key demand area, is expected to act as major support in case of any pullback. A full-scale buyback is anticipated upon any retest of this zone. Both the initial target based on the rounding bottom breakout and the final setup target have been clearly outlined.
We welcome your thoughts and feedback on this current technical outlook.

MERCK Stock Chart Fibonacci Analysis 042525Trading Idea
1) Find a FIBO slingshot
2) Check FIBO 61.80% level
3) Entry Point > 82/61.80%
Chart time frame: D
A) 15 min(1W-3M)
B) 1 hr(3M-6M)
C) 4 hr(6M-1year)
D) 1 day(1-3years)
Stock progress: A
A) Keep rising over 61.80% resistance
B) 61.80% resistance
C) 61.80% support
D) Hit the bottom
E) Hit the top
Stocks rise as they rise from support and fall from resistance. Our goal is to find a low support point and enter. It can be referred to as buying at the pullback point. The pullback point can be found with a Fibonacci extension of 61.80%. This is a step to find entry level. 1) Find a triangle (Fibonacci Speed Fan Line) that connects the high (resistance) and low (support) points of the stock in progress, where it is continuously expressed as a Slingshot, 2) and create a Fibonacci extension level for the first rising wave from the start point of slingshot pattern.
When the current price goes over 61.80% level , that can be a good entry point, especially if the SMA 100 and 200 curves are gathered together at 61.80%, it is a very good entry point.
As a great help, tradingview provides these Fibonacci speed fan lines and extension levels with ease. So if you use the Fibonacci fan line, the extension level, and the SMA 100/200 curve well, you can find an entry point for the stock market. At least you have to enter at this low point to avoid trading failure, and if you are skilled at entering this low point, with fibonacci6180 technique, your reading skill to chart will be greatly improved.
If you want to do day trading, please set the time frame to 5 minutes or 15 minutes, and you will see many of the low point of rising stocks.
If want to prefer long term range trading, you can set the time frame to 1 hr or 1 day.

MOELIS Stock Chart Fibonacci Analysis 042525Trading Idea
1) Find a FIBO slingshot
2) Check FIBO 61.80% level
3) Entry Point > 49/61.80%
Chart time frame: D
A) 15 min(1W-3M)
B) 1 hr(3M-6M)
C) 4 hr(6M-1year)
D) 1 day(1-3years)
Stock progress: A
A) Keep rising over 61.80% resistance
B) 61.80% resistance
C) 61.80% support
D) Hit the bottom
E) Hit the top
Stocks rise as they rise from support and fall from resistance. Our goal is to find a low support point and enter. It can be referred to as buying at the pullback point. The pullback point can be found with a Fibonacci extension of 61.80%. This is a step to find entry level. 1) Find a triangle (Fibonacci Speed Fan Line) that connects the high (resistance) and low (support) points of the stock in progress, where it is continuously expressed as a Slingshot, 2) and create a Fibonacci extension level for the first rising wave from the start point of slingshot pattern.
When the current price goes over 61.80% level , that can be a good entry point, especially if the SMA 100 and 200 curves are gathered together at 61.80%, it is a very good entry point.
As a great help, tradingview provides these Fibonacci speed fan lines and extension levels with ease. So if you use the Fibonacci fan line, the extension level, and the SMA 100/200 curve well, you can find an entry point for the stock market. At least you have to enter at this low point to avoid trading failure, and if you are skilled at entering this low point, with fibonacci6180 technique, your reading skill to chart will be greatly improved.
If you want to do day trading, please set the time frame to 5 minutes or 15 minutes, and you will see many of the low point of rising stocks.
If want to prefer long term range trading, you can set the time frame to 1 hr or 1 day.

LOCKHEED MARTIN Stock Chart Fibonacci Analysis 042525Trading Idea
1) Find a FIBO slingshot
2) Check FIBO 61.80% level
3) Entry Point > 464/61.80%
Chart time frame: D
A) 15 min(1W-3M)
B) 1 hr(3M-6M)
C) 4 hr(6M-1year)
D) 1 day(1-3years)
Stock progress: A
A) Keep rising over 61.80% resistance
B) 61.80% resistance
C) 61.80% support
D) Hit the bottom
E) Hit the top
Stocks rise as they rise from support and fall from resistance. Our goal is to find a low support point and enter. It can be referred to as buying at the pullback point. The pullback point can be found with a Fibonacci extension of 61.80%. This is a step to find entry level. 1) Find a triangle (Fibonacci Speed Fan Line) that connects the high (resistance) and low (support) points of the stock in progress, where it is continuously expressed as a Slingshot, 2) and create a Fibonacci extension level for the first rising wave from the start point of slingshot pattern.
When the current price goes over 61.80% level , that can be a good entry point, especially if the SMA 100 and 200 curves are gathered together at 61.80%, it is a very good entry point.
As a great help, tradingview provides these Fibonacci speed fan lines and extension levels with ease. So if you use the Fibonacci fan line, the extension level, and the SMA 100/200 curve well, you can find an entry point for the stock market. At least you have to enter at this low point to avoid trading failure, and if you are skilled at entering this low point, with fibonacci6180 technique, your reading skill to chart will be greatly improved.
If you want to do day trading, please set the time frame to 5 minutes or 15 minutes, and you will see many of the low point of rising stocks.
If want to prefer long term range trading, you can set the time frame to 1 hr or 1 day.

Trading idea - Entry point > 136/61.80%Trading Idea
1) Find a FIBO slingshot
2) Check FIBO 61.80% level
3) Entry Point > 136/61.80%
Chart time frame: D
A) 15 min(1W-3M)
B) 1 hr(3M-6M)
C) 4 hr(6M-1year)
D) 1 day(1-3years)
Stock progress: A
A) Keep rising over 61.80% resistance
B) 61.80% resistance
C) 61.80% support
D) Hit the bottom
E) Hit the top
Stocks rise as they rise from support and fall from resistance. Our goal is to find a low support point and enter. It can be referred to as buying at the pullback point. The pullback point can be found with a Fibonacci extension of 61.80%. This is a step to find entry level. 1) Find a triangle (Fibonacci Speed Fan Line) that connects the high (resistance) and low (support) points of the stock in progress, where it is continuously expressed as a Slingshot, 2) and create a Fibonacci extension level for the first rising wave from the start point of slingshot pattern.
When the current price goes over 61.80% level , that can be a good entry point, especially if the SMA 100 and 200 curves are gathered together at 61.80%, it is a very good entry point.
As a great help, tradingview provides these Fibonacci speed fan lines and extension levels with ease. So if you use the Fibonacci fan line, the extension level, and the SMA 100/200 curve well, you can find an entry point for the stock market. At least you have to enter at this low point to avoid trading failure, and if you are skilled at entering this low point, with fibonacci6180 technique, your reading skill to chart will be greatly improved.
If you want to do day trading, please set the time frame to 5 minutes or 15 minutes, and you will see many of the low point of rising stocks.
If want to prefer long term range trading, you can set the time frame to 1 hr or 1 day.

GLOBAL-E Stock Chart Fibonacci Analysis 042525Trading Idea
1) Find a FIBO slingshot
2) Check FIBO 61.80% level
3) Entry Point > 32/61.80%
Chart time frame: D
A) 15 min(1W-3M)
B) 1 hr(3M-6M)
C) 4 hr(6M-1year)
D) 1 day(1-3years)
Stock progress: A
A) Keep rising over 61.80% resistance
B) 61.80% resistance
C) 61.80% support
D) Hit the bottom
E) Hit the top
Stocks rise as they rise from support and fall from resistance. Our goal is to find a low support point and enter. It can be referred to as buying at the pullback point. The pullback point can be found with a Fibonacci extension of 61.80%. This is a step to find entry level. 1) Find a triangle (Fibonacci Speed Fan Line) that connects the high (resistance) and low (support) points of the stock in progress, where it is continuously expressed as a Slingshot, 2) and create a Fibonacci extension level for the first rising wave from the start point of slingshot pattern.
When the current price goes over 61.80% level , that can be a good entry point, especially if the SMA 100 and 200 curves are gathered together at 61.80%, it is a very good entry point.
As a great help, tradingview provides these Fibonacci speed fan lines and extension levels with ease. So if you use the Fibonacci fan line, the extension level, and the SMA 100/200 curve well, you can find an entry point for the stock market. At least you have to enter at this low point to avoid trading failure, and if you are skilled at entering this low point, with fibonacci6180 technique, your reading skill to chart will be greatly improved.
If you want to do day trading, please set the time frame to 5 minutes or 15 minutes, and you will see many of the low point of rising stocks.
If want to prefer long term range trading, you can set the time frame to 1 hr or 1 day.

ETC/USDT 4h chart Hello everyone, let's look at the 4h graph etc to USDT, in this situation we can see how the price came out of the top of the lasting downward trend. Going further, let's check the places of potential target for the price:
T1 = $ 17.44
T2 = $ 18.75
Т3 = 20.73 $
T4 = 22.48 $
Let's go to Stop-Loss now in case of further declines on the market:
SL1 = $ 16.25
SL2 = $ 15.05
SL3 = $ 13.74
SL4 = $ 12.66
Looking at the RSI indicator, we see
As we entered the upper part of the range again, which apparently affected the slow price of the price.

WARNER BROS Stock Chart Fibonacci Analysis 042525Trading Idea
1) Find a FIBO slingshot
2) Check FIBO 61.80% level
3) Entry Point > 8/61.80%
Chart time frame: D
A) 15 min(1W-3M)
B) 1 hr(3M-6M)
C) 4 hr(6M-1year)
D) 1 day(1-3years)
Stock progress: A
A) Keep rising over 61.80% resistance
B) 61.80% resistance
C) 61.80% support
D) Hit the bottom
E) Hit the top
Stocks rise as they rise from support and fall from resistance. Our goal is to find a low support point and enter. It can be referred to as buying at the pullback point. The pullback point can be found with a Fibonacci extension of 61.80%. This is a step to find entry level. 1) Find a triangle (Fibonacci Speed Fan Line) that connects the high (resistance) and low (support) points of the stock in progress, where it is continuously expressed as a Slingshot, 2) and create a Fibonacci extension level for the first rising wave from the start point of slingshot pattern.
When the current price goes over 61.80% level , that can be a good entry point, especially if the SMA 100 and 200 curves are gathered together at 61.80%, it is a very good entry point.
As a great help, tradingview provides these Fibonacci speed fan lines and extension levels with ease. So if you use the Fibonacci fan line, the extension level, and the SMA 100/200 curve well, you can find an entry point for the stock market. At least you have to enter at this low point to avoid trading failure, and if you are skilled at entering this low point, with fibonacci6180 technique, your reading skill to chart will be greatly improved.
If you want to do day trading, please set the time frame to 5 minutes or 15 minutes, and you will see many of the low point of rising stocks.
If want to prefer long term range trading, you can set the time frame to 1 hr or 1 day.

Trading idea - Entry point > 12.24/61.80%Trading Idea
1) Find a FIBO slingshot
2) Check FIBO 61.80% level
3) Entry Point > 12.24/61.80%
Chart time frame: D
A) 15 min(1W-3M)
B) 1 hr(3M-6M)
C) 4 hr(6M-1year)
D) 1 day(1-3years)
Stock progress: A
A) Keep rising over 61.80% resistance
B) 61.80% resistance
C) 61.80% support
D) Hit the bottom
E) Hit the top
Stocks rise as they rise from support and fall from resistance. Our goal is to find a low support point and enter. It can be referred to as buying at the pullback point. The pullback point can be found with a Fibonacci extension of 61.80%. This is a step to find entry level. 1) Find a triangle (Fibonacci Speed Fan Line) that connects the high (resistance) and low (support) points of the stock in progress, where it is continuously expressed as a Slingshot, 2) and create a Fibonacci extension level for the first rising wave from the start point of slingshot pattern.
When the current price goes over 61.80% level , that can be a good entry point, especially if the SMA 100 and 200 curves are gathered together at 61.80%, it is a very good entry point.
As a great help, tradingview provides these Fibonacci speed fan lines and extension levels with ease. So if you use the Fibonacci fan line, the extension level, and the SMA 100/200 curve well, you can find an entry point for the stock market. At least you have to enter at this low point to avoid trading failure, and if you are skilled at entering this low point, with fibonacci6180 technique, your reading skill to chart will be greatly improved.
If you want to do day trading, please set the time frame to 5 minutes or 15 minutes, and you will see many of the low point of rising stocks.
If want to prefer long term range trading, you can set the time frame to 1 hr or 1 day.


Elders Ltd Stock Quote | Chart & Forecast SummaryKey Indicators On Trade Set Up In General
1. Push Set Up
2. Range Set up
3. Break & Retest Set Up
Notes On Session
# Elders Ltd Stock Quote
- Double Formation
* (EMA Settings)) | Completed Survey
* Wave Feature Entry | Subdivision 1
- Triple Formation
* (Downtrend Argument)) + Continuation Area | Subdivision 2
* (TP1) | Subdivision 3
* Daily Time Frame | Trend Settings Condition
- (Hypothesis On Entry Bias)) | Indexed to 100
- Position On A 1.5RR
* Stop Loss At 78.00 AUD
* Entry At 74.00 AUD
* Take Profit At 68.00 AUD
* (Downtrend Argument)) & No Pattern Confirmation
* Ongoing Entry & (Neutral Area))
Active Sessions On Relevant Range & Elemented Probabilities;
European-Session(Upwards) - East Coast-Session(Downwards) - Asian-Session(Ranging)
Conclusion | Trade Plan Execution & Risk Management On Demand;
Overall Consensus | Sell

AMD: Potential Mid-Term Reversal from Macro SupportPrice has reached ideal macro support zone: 90-70 within proper proportion and structure for at least a first wave correction to be finished.
Weekly
As long as price is holding above this week lows, odds to me are moving towards continuation of the uptrend in coming weeks (and even years).
1h timeframe:
Thank you for attention and best of luck to your trading!

Chevron: The Chart’s Reaching a Critical PointChevron is starting to look very interesting again — but let’s be clear from the start: Chevron, like every oil giant, lives and dies by the price of oil. If oil rips higher or collapses due to global politics, supply shocks, or economic chaos, Chevron NYSE:CVX follows. No exceptions.
That said, what we’re seeing on the chart right now is increasingly pointing toward a deeper correction — specifically down to the $113–$100 zone. That would make sense structurally as a Wave 4 retracement.
But there’s a technical nuance here. Wave 1’s high sits at $103 — and depending on how strict your Elliott Wave rules are, Wave 4 dipping into Wave 1 is bad territory. Personally, I’m okay with a brief touch into that range, but I don’t want to see price hanging around below $103 for long.
From a trend perspective, we’re clearly in a downward channel. We just saw a textbook bull trap:
Chevron broke out with a solid +7% move over two weeks,
Followed immediately by a massive 22% drop,
One of the sharpest two-week declines since — yeah — March 2020, pandemic levels.
Now, price is hovering around $130, and the setup is simple:
If this level holds, great — maybe we’re bottoming.
If it breaks, I’m looking to buy between $113 and $100. That’s where the structure aligns, the volume kicks in, and risk/reward starts to make sense again.
So here’s the real question:
Do we see $200 first — or $100?
I’m leaning $100 first.
Not because I’m bearish long-term— but because that level would clean up the chart, shake out the noise, and give us a real shot at riding the next strong leg higher with conviction.
Would love to hear what you think — where’s your bet?
