NZD/JPY For Bullishwait for pull-back near by entry point and then go long
general trend is down trend
current phase is pull-back
have fun :)
Fibonacci

AAPL eyes on $208.xx: Key Resistance to Tariff Recovery wave AAPL trying to recover through the various tariff news.
Currently testing a key resistance zone at $208.26-208.68
Look for dips, with a must-hold support at $196.65-197.33
.
Previous analysis that called the TOP:
=====================================================

AUD/JPY For Bullish as pull-backwait for pull-back near by entry point and then go long
general trend is down trend
current phase is pull-back
have fun :)

GBPUSD → A false breakout can trigger a correction FX:GBPUSD is strengthening as part of the rally associated with the fall in the dollar index, but there is a technically strong resistance zone ahead that could trigger a correction...
The dollar index, due to US politics, desire for lower interest rates, tariff war, continues its decline, giving an advantage to the currency pairs of the main basket.
Against this background, the pound sterling is strengthening and is ready to test the key resistance at the moment: 1.343. The huge pool of liquidity, accumulated behind this area may not let the price up at the first time. The last test and confirmation of this level was half a year ago.
Resistance levels: 1.343
Support levels: 1.3292, 1.3207
A sharp approach to resistance, a false breakout without the possibility of growth continuation and consolidation below the resistance 1.3430 may provoke a correction in the imbalance zone or liquidity 1.3292.
Regards R. Linda!

ADSK eyes on $270: Proven Resistance zone may Reject or BreakADSK trying to recover along with the general market.
Currently testing a proven resistance at $269.63-270.12
Look for a Break-n-Retest or dip to support fibs below.

AMZN watch $186-189: Key Resistance zone for Recovery BounceAMZN struggling with China tariffs but trying to recover.
Now up into a key resistance zone at $186.75-188.98
Anticipating some consolidation below or within zone.
.
Previous analysis that called the TOP:
===================================================

ETH Rejection Incoming? Don’t Fall for This Bull TrapYello Paradisers, are you watching how ETH is reacting right now at this key zone? This could either turn into a textbook bearish setup… or catch everyone off guard. Let’s break it down 👇
💎ETHUSDT is currently hovering at a critical resistance area, perfectly aligned with both a key Fibonacci retracement zone and the 200 EMA—classic confluence. What makes it even more concerning is the bearish divergence, which is strengthening the probability of a downside rejection from this level.
💎To add fuel to the fire, the price action has just taken liquidity (inducement) above the previous highs, another bearish signal that supports the idea of a potential reversal from here.
💎However, this bearish bias will be fully invalidated if ETH manages to break and close a candle above the resistance zone. That kind of price action would suggest strength from buyers and a likely continuation to the upside.
💎In that case, it’s wiser to stay patient and wait for a cleaner setup at a better price. Rushing into a trade at this stage, especially in a moment of indecision, is not how pros operate.
If you want to be consistently profitable, you need to be extremely patient and always wait only for the best, highest probability trading opportunities.
MyCryptoParadise
iFeel the success🌴

CHF/JPY For Bullish as Pull-backyou can go long now
general trend is down trend
current phase is pull-back
your confirmation will be price break the red level and go up so it will be reach to target 1 , 2
have fun :)

EWTSU 6E1! H1 micro wave ((5)) down developping
EWTSU 6E1! H1
micro wave ((5)) of subminuette wave a down developping - target 1.1308
micro wave ((5)) should develope in five waves
invalidation: price break over 1.1490 area steadly

NZD/CAD For Bullishwait for pull-back near by entry point and then go long
general trend is up trend
have fun :)

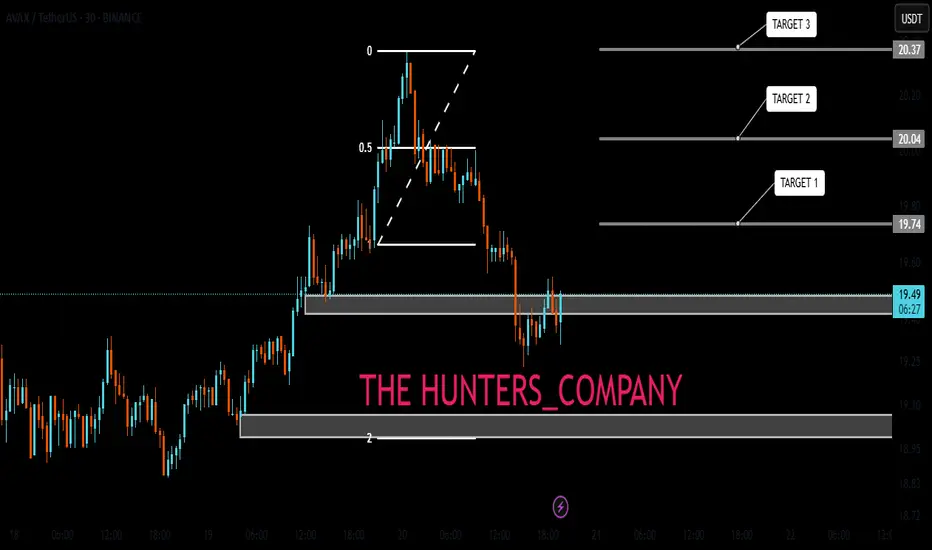
AVAX/USDT:BUYHello friends
Due to the price correction, we can buy in two designated areas in a stepwise manner. Elite with capital and risk management.
*Trade safely with us*
SUI/USDT:BUYHello friends
Due to the price correction, we can buy in two designated areas in a stepwise manner. Elite with capital and risk management.
*Trade safely with us*

SOL/USDT:BUYHello friends
Due to the price correction, we can buy in two specified areas in a stepwise manner, with capital and risk management.
*Trade safely with us*

AUD/CHF For Bullishwait for pull-back near by entry point and then go long
general trend is down trend
current phase is pull-back
have fun :)

XAU/USD For Bearish as pull-backyou can go short now
general trend is up trend
current phase is pull-back
Gold under Pressure
have fun :)

CMG watch $48,84 above 47.95 below: Key Range to determine trendCMG trying to recover with the general market.
Testing a Semi-Major Covid fib above at $48.94
If dip bulls MUST hold Golden Genesis at $47.95

TSLA watch $253.47 (again) Golden Genesis fib to determine trendTSLA back to the Golden Genesis fib that we keep harping about.
This is a BIG deal, as the most important level of this epoc for it.
Many PINGs (exact hits) have made all traders keenly aware of it.
What happens here will say a LOT to a LOT of traders and algos.
=========================================================
Full view of the "Genesis Sequence"
=========================================================

USDJPY Short Term Buy Trading PlanM15 - Strong bullish momentum followed by a pullback
No opposite signs
Expecting bullish continuation until the two Fibonacci support zones hold.
If you enjoy this idea, don’t forget to LIKE 👍, FOLLOW ✅, SHARE 🙌, and COMMENT ✍! Drop your thoughts and charts below to keep the discussion going. Your support helps keep this content free and reach more people! 🚀
--------------------------------------------------------------------------------------------------------------------
Disclosure: I am part of Trade Nation's Influencer program and receive a monthly fee for using their TradingView charts in my analysis.

Wave 5 Completed – Time to Ride the Correction!"Structure Overview
Wave Count: You’ve marked the end of wave (5), indicating a potential trend reversal or correction.
Bearish Setup:
Price rejected the orange supply zone post wave (5), suggesting bearish pressure.
Entry appears to be near the top of the small pullback into that zone.
Target is set near the larger demand zone around 1.12274.
Right-Side Box (Key Idea Summary):
Suggests a range-bound market, followed by:
A lower high into a new supply zone (brown box).
A sharp drop into a deeper demand zone at the base (green zone).
Key Price Levels:
Resistance/Supply: 1.14153, 1.15205
Support/Demand: 1.12274, lower box near 1.11400
Possible Strategy:
Sell setup: Look for confirmation candles or patterns near the orange/brown zones.
Target: Previous demand zone or lower if structure breaks.
SL: Above the orange/red zone to manage risk.

Nifty Analysis & Trade Plan for tomorrow, Thursday, 24th AprilNifty Analysis & Trade Plan for tomorrow, Thursday, 24th April

Bitcoin short from 102k regionPreparing for short at around that region.
102k-105k is a short region for me. I will most likely exit 50% from the markets.
I think summer will be just like any other summer season. Bleed and not much volatility . Q4 2025 and Q1 2026 will most likely be bullish.
Lets see what markets will offer this year.

$SAGA Long Trade #freesignal
LSE:SAGA Long
Leverage : 3-5x
Entry 1 : 1.415
Entry 2 : 1.32
TP: 1.6177
SL : 1.2288
I want you to use SL and do proper risk management thanks.
like and share with love

ADA 1-Year EMA Reclaim and Reversal (1D)After a double bottom at ~$0.50, BINANCE:ADAUSDT reclaimed the 1-year EMA (red) with a ~+9% large bodied daily candle, potentially shifting back to a bullish bias.
Key Levels to Watch
• $0.50-$0.58: Current support, a break below it would invalidate any bullish setup.
• $0.73-$0.77: Current resistance, 0.236 fib extension, HVN, and key S/R in place since February 2022. This is the most crucial level that the bulls need to reclaim.
• $1.10-$1.30: Main supply zone, with significant weekly and daily sell order blocks, plus 0.618 fib extension.
A daily close above above $0.77 would offer a good chance at retesting 2024's highs.
