BTC - Bullish Momentum To Continue!INDEX:BTCUSD has broken the lower highs and resistance trend line on the daily chart after forming bullish divergence on RSI.
RSI divergence signals reversals and in BTC's case, it has led to the break of lower highs (bullish reversal) and continuation of the overall bullish trend on higher timeframes.
I am expecting BTC to create a higher low around the support zone and continue its upward momentum!
Fibonacci

GBP/AUD For Bullish as pull-backyou can go long now
or
wait for entry point and then go long
general trend is down trend
current phase is pull-back and may be end at target 3
have fun :)

NZD/JPY For Bearish as pull-backyou can go short now
or
wait for entry point and then go short
general trend is up trend
current phase is pull-back may be end at target 3
have fun :)

XRP. Kaput?*chart inverted*
Watching this trendline currently. XRP recently had a strong bounce off the 382 and we could see a further retracement to the 0.5 at roughly $2.80
Breaks of the trendline could trigger moves down 📉

AUD/JPY For Bearish as Pull-backyou can go short now
or
wait for entry point and then go short
general trend is up trend
current phase is pull-back may be end at target 3
have fun :)

MSTR heads up at $357: Double Fib that may be Strong Resistance MSTR getting a nice boost from the Bitcoin surges.
Nearing a Double Fib that may be strong resistance.
Look for clean Rejection or Break-n-Retest for entry.

TOST eyes on $36.26: Proven Resistance fib that might give Dip TOST is struggling against a minor Genesis fib at $36.26.
If we get a dip then look for Golden Genesis at $33.40
Break out should pop quickly to the next fib at $38.03
=================================================

Possible Bull trap Incoming (+Long term Position Strategy)Gold not about to sustain the current levels where it is at, Buy area for Gold: levels of 3016-3084 and then look for highs or ride the wave.
A good trader is to be patient, trade responsibly. Enjoy

ORCL watch $151-152: Major Resistance should give a Dip BuyORCL trying to recover with the rest of big tech.
Just hit a major resistance zone at $151.29-152.48
If it dips to fibs below, good support $141.24-141.72

ADSK watch $281-285: Major Resistance zone may give a Dip BuyADSK recovering nicely from the tariff turmoil.
But it has just hit a MAOR resistance zone of two fibs.
Golden Genesis at $285.49 and a Covid fib at $281.53
It is PROBABLE that we get a dip here
It is POSSIBLE to break and retest to GO
If is PLAUSIBLE for a local top for a while.
===============================================

XAUUSD WEEKLY ANALYSIS Hey everyone happy new week…I’m sharing with you my projections this week kinda neutral but if we get a clean breakout of that zone and pullback with a confirmation I will be executing for buys to the last ATH…Let’s see how it goes and if am executing I will also update you guys see ya..

GBPUSD Week 19 Swing Zone/LevelsHope y'all had a good weekend with your profits.
This week we go into a slight variation of our winning strategy and ask the question:
what if Retracement is not fixed at the Fib levels but dynamic?
And so whilst keeping the zone and primary values of 279/721, we mark 2 levels and the predicted price reaction around them.
As Always price action determines trades

Either you are in or not, it's a Bullish rush on Gold.lets go!Made this analysis last night but forgot to post it here..... So you can join the train of bullish gold market. This week is high on bullish, so we will be looking to analyse and enter on a smaller time frames to look for only bullish confluences.
As you can see it's coming from a strong demand zone from a daily timeframe , at around 3200 per ounce, heading towards liquidity at 3375, if it grabs that liquidity, and still breaks over 3375. We will be sure to add more buys, at around 335. Supplying towards the next demand zone 3470. .
The weekly timeframe: so we could see a clearer view of what and where the market is heading to and coming from and remember also our monthly is bullish for the past months.

NQ Power Range Report with FIB Ext - 5/6/2025 SessionCME_MINI:NQM2025
- PR High: 20201.75
- PR Low: 20108.25
- NZ Spread: 209.0
Key scheduled economic events:
09:45 | S&P Global Services
10:00 | ISM Non-Manufacturing PMI
- ISM Non-Manufacturing Prices
Holding previous week's highs
- Advertising ability to break 20400 into Mach 26 daily pivot
Session Open Stats (As of 12:55 AM 5/6)
- Session Open ATR: 634.22
- Volume: 43K
- Open Int: 258K
- Trend Grade: Bear
- From BA ATH: -11.4% (Rounded)
Key Levels (Rounded - Think of these as ranges)
- Long: 20954
- Mid: 19246
- Short: 16963
Keep in mind this is not speculation or a prediction. Only a report of the Power Range with Fib extensions for target hunting. Do your DD! You determine your risk tolerance. You are fully capable of making your own decisions.
BA: Back Adjusted
BuZ/BeZ: Bull Zone / Bear Zone
NZ: Neutral Zone

S&P ES Long setup target 5963.50 / Calls SPY target 596Fibonacci technical analysis : S&P 500 E-mini Futures CME_MINI:ES1! has already found support at the Fib level 78.6% (5623.50) of my Down Fib. Last Daily candle (May 2) has closed above retracement Fib level 78.6%. My Down Fib guides me to look for CME_MINI:ES1! to eventually go up to hit first target at Fib level 127.2% (5963.50).
CME_MINI:ES1! – Target 1 at 127.2% (5963.50), Target 2 at 161.8% (6205.50) and Target 3 at 178.6 (6322.75)
Stop loss slightly below the 61.8% retracement Fib level (5506.25).
Option Traders : My AMEX:SPY chart Down Fib shows price to go up to Target 1 at 127.2% (595.82), Target 2 at 161.8% (620.50) and Target 3 at 178.6 (632.50)
Stop loss slightly below the 61.8% retracement Fib level (549).
Enjoy the trading process and take time to smell the roses🌹

btc fibonacci levels btc levels are holding we need to hold 94178 level or we are going to break down to 93710 looking to see if we break 94937 but looking like resistance

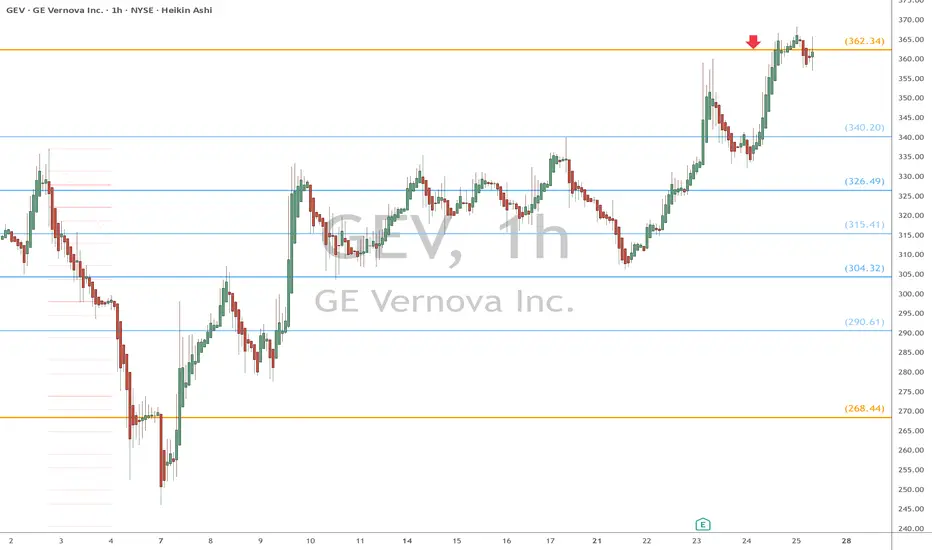
GEV eyes on $362.34: Golden Genesis Fib that may End BounceGEV trying to recover with the general market.
Currently testing a Golden Genesis Fib at $362.34
Looking for a Dip here, or Break-and-Retest entry.
BUD eyes on $65.86: Key Support for Tariff Recovery waveBUD probably immune to Tariffs but not market sentiment.
It has recovered well but bulls must hold support at $65.86.
Strong bounce should easily run to Golden Genesis at $69.15.

APP watch $310-313: Key Resistance before next Target at $350APP recovering well but watch key resistance at $310.50-313.14
If we get a dip then we look to support below at $289.58-291.00
Break and run has some blue skies above it until the $350 area.

Z eyes on $68.80-69.75: Resistance even the Fib-Blind can SEEZillow has bounced into a major landmark of its lifetime.
Zone is defined by a Golden Covid and a Minor Genesis fib.
This has been tested from both sides many times already.
$ 68.60-69.75 is the exact resistance to watch.
$ 61.82-62.50 is the first support below to hold.
$ 76.18-7./00 is a good first Target for longs.
===================================================
.

TRV eyes on $265.51: Golden Fib break should run to new ATHTRV has been struggling with a Golden Covid fib at $265.51.
This is a MAJOR landmark. proven by the many rejections.
This break may be the ONE, the one to hit All Time Highs.

CSCO eyes on $59.22: Key resistance to Tariff Recovery waveThis "internet oldie" usually lags the newcomers.
The key will be to break the Covid fib at $59.22
If we get a dip then look to the sister fib at $57.81

GOLD (XAU/USD) - Long Opportunity from FVG Zone🔹 GOLD (XAU/USD) - Long Opportunity from FVG Zone
Price has filled a Fair Value Gap (FVG UP) and tapped into a clear demand area. Strong reaction confirms bullish intent. I'm watching for a possible retest around 3,232–3,227 before a continuation to the upside.
📍 Entry Zone: 3,232 – 3,227
🛑 Stop Loss: Below 3,223
🎯 Target (TP): 3,263
📐 RR: Approx. 1:3
Key Points:
Price broke structure to the upside.
Liquidity sweep below intra-day lows.
Bullish FVG acted as support.
Clean upside inefficiency above.
🔔 If price gives a bullish confirmation on the retest, I’m looking to go long toward 3,263.
