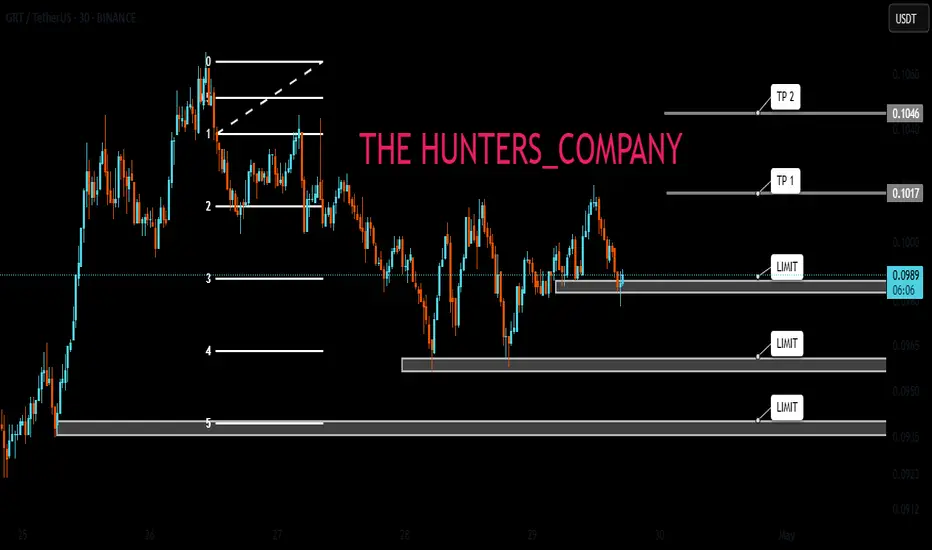
BNB/USDT 1D chart Hello everyone, let's look at the 1D BNB chart to USDT, in this situation we can see how the price moves in a triangle where there is still space to keep the currently ongoing side trend. Going further, let's check the places of potential target for the price:
T1 = $ 599
T2 = $ 617
Т3 = $ 644
Let's go to Stop-Loss now in case of further declines on the market:
SL1 = $ 580
SL2 = $ 559
SL3 = $ 542
SL4 = 521 $
Looking at the MacD indicator, you can see an attempt to return to the upward trend, but here we do not have clear confirmation, which is why it is worth being careful.
Fibonacci

Is it time to buy?Hello friends✌
Given the good price growth and the arrival of buyers, now that the price is correcting, it is the best time to buy.
🙏If you like it, support it with a ✔like✔ and ✔comment✔.
*Trade safely with us*
Kava potential Reversal and Target ProjectionKAVA is forming a potential bullish reversal after completing Wave 5 within a descending channel, reaching the External Demand Zone. A rally from current levels is anticipated, with initial support at the Immediate Resistance Level.
The setup targets a short-term move to 1.10, then mid-term at 2.25, with a final breakout aimed at 4.97. The pattern suggests strong upside potential, contingent on holding support and breaking through key resistance zones. A confirmed upward break above immediate resistance will validate the bullish projection toward the final target.

POPCATUSDT MidTerm Price StructurePOPCATUSDT experienced a decisive breakdown from a well-defined rising wedge pattern, a classic bearish reversal structure, leading to an aggressive 50% decline in price action. This drawdown culminated in a test of a key demand zone, characterized by prior accumulation and strong historical buying interest. Since the retest of this demand zone, price has exhibited signs of stabilization and consolidation above the support threshold.
Should this demand zone continue to hold, a bullish corrective phase may unfold, potentially driving price back toward the previous all-time high (ATH). However, the region surrounding the ATH represents a high-probability supply zone, where institutional distribution and profit-taking are likely to re-emerge, leading to a renewed sell-off.
The strategic approach involves initiating accumulation within or near the immediate demand zone while maintaining vigilance around the aforementioned major supply zone. The final projected upside target, derived from prior price structure and Fibonacci-based confluence, is annotated on the accompanying chart for reference.

CAKEUSDT Potential DownsidesHey Traders, in today's trading session we are monitoring CAKEUSDT for a selling opportunity around 2.17 zone, CAKEUSDT is trading in a downtrend and currently is in a correction phase in which it is approaching the trend at 2.17 support and resistance area.
Trade safe, Joe.


SUI - Leveraging Fibonacci & Elliott for Precision TradesSUI’s movement is rapid, sharp swings—both up and down. In volatile conditions like this, we aim 0.702–0.786 fib retracements (and occasionally 0.886 in harmonic contexts) for high‑probability entries. Below is a clear, Elliott-focused breakdown of the current setup and both long and short trade plans.
Before diving into the charts, let’s cover the basics of Elliott Wave Theory. Elliott Wave Theory provides a roadmap for market psychology by dividing price action into two distinct phases:
1. Impulse Phase (Waves 1–5)
Wave 1: The spark that ignites a new trend as early adopters push prices beyond the prior range.
Wave 2: A corrective pullback that tests the strength of the emerging trend, often retracing 38–61.8%.
Wave 3: The powerhouse wave—typically the longest and most dynamic—driven by broad market participation and often extending to key Fibonacci levels (1.618, 2.618).
Wave 4: A consolidating correction that digests gains and builds the base for the final thrust; it must not overlap Wave 1 territory in a classic impulse.
Wave 5: The final leg of the advance, often fueled by last bursts of optimism and weaker hands.
2. Corrective Phase (Waves A–B–C)
Wave A: Initial counter-trend reaction as profit-taking begins.
Wave B: A deceptive retracement back toward the trend, frequently trapping traders.
Wave C: The concluding leg of the correction, which typically tests or breaks the low of Wave A before the next cycle begins.
Key Points:
Impulse waves showcase momentum and structural clarity, often aligning with Fibonacci extensions.
Corrective waves follow Fibonacci retracements (38.2%, 50%, 61.8%), offering optimal entry points.
Wave 3 is seldom the shortest; Wave 4’s complexity sets the stage for Wave 5’s final push.
In the current SUI structure:
Wave 1 ignited the initial rally.
Wave 2 delivered a healthy retracement, a pullback close to the 0.618 fib, setting the stage for stronger momentum.
Wave 3 roared to a powerful peak topped at the 2.618 extension ($3.875)
Now, we’re deep into Wave 4, likely an ABC corrective pattern. This pause is critical—it gathers energy before the final push of Wave 5. Below is a clear breakdown of each wave, big-picture confluences, and trade setups.
🚀 Elliott Wave Overview
1. Wave 1 & Wave 2
Wave 1: Quick surge from $2.4175 → $2.75, setting initial momentum.
Wave 2: Pulled back close to the 0.618 fib, creating a solid launchpad.
2. Wave 3: The Power Move
Peak: Hit the 2.618 extension of Wave 1→2 and aligned with the –2 extension of Wave 1.
Significance: In strong bull markets, a run to the 2.618 extension often precedes a meaningful pullback. Here, Wave 3’s exhaustion suggests a retrace toward the 38.2% Fib of that advance—our ideal Wave 4 entry zone.
3. Wave 4: The Correction
All eyes on the $3.17 level—the projected 1:1 extension of A→B and 0.382 fib retracement of Wave 3. This confluence zone is yet to be tested and could offer an ideal Wave 4 entry.
ABC Pattern: Currently working on Wave C.
4. Wave 5: The Finale
Target Zone: $4.00–$4.35, with strong focus at $4.31
Extension Levels:
1.133 → $3.9695 aligns with the 0.618 fib retracement.
1.272 → $4.0683 is close to the weekly resistance level.
1.412 → $4.1678 alings with the 0.666 fib retracement.
1.618 → $4.3142 alings with the key swing high.
🔑 Key Confluence Levels
Golden Pocket: $3.9739–$4.1492 (90-day retrace).
Speed Fan 0.618: Support around $3.15.
Fair Value Gap:
Psychological: $3.00 major support.
📈 Long Trade Setup
Entry Ladder: $3.25–$3.111 (stack orders to DCA)
Stop‑Loss: $3.07 (just below the 0.786 Fib low)
Profit Targets:
Fib 1.133 at $3.9795 ($4 psychological & partial take‑profit)
Fib 1.272 at $4.0683
Fib 1.412 at $4.1678
Fib 1.618 at $4.3142
Risk:Reward: ~6:1+ (average entry around $3.20 → SL at $3.07 → TP1 at $3.9795)
📉 Short Trade Setup
Entry Zone: $4.00–$4.35 (sweet spot at weekly level/yearly open)
Confirmation: Bearish reversal candle or volume spike down
Stop‑Loss: Above $4.35
Target: $3.77 (near Wave 3 high turned support)
Risk:Reward: ~2:1 (varies with DCA entry)
⚙️ Summary & Game Plan
Primary Bias: Long in the $3.25–$3.111 zone—stack into the 0.382-0.412 fib retracement entries with tight SL, aiming for the $4.00–$4.30 upside zone.
Alternate Bias: Short on a clear rejection within $4.00–$4.35, targeting $3.77 or lower.
Risk Management: Keep stops tight to maximize R:R.
Patience & Confirmation: Wait for price to reach these zones and show reversal signals (price action, volume, patterns) before committing.
All set—now let SUI’s swings unveil the opportunities. Sit tight, follow your plan, and let patience pay its dividend.
Happy Trading!
____________________________________
If you found this helpful, leave a like and comment below! Got requests for the next technical analysis? Let me know.

Gold weekly outlookUsing Fibs and regression trend channel, we should see a continuation to the downside with a possible buy in the fibs buy zone potentially rising towards the sell zone.

Bitcoin dominance and the altseasonIn this chart, you can see the Bitcoin dominance from 2017 till now.
The depth of the altseason was 35.14% and for the bear market we went up, up to 73.02.
If we take a Fibonacci retrace level, we can see during 2021 altseason we were only retraced 0.893 or 89.3% what we lost during bear market.
It was something new and for the first time, Bitcoin Dominance didn't make the new all time low.
Following the same fact, I decided to find the possible levels for bitcoin dominance to top. we are getting closing the the 0.786, this level usually the last level that we could be bearish in any chart, however remember that last altseason we passed 0.786 but rejected at 0.893.
My opinion would be we are reaching to the top of Bitcoin dominance sooner than later, I can easily see Alts are reversing from bearish in short term and BTC Dominace Maxing in stoch RSI.
When you stay longer than usual in max excitation in stoch RSI you will be doing longer in opposite direction as well
Max BTC dominance can reach 66.2%
However, worse case scenario I am expecting at least BTC Dominace during altseason drop to 49.14% which is a historical support and also resistance during BTC season and Alt Season.
Ideally, we should go down up to 45.30% as it would be the 0.786 of the range from 39.9% to 66.2%
However, if we are able to make a new All time low in BTC dominance first idea place to see rejection or reaction would be 32.38%

SP500 ETF: Fibonacci MappingAs you may know, Williams Fractals indicator identifies potential reversal points by marking a high (or low) surrounded by two lower highs (or higher lows) on each side, forming a five-bar pattern that signals possible turning points in price. Unfortunately, the simplicity of such indicator provides just tiny perspective, undermining broad implication of the concept.
Before I begin diving into processing geometric narrative of emerging price via fibonacci channels, I want to explain how I interpret fractals.
When I use the term "fractal", I'm not just talking about the points alone. Market continuously corrects itself, so analyzing it by price alone can bring more confusion than help. The object of observation shouldn't be limited to quantifying just by a single property. Chaos by default requires awareness from both price and time aspects. The easiest way to root it in my vision was through realization that price is a function of trading time intervals. Its activity can be described as cyclical progression, as if it is wired by multiple "springs" of different tensions.
Classic TA patterns known to literally anyone are great for anticipating a move in surface level forecasts. Since my line of work focuses on prediction over forecasts, it requires deeper structural awareness behind complex oscillations.
Let's observe the way selloff scales from ATH and how it impacts fractal hierarchy.
The first corrective bullish wave can be explained as a reaction to initial impulsive bearish wave. The bigger scale drop from ATH to a lower point explains why the corrective bullish wave looks the way it is. And so on:
In fractals, scaling laws describe how key properties change with size, typically following power-law relationships that reflect the structure’s self-similarity, where a characteristic scales with the size raised to an exponent.
To build a probabilistic model, we must keep in mind how the smaller bits make up bigger scale picture. ATH, established bottom and angle of progression defined by pullback highs, all those points have structural weight. Since psychology of masses that shapes price dynamics is governed by mathematical sequences found in nature, it's fair to use Fibonacci Channels to map the geometry of interconnectedness.
Similarly, all of those points can be referred by another fibonacci channel with opposite direction.
From my perspective, traditional TA patterns reflect just phases of cycle, this is why I unify those fragments into broader scalable shapes. This distinctive branch of Fractal Analysis allows to track systematic aspects of market behavior and explains how a pattern replicates itself in rhythmic continuity.

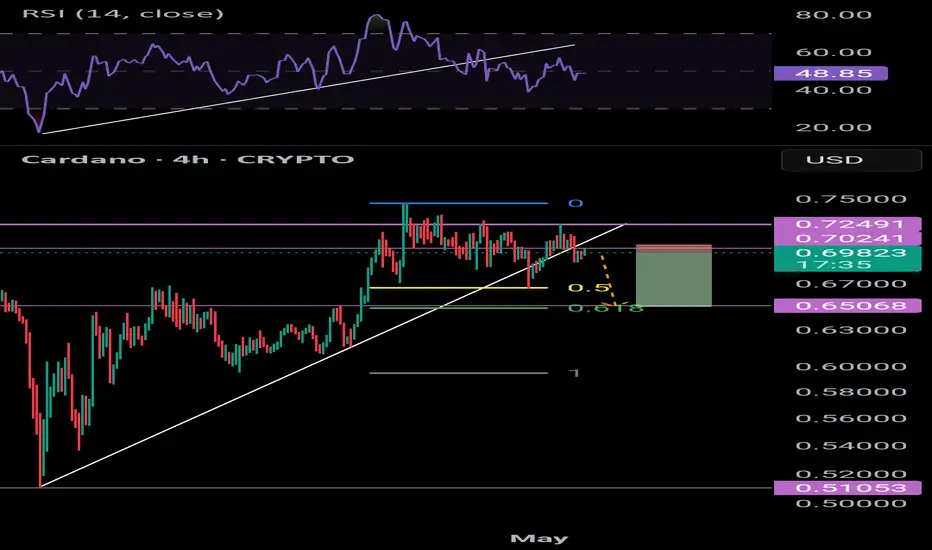
ADA uptrend brokenThe uptrend has broken for Cardano - fibonnaci retracement suggests next price level down will be @ 618 / $0.65
Move down = 6.5%
Shorting this you could set a TP @ $0.655
BTC Elliot Waves I'm looking for at least one more high, but wave III could already reach that level.

AUDUSD LOOKING FOR A PULLBACK TO 0.62700 AND PUMP TO 0.685AUDUSD looking for a retarcement to the goldbach FVG zone at 0.62700 and then a impulse to the higher order block to complete the return to origin

USDSGD LONG TO 1.36750 WITH GOLDBACH AND FIB BACKING USDSGD with a clean fib structure and looking to target 0.90 retrace in line with a Goldbach retrace to the higher order block zone

Bitcoin long: Expects Wave 5 Extension, Target $112,608I provide an update to the Bitcoin Elliott Wave primary wave counts. Here's a few things to note:
1. Primary Wave 3 = Primary Wave 1. Wave 3 is actually slightly longer than wave 1 but for the purpose of ascertaining whether it extends, we take the position that it did not.
2. Expects Primary Wave 5 extension of at least 1.618x of Primary Wave 1, giving us a target of $112,608.
3. Stop below Primary Wave 4, around $92,750.

MKR/USDT 4h chart ReviewHello everyone, let's look at the 4H MKR chart to USDT, in this situation we can see how the price moves on the created upward trend line. Going further, let's check the places of potential target for the price:
T1 = $ 1576
T2 = 1657 $
Т3 = 1714 $
Let's go to Stop-Loss now in case of further declines on the market:
SL1 = $ 1529
SL2 = $ 1499
SL3 = $ 1450
SL4 = 1372 $
Looking at the RSI indicator, we see
How slight relaxations give space for further increases by living in the upward trend of price.

btc fibonacci levels btc did not hold 97218 level and have fallen down to 9661 level and needs to hold this level as my next level is back down to 96000 look for a bounce if holds or we will continue to down trend

Dow Jones Wave Analysis – 2 May 2025- Dow Jones broke resistance zone
- Likely to rise to resistance level 42000.00
Dow Jones index recently broke the resistance zone between the pivotal resistance level 40815.00 (former support from March and the top of wave A from the start of April) and the 61.8% Fibonacci correction of the downward impulse 5 from March.
The breakout of this resistance zone continues the C-wave of the active ABC correction (2) from the start of April.
Dow Jones index can be expected to rise to the next resistance level 42000.00 (target price for the completion of the active impulse wave C).

Bullish on bigger time frames.
Bullish on bigger time frames.
Took support from a very important
level around 36-37.
HL printed.
40.30 - 40.85 is a Resistance level as
of now.
If it gets rejected from this level, we may
witness 37.50 - 38.50 again.
Upside targets can be around 45 - 46 & then
50s.

GOLD → Correction before NFP. What are the chances of a decline?FX:XAUUSD strengthens amid dollar correction. The market is correcting ahead of NonFarm Payrolls, trying to accumulate potential before high volatility.
Gold recovers ahead of US employment report
On Friday, gold rebounded from a two-week low, recouping some of its losses ahead of the release of US labor market data (NFP), which could set the tone for prices going forward. Amid optimism over trade talks and a strong dollar, gold ended its worst week in two months, but geopolitical tensions and a potentially weak jobs report could boost demand for safe-haven assets again.
The correction in the dollar gives gold a small chance to strengthen. However, fundamentally, the overall trend has already set the tone and gold may continue to fall.
Resistance levels: 3268, 3285, 3295
Support levels: 3227, 3204
The correction may reach a local zone of interest (money pool) — liquidity above 3270, or the 0.7 Fibonacci zone, after which the price may continue its course along the new trend — down to 3193.
However, unpredictable and unexpected data could disrupt the structure and push the price up to 3320-3350.
Best regards, R. Linda!

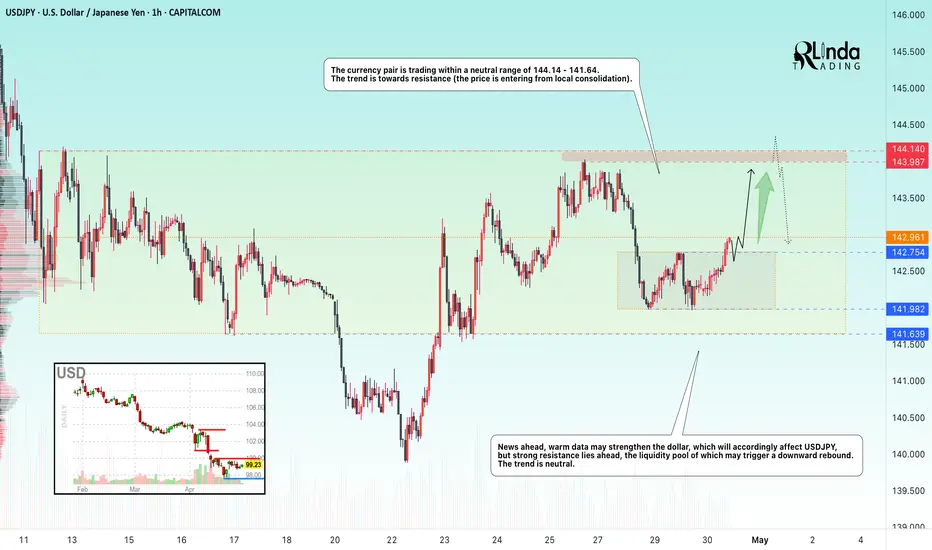
USDJPY → Price in range, retest of resistanceFX:USDJPY is emerging from local consolidation in hopes of seeing economic data that could support the dollar. The target for this movement could be the liquidity zone at 144.00.
The currency pair is trading within a neutral range of 144.14 - 141.64. However, a local consolidation has formed within the range, from which the price has broken out. The main task for the bulls is to hold the defense above 142.75, in which case we will be able to catch the price distribution to the upper border of the global range of 144.14.
News ahead, positive data may strengthen the dollar, which will accordingly affect USDJPY, but there is strong resistance at 144.14, whose liquidity pool may trigger a downward rebound. The trend is neutral.
Resistance levels: 143.9, 144.14
Support levels: 142.75, 141.98
There are no reasons to exit the global range. Over the past two weeks, this will be the first retest of the 144.14 zone, which in general only increases the chances of a false breakout and correction.
Best regards, R. Linda!
SOL Analysis Deep Dive: Identifying Optimal Entry and Exit ZonesYesterday, SOL gave a sharp downside shakeout, dropping from the weekly open at $147.98 (perfectly retested) down to the 0.5 Fib retracement of the swing at $140.25. Here’s a structured breakdown of the key levels, trade setups, and R:R profiles for both longs and shorts:
🔑 Key Levels & Confluences
1. Higher-Timeframe Opens
Weekly Open & Retest: $147.98 – pivoted price before the drop
Monthly & Prior-Day Open Cluster: $147.98–$146.31 – strong support confluence zone
2. Fibonacci Support Zones
0.5 Fib at $140.25 – primary mean-reversion entry
0.786 Fib (smaller wave) at $138.78 – secondary, deeper support
3. Order Block
Daily Bullish Order Block at $139.87 – just below 0.5 Fib, adds extra support
4. Volume-Weighted Average Price
Anchored VWAP (from ATH $295.83) at ~$166.45 – key upside resistance
5. Market Profile Value Areas (10-Day Range)
Value Area High (VAH) at ~$153.00 – overhead resistance confluence
Value Area Low (VAL) at ~$145.75 – underpins support
📈 Long Trade Setups
1. 0.5/0.786 Fib + Daily Bullish Order Block
Entry: $141-138.78
Stop-Loss: $137.5
Target: $165 (anchored VWAP / Fib zones)
R:R ≈ 9:1
2. Higher-Timeframe Open Cluster
Entry Zone: $147.98–$146.31(monthly/weekly open)
Stop-Loss: $142.5
Target: $165
R:R ≈ 3:1
• Why these levels? The 0.5 Fib is a classic mean-reversion zone, bolstered by the daily order block. The $147–146 zone ties together multiple opens (weekly, monthly, prior-day), offering a solid demand area if price retraces back up.
📉 Short Trade Setup
Trigger: Rejection / swing-failure around $153.4
Entry: $153.4
Stop-Loss: $154.3
Target: Weekly/Monthly open (~$147)
R:R ≈ 6:1
• Low-risk short: A clean rejection at the recent high lets you define risk tightly above the swing, aiming to capture the retrace back to the opens.
🎯 Summary & Game Plan
Primary bias: Look for long entries at the 0.5 Fib ($140.25) or the open-cluster zone ($147–146), with targets toward the anchored VWAP at ~$166.
Alternate bias: A short on clear rejection from $153.4, targeting the opens as support.
Risk management: Keep stops tight (SL below $137.5 or above $154.3) to maximize R:R on your favored setups.
Volume & Price Action: Confirm entries with an uptick in volume or bullish price structure (for longs) or swift failure patterns (for shorts).
Now it’s a waiting game! Let price revisit these zones, watch for confirmation signals, and then scale into your chosen side. Good luck! Don't chase, let the charts come to you!
____________________________________
If you found this helpful, leave a like and comment below! Got requests for the next technical analysis? Let me know.

GBPAUD Wave Analysis – 2 May 2025- GBPAUD broke support zone
- Likely to fall to support level 2.0475
GBPAUD currency pair recently broke the support zone between the pivotal support level 2.0685 (which stopped the previous waves i, iii, v) and the 50% Fibonacci correction of the upward impulse from January.
The breakout of this support zone continues the c-wave of the active ABC correction 4 from the start of April.
GBPAUD can be expected to fall to the next support level 2.0475 (target price for the completion of the active correction 4).
