btc levels my last post was off because i was trying something new pit int wrong info but got new levels btc holding 97218 if can hold this and 97037 we are going to break 97483 97825 get new resistance at 98553 lock in profits
Fibonacci

Ripple potential UpsidesHey Traders, in today's trading session we are monitoring XRPUSDT for a buying opportunity around 2.13 zone, XRPUSDT is trading in an uptrend and currently is in a correction phase in which it is approaching the trend at 2.13 support and resistance area.
Trade safe, Joe.


NEE watch $67.21-67.34: Key Resistance zone to Recovery WaveNEE struggling against a well proven resistance zone.
$67.21-67.34 is the immediate resistance of note.
$68.78-68.40 is next resistance and scalp target.

Bearish forecast for DXYWith regards my previous forecast, we have a strong reaction from Weekly and daily premium arrays.
On the weekly TF, we have IOFED of the SIBI and BSL above previous 2 weeks' highs was taken.
Tf: time frame
IOFED: Institutional Order Flow Express Entry Drill
SIBI: Sellside Imbalance, Buyside Inefficiency.
BSL: Buy side liquidity

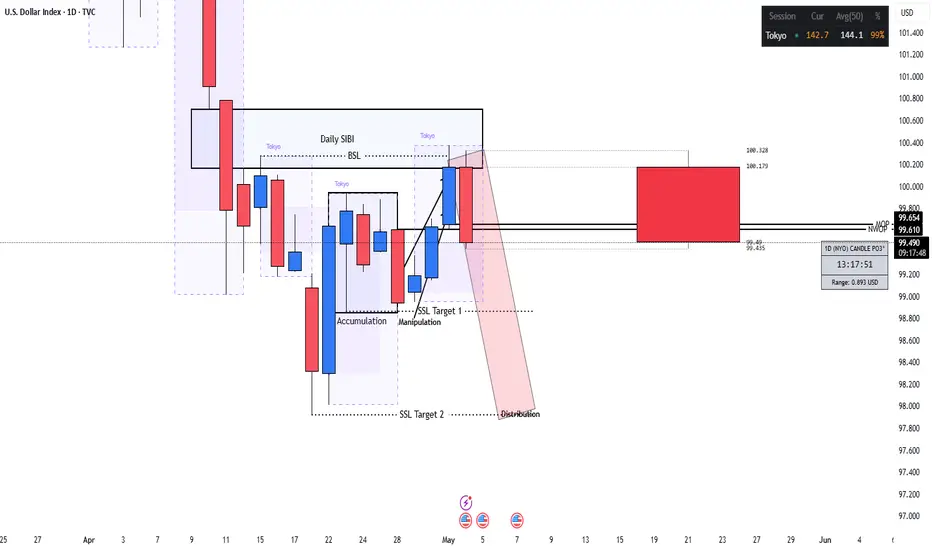
DXY Bearish Forecast for Quarter 2, 20251. Technical analysis
The idea is based in ICT's PO3; AMD pattern.
We have a rally above the open price of May 2025, to take out BSL above the highs.
It also aligns with Daily tf premium arrays to short from.
The lowest hanging fruit being the relative equal lows at equilibrium of the dealing range.
2. Fundamental analysis
Investor's confidence in the Dollar is low due to POTUS' tariffs.
ICT: Inner Circle Trader
PO3: Power of 3
AMD: Accumulation, Manipulation & Distribution
BSL: Buy side liquidity
tf: Timeframe

PLANETUSDT Breakdown After Wedge, Base Forming for Relief RallyFollowing its initial post-listing rally, PLANETUSDT concluded its impulsive ascent within a bearish rising wedge formation, a classical exhaustion pattern. The subsequent breakdown triggered a steep decline, extending well around the 200% Fibonacci extension level, reflecting a structurally violent markdown phase. This collapse established a new low before price found equilibrium within a clearly defined immediate demand zone.
Current price action suggests a potential bottoming structure, with the asset attempting to base and consolidate within this demand region. Should buyers maintain control and price manage a sustained breakout above the descending channel resistance, a corrective leg to the upside becomes increasingly likely.
The short- to mid-term recovery target is situated near the 0.0000090901 level, which coincides with the broader critical supply zone—a region marked by previous heavy distribution. This area is expected to attract significant selling pressure, presenting a likely inflection point for a renewed bearish phase or potential macro rejection.

[ TimeLine ] Gold 5-6 May 2025📅 Today is Friday, May 2, 2025
📌 Upcoming Signal Dates:
May 5, 2025 (Monday) or
May 5 & 6, 2025 (Monday & Tuesday)
🧠 Trading Plan & Notes:
✅ Gold has undergone a significant reversal of over 2000 pips, from its ATH of 3500 down to 3200
⚠️ If the upcoming Hi-Lo range is wide, consider reversal entries or setups based on Fibonacci retracement levels
✅ I will personally be trading both signals as part of my research and ongoing strategy
⚠️ If you're risk-averse or uncertain, it’s okay to skip the May 5–6 signals
📋 Execution Plan:
🔹 Wait for the price range from the selected candles to fully form (marked by green lines on the chart)
🔹 Entry will be triggered upon breakout, including a 60-pip buffer
🔹 If SL is hit, cut/switch and double the position on the next valid setup for potential recovery
📉📈 Chart Reference:
🔗 Copy & paste this code into TradingView URL: TV/x/C5zZyXar/

[ TimeLine ] Gold 28-29 April 2025Hello everyone,
📅 Today is Friday, April 25, 2025
I will be using the High-Low price levels formed on the following dates as reference points for potential trade entries:
📌 April 28, 2025 (Monday)
📌 April 28 & 29, 2025 (Monday & Tuesday)
🧠 Trading Plan & Notes:
✅ Gold has broken its ATH multiple times over the past two weeks—volatility remains high
✅ Gold has significant reversal more than 2000pips from its ATH 3500 to 3260
⚠️ If the formed range is big, reversal entries or trades based on Fibonacci levels may be more appropriate
✅ I will personally trade both signals as part of my ongoing research and strategy
⚠️ If you're unsure or risk-averse, consider skipping April 28 & 29 signal
📋 Execution Plan:
🔹 Wait for the price range from the candles above to fully form (marked with green lines)
🔹 Entry will be triggered upon breakout, with a 60-pip buffer
🔹 If the trade hits Stop Loss (SL), switch direction and double the position size on the next valid entry for potential recovery
📉📈 Chart Reference:
🔗 Copy & paste this code into TradingView URL : TV/x/9932ommw/

Swing Trade Plan for TSLA (as of $285)TSLA has rallied from its previous consolidation zone and is approaching a potential resistance area between $290–$295. Momentum is solid, but RSI and volume trends may suggest we’re nearing short-term exhaustion.
✅ Strategy 1: Wait for the Pullback (Safer Play)
Entry zone:
• $240 – Ideal level near former resistance turned support
• $215 – Strong support with higher reward potential
Stop-loss:
• Below $200 (to protect against deeper trend reversal)
Profit targets:
• $265 – Conservative
• $290 – Re-test zone
• $355 – Bullish breakout continuation (if sentiment remains strong)
This setup gives room for the price to breathe and positions you after a healthy correction.
⚡️ Strategy 2: Momentum Breakout Trade (Aggressive)
Entry:
• On breakout above $295 with volume confirmation
Stop-loss:
• Below $280 (tight, breakout failure protection)
Target:
• $320, $340+, depending on follow-through
This is higher risk, higher reward — you’re betting on bulls continuing the charge without a pullback.
⚠️ Disclaimer: This is not financial advice. Trading involves risk. Always do your own analysis and trade with proper risk management.

EURUSD: Back to 1.1200Using the Fibonacci extension tool, we could see price hasn't closed and rally above 2.0. Maybe we could get some turn around before continuing bullish on EURUSD.


EWTSU 6E1! H4 minuette (IV) developping
EWTSU EURUSD H4
minuette (IV) developping in subminuette wxy zigzag
first target wave (IV) area 1.1080
invalidation : if price steadly brekout over area 1.1500 - wave count must be update

$97,769 and 44 cents Coinbase: BTC Genesis Fib a MAJOR barrier Shown here is a single Fib series in three different timeframes.
The "Genesis Sequence" has caught all major turns since 2015.
First fib above the Golden Genesis is likely to get a reaction.
It is PROBABLE that we "orbit" this fib a few times.
It is POSSIBLE that we Break-and-Retest to continue.
It is PLAUSIBLE that we Reject for a significant Top.
=======================================================
Previous Plots below
=======================================================
$75k Long entry:
$105k Top call
$85.3k Break entry:
=======================================================
.

NZDUSD Potential DownsidesHey Traders, in today's trading session we are monitoring NZDUSD for a selling opportunity around 0.59650 zone, NZDUSD is trading in a downtrend and currently is in a correction phase in which it is approaching the trend at 0.59650 support and resistance area.
Trade safe, Joe.

NVDA watch $113.56: Golden Genesis fib and Most Important level NVDA has come back to its "Golden Genesis" fib.
We had a high apogee orbit and have returned.
What happens here will determine the trend.
It is PROBABLE that we orbit this a few times.
It is POSSIBLE that we reject to the fib below.
It is PLAUSIBLE that we break to next fib above.
==========================================

BA watch $186 above 173 below: Golden Genesis fib may give DipBA flying back up from the tariff bottom.
Approaching a Golden Genesis fib at $186.76
We should see a dip soon, possibly to $173.40

ASML watch $675: Key Resistance that may Reject or Mark BottomASML trying to recover slowly with the chip sector.
Currently test a key resistance zone $ 673.43-677.93
Looking for a Break-and-Retest to consider long entries.

CIEN watch $72 then 76: Serious Resistance zones that cause dip CIEN coming back ferociously from the tariff bottom.
About to break second Major Resistance, one more to go.
Very likely to see a dip from one of these major zones.
$71.88-72.53 is the immediate resistance breaking
$75.93-76.30 is the next resistance to try shorting.
$68.77-69.37 is the first support in case of a dip.
=================================================
.

Expanded Flat Correction completed on ONDO?Looks like ONDO may have completed an Expanded Flat Correction and is looking at a medium term price target of $2.65. No financial advice!

MS eyes on $119: Major Resistance may End Bounce or Strong BullMS recovering well from the tariff tantrum.
About to test a major resistance $119.08-119.20
Break would show strong bull, but dip more likely.
===========================================
.

APEUSDT WXY Correction and Long Accumulation SetupAPEUSDT has undergone an extensive corrective structure, which unfolds in a clear WXY complex pattern. The terminal point of this correction appears to have completed with a potential five-wave impulse to the downside, suggesting capitulation and a shift in directional bias.
The immediate demand zone, aligned with historical accumulation and confluence of prior reaction levels, presents a technically favorable area for strategic long accumulation. Price currently hovers near 1.4665, a critical level likely to act as a liquidity magnet and interim resistance before any substantial bullish continuation can materialize.
The structural roadmap anticipates a recovery phase, contingent on sustained demand within this zone. However, the final projected upside target aligns with the macro supply zone around 6.2213, where historical sell-side activity is expected to resume. This level is marked as the primary distribution zone and should be monitored closely for potential reversal setups or exit strategies.
