SMR watch $16.44/68: well proven Resistance to Break or NotSMR trying to recover along with the nuclear sector.
Currently testing well proven Resistance $16.44-16.68
Look for a Break-and-Retest or a dip to $15.35-15.40
.
Previous Analysis that caught the BOTTOM:
Last Plot caught a nice bounce:
==============================================
.
Fibonacci

Nvda low time frameLocal price action - the gap from 4/29 was filled in, but another was left on 4/30. During aftermarket hours the price jumped up to approach the weekly level above and dropped back down. We got a naked untapped pivot point below along with the range POC point of control, not a bad week of price action.

Ehang Stock Chart Fibonacci Analysis 050125Trading Idea
1) Find a FIBO slingshot
2) Check FIBO 61.80% level
3) Entry Point > 15.7/61.80%
Chart time frame: D
A) 15 min(1W-3M)
B) 1 hr(3M-6M)
C) 4 hr(6M-1year)
D) 1 day(1-3years)
Stock progress: A
A) Keep rising over 61.80% resistance
B) 61.80% resistance
C) 61.80% support
D) Hit the bottom
E) Hit the top
Stocks rise as they rise from support and fall from resistance. Our goal is to find a low support point and enter. It can be referred to as buying at the pullback point. The pullback point can be found with a Fibonacci extension of 61.80%. This is a step to find entry level. 1) Find a triangle (Fibonacci Speed Fan Line) that connects the high (resistance) and low (support) points of the stock in progress, where it is continuously expressed as a Slingshot, 2) and create a Fibonacci extension level for the first rising wave from the start point of slingshot pattern.
When the current price goes over 61.80% level , that can be a good entry point, especially if the SMA 100 and 200 curves are gathered together at 61.80%, it is a very good entry point.
As a great help, tradingview provides these Fibonacci speed fan lines and extension levels with ease. So if you use the Fibonacci fan line, the extension level, and the SMA 100/200 curve well, you can find an entry point for the stock market. At least you have to enter at this low point to avoid trading failure, and if you are skilled at entering this low point, with fibonacci6180 technique, your reading skill to chart will be greatly improved.
If you want to do day trading, please set the time frame to 5 minutes or 15 minutes, and you will see many of the low point of rising stocks.
If want to prefer long term range trading, you can set the time frame to 1 hr or 1 day.

$BTC Huge Daily Close Above the .618 Fib !Very BIG Daily Close for ₿itcoin above the .618 Fib 🥵
CRYPTOCAP:BTC needs to close the next week in or above the green box demand area in order to keep the rally alive and flip resistance into support.
As I originally mentioned in my idea, PA either needs to correct accordingly or this is the long-awaited PARABOLA in the making.
I still stand with my original belief on how this will play out, and have numbered my ideas accordingly.
1. Correct to 200DMA
2. Correct to 50DMA
3. Inverse Head and Shoulders reversal pattern
4. PARABOLA 🚀
I hope it's time to MOON more than anyone!
but I still have a good chunk of cash on the sideline in case the market needs more time 🤓

Qualys Stock Chart Fibonacci Analysis 050125Trading Idea
1) Find a FIBO slingshot
2) Check FIBO 61.80% level
3) Entry Point > 125/61.80%
Chart time frame: D
A) 15 min(1W-3M)
B) 1 hr(3M-6M)
C) 4 hr(6M-1year)
D) 1 day(1-3years)
Stock progress: A
A) Keep rising over 61.80% resistance
B) 61.80% resistance
C) 61.80% support
D) Hit the bottom
E) Hit the top
Stocks rise as they rise from support and fall from resistance. Our goal is to find a low support point and enter. It can be referred to as buying at the pullback point. The pullback point can be found with a Fibonacci extension of 61.80%. This is a step to find entry level. 1) Find a triangle (Fibonacci Speed Fan Line) that connects the high (resistance) and low (support) points of the stock in progress, where it is continuously expressed as a Slingshot, 2) and create a Fibonacci extension level for the first rising wave from the start point of slingshot pattern.
When the current price goes over 61.80% level , that can be a good entry point, especially if the SMA 100 and 200 curves are gathered together at 61.80%, it is a very good entry point.
As a great help, tradingview provides these Fibonacci speed fan lines and extension levels with ease. So if you use the Fibonacci fan line, the extension level, and the SMA 100/200 curve well, you can find an entry point for the stock market. At least you have to enter at this low point to avoid trading failure, and if you are skilled at entering this low point, with fibonacci6180 technique, your reading skill to chart will be greatly improved.
If you want to do day trading, please set the time frame to 5 minutes or 15 minutes, and you will see many of the low point of rising stocks.
If want to prefer long term range trading, you can set the time frame to 1 hr or 1 day.

Manhattan Associates stock Chart Fibonacci Analysis 050125Trading Idea
1) Find a FIBO slingshot
2) Check FIBO 61.80% level
3) Entry Point > 170/61.80%
Chart time frame: D
A) 15 min(1W-3M)
B) 1 hr(3M-6M)
C) 4 hr(6M-1year)
D) 1 day(1-3years)
Stock progress: A
A) Keep rising over 61.80% resistance
B) 61.80% resistance
C) 61.80% support
D) Hit the bottom
E) Hit the top
Stocks rise as they rise from support and fall from resistance. Our goal is to find a low support point and enter. It can be referred to as buying at the pullback point. The pullback point can be found with a Fibonacci extension of 61.80%. This is a step to find entry level. 1) Find a triangle (Fibonacci Speed Fan Line) that connects the high (resistance) and low (support) points of the stock in progress, where it is continuously expressed as a Slingshot, 2) and create a Fibonacci extension level for the first rising wave from the start point of slingshot pattern.
When the current price goes over 61.80% level , that can be a good entry point, especially if the SMA 100 and 200 curves are gathered together at 61.80%, it is a very good entry point.
As a great help, tradingview provides these Fibonacci speed fan lines and extension levels with ease. So if you use the Fibonacci fan line, the extension level, and the SMA 100/200 curve well, you can find an entry point for the stock market. At least you have to enter at this low point to avoid trading failure, and if you are skilled at entering this low point, with fibonacci6180 technique, your reading skill to chart will be greatly improved.
If you want to do day trading, please set the time frame to 5 minutes or 15 minutes, and you will see many of the low point of rising stocks.
If want to prefer long term range trading, you can set the time frame to 1 hr or 1 day.

MATRIX SERVICE stock Chart Fibonacci Analysis 050125Trading Idea
1) Find a FIBO slingshot
2) Check FIBO 61.80% level
3) Entry Point > 12.1/61.80%
Chart time frame: D
A) 15 min(1W-3M)
B) 1 hr(3M-6M)
C) 4 hr(6M-1year)
D) 1 day(1-3years)
Stock progress: A
A) Keep rising over 61.80% resistance
B) 61.80% resistance
C) 61.80% support
D) Hit the bottom
E) Hit the top
Stocks rise as they rise from support and fall from resistance. Our goal is to find a low support point and enter. It can be referred to as buying at the pullback point. The pullback point can be found with a Fibonacci extension of 61.80%. This is a step to find entry level. 1) Find a triangle (Fibonacci Speed Fan Line) that connects the high (resistance) and low (support) points of the stock in progress, where it is continuously expressed as a Slingshot, 2) and create a Fibonacci extension level for the first rising wave from the start point of slingshot pattern.
When the current price goes over 61.80% level , that can be a good entry point, especially if the SMA 100 and 200 curves are gathered together at 61.80%, it is a very good entry point.
As a great help, tradingview provides these Fibonacci speed fan lines and extension levels with ease. So if you use the Fibonacci fan line, the extension level, and the SMA 100/200 curve well, you can find an entry point for the stock market. At least you have to enter at this low point to avoid trading failure, and if you are skilled at entering this low point, with fibonacci6180 technique, your reading skill to chart will be greatly improved.
If you want to do day trading, please set the time frame to 5 minutes or 15 minutes, and you will see many of the low point of rising stocks.
If want to prefer long term range trading, you can set the time frame to 1 hr or 1 day.

TETRA TECH stock Chart Fibonacci Analysis 050125Trading Idea
1) Find a FIBO slingshot
2) Check FIBO 61.80% level
3) Entry Point > 27.7/61.80%
Chart time frame: D
A) 15 min(1W-3M)
B) 1 hr(3M-6M)
C) 4 hr(6M-1year)
D) 1 day(1-3years)
Stock progress: A
A) Keep rising over 61.80% resistance
B) 61.80% resistance
C) 61.80% support
D) Hit the bottom
E) Hit the top
Stocks rise as they rise from support and fall from resistance. Our goal is to find a low support point and enter. It can be referred to as buying at the pullback point. The pullback point can be found with a Fibonacci extension of 61.80%. This is a step to find entry level. 1) Find a triangle (Fibonacci Speed Fan Line) that connects the high (resistance) and low (support) points of the stock in progress, where it is continuously expressed as a Slingshot, 2) and create a Fibonacci extension level for the first rising wave from the start point of slingshot pattern.
When the current price goes over 61.80% level , that can be a good entry point, especially if the SMA 100 and 200 curves are gathered together at 61.80%, it is a very good entry point.
As a great help, tradingview provides these Fibonacci speed fan lines and extension levels with ease. So if you use the Fibonacci fan line, the extension level, and the SMA 100/200 curve well, you can find an entry point for the stock market. At least you have to enter at this low point to avoid trading failure, and if you are skilled at entering this low point, with fibonacci6180 technique, your reading skill to chart will be greatly improved.
If you want to do day trading, please set the time frame to 5 minutes or 15 minutes, and you will see many of the low point of rising stocks.
If want to prefer long term range trading, you can set the time frame to 1 hr or 1 day.

TERADYNE stock Chart Fibonacci Analysis 050125Trading Idea
1) Find a FIBO slingshot
2) Check FIBO 61.80% level
3) Entry Point > 71.7/61.80%
Chart time frame: D
A) 15 min(1W-3M)
B) 1 hr(3M-6M)
C) 4 hr(6M-1year)
D) 1 day(1-3years)
Stock progress: A
A) Keep rising over 61.80% resistance
B) 61.80% resistance
C) 61.80% support
D) Hit the bottom
E) Hit the top
Stocks rise as they rise from support and fall from resistance. Our goal is to find a low support point and enter. It can be referred to as buying at the pullback point. The pullback point can be found with a Fibonacci extension of 61.80%. This is a step to find entry level. 1) Find a triangle (Fibonacci Speed Fan Line) that connects the high (resistance) and low (support) points of the stock in progress, where it is continuously expressed as a Slingshot, 2) and create a Fibonacci extension level for the first rising wave from the start point of slingshot pattern.
When the current price goes over 61.80% level , that can be a good entry point, especially if the SMA 100 and 200 curves are gathered together at 61.80%, it is a very good entry point.
As a great help, tradingview provides these Fibonacci speed fan lines and extension levels with ease. So if you use the Fibonacci fan line, the extension level, and the SMA 100/200 curve well, you can find an entry point for the stock market. At least you have to enter at this low point to avoid trading failure, and if you are skilled at entering this low point, with fibonacci6180 technique, your reading skill to chart will be greatly improved.
If you want to do day trading, please set the time frame to 5 minutes or 15 minutes, and you will see many of the low point of rising stocks.
If want to prefer long term range trading, you can set the time frame to 1 hr or 1 day.

AIQ eyes on $37: Double Fib resistance to Break or Reject AIQ recovering nicely after AI demand show to continue.
Currently testing a double fib resistance at $36.99-37.01
Looking for a Brean-n-Retest or if dips to $35.20-35.24

LRCX watch $71.06-71.37: proven Fib Zone to Pump or DumpLRCX trying to recover along with the semis overall.
Currently testing a well proven zone at $71.06-71.37
Bulls want to push immediately without any dip here.

SMH watch $212.82 above 209.43 below: Proven zone to form Trend SMH showing the recovery process of the chip sector.
Now testing a well proven zone defined by major fibs.
Golden Genesis fib at $209.43 and Covid fib at $212.82.
Look for a Break-and-Retest a Rejection.
If rejected, look for support at $191.23/85
===================================================
.

WDC eyes on $36.84 then 39.xx: look for Break and PopWDC trying to recover tariff dump with market.
Currently testing a recently proven fib at $36.84
Look for Break and pop to resistance at $39.00/39
Or we might get a dip to support below $34.17/81

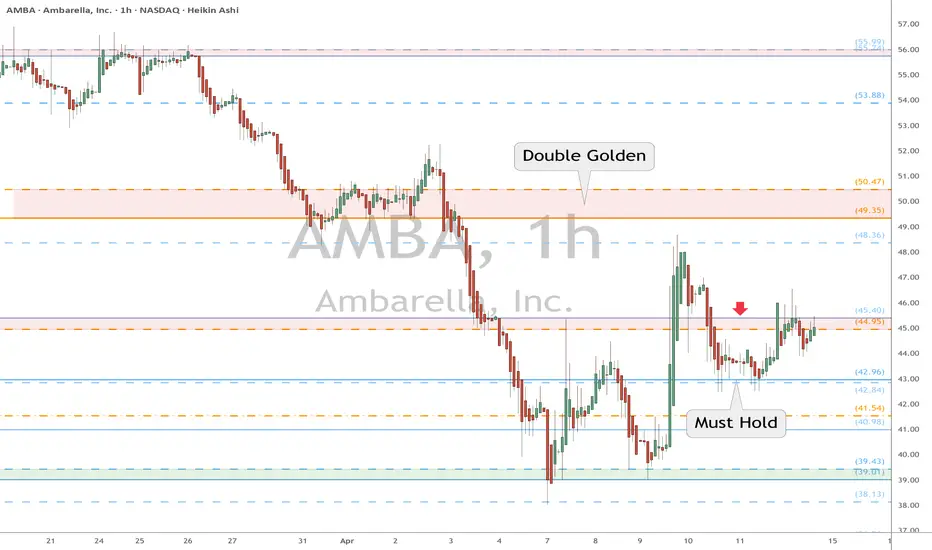
AMBA watch $44.95-45.40: Key resistance to break DownTrendAMBA is struggling with a key resistance at $44.95-45.40.
Break-n-Retest could pop to the major hurdle of $50 round.
Key support for SL shield is the double fib at $42.84-42.96.
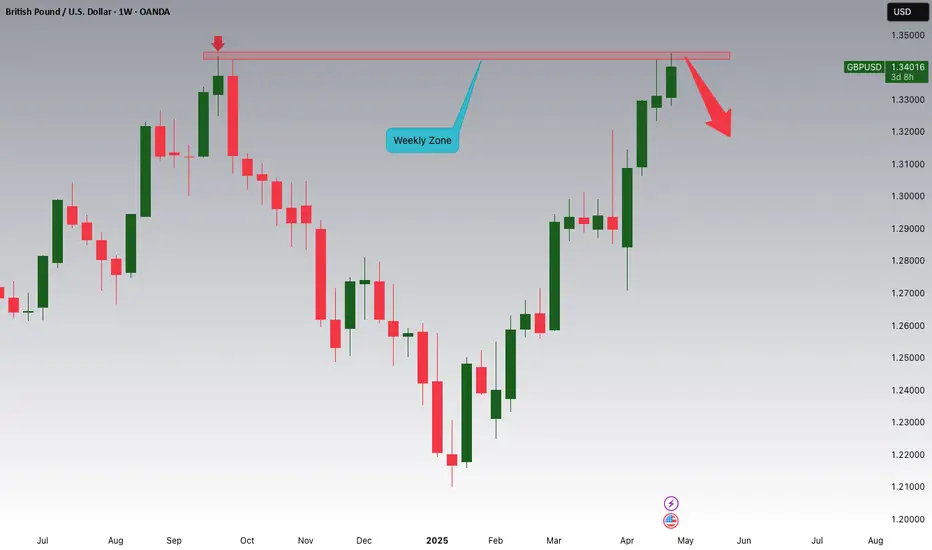
GBPUSD is Forming a Weekly Double Top!!!Hey Traders!
In today's session, we're closely watching GBPUSD for a potential short setup around the 1.34200 level.
The pair is currently forming a double top pattern on the weekly timeframe, a classic reversal signal. Price action is showing signs of rejection at the neckline, suggesting possible downside momentum from this key resistance zone.
Trade safe, Joe.
GBPJPY: Consolidation Phase Targeting the Main TrendHey Traders, in today's trading session we are monitoring GBPJPY for a buying opportunity around 189.600 zone, GBPJPY is trading in an uptrend and currently is in a correction phase in which it is approaching the trend at 189.600 support and resistance area.
Trade safe, Joe.

Try going long gold in small batchesFundamentals:
Focus on US economic data and Fed dynamics;
Technical aspects:
Gold continues to fall and is currently testing the 3200 mark. It is undeniable that gold is currently in a clear bearish trend, and the foreseeable area below is the 3185-3175 area, which is a strong support in the short term. However, the long and short sides are currently wrestling at the 3200 mark, and I think there will still be repetitions in the short term. So gold should rebound before falling to the 3185-3175 area.
Trading strategy:
Consider trying to go long on gold in small batches in the 3210-3200 area, TP: 3220-3230.
Please note: In order to protect the security of the account, as gold rebounds, you can consider gradually moving up the SL to ensure profits.

AAPL watch $218 above $208 below: Key bounds into EarningsAAAPL to release a consequential earnings report today.
We have well proven fibs and zones to watch for reaction.
What happens here may well define the next 1-4 YEARS.
$ 217.86-219.87 above is immediate resistance
$ 208.26-208.68 is tested but tired support.
$ 196.65-197.33 is a good stop-hunt support.
==================================================
.

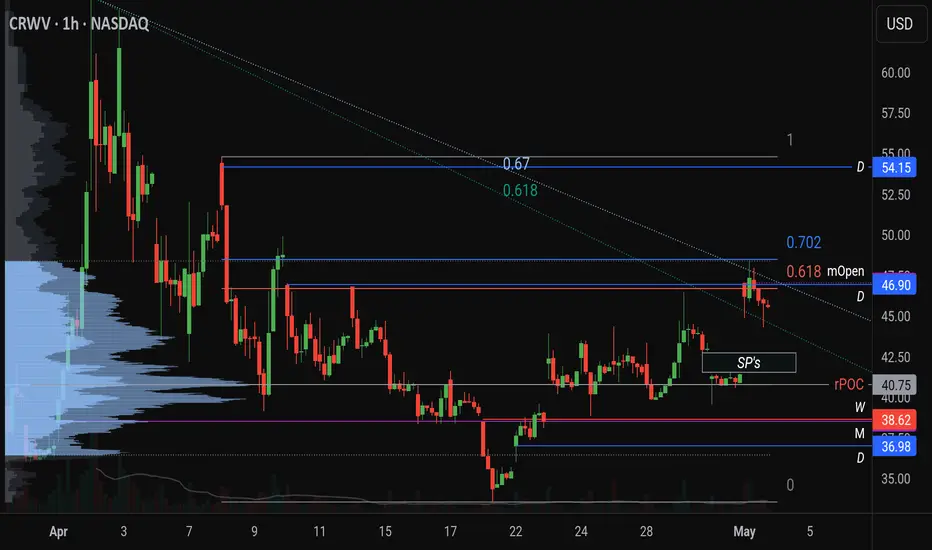
First lookFirst look at CRWV, some basic monthly weekly daily levels, range POC point of control, and a speed resistance fan, which price shot up into at the moment. If I was looking to get involved I'd wait for a slight retrace into the SP below left behind because of the gap that was left from the day before
LLY watch $833 then 800 round: Dips to buy for next leg upLLY announced new weight loss drug in pill form.
News created a spike which might retrace some.
$833.38 is high support, 800 well supported by fibs.

US Dollar Bulls Return Ahead of NFPsThe US Dollar is testing resistance today at the 2023 / 2024 low day closes (LDC) at 99.95-100.42- looking for possible infection off this mark in the days ahead.
A closer look at USD price action shows the index trading into the resistance at the median-line in early U.S. trade. A topside breach above this threshold is needed to validate a breakout of the weekly opening-range with subsequent resistance see at the September high-day close (HDC) / September high at 101.77/92. Note that channel resistance converges on this threshold over the next few weeks and a breach / close above this slope would be needed to suggest a more significant low was registered last week / a larger reversal is underway. Subsequent resistance eyed at the 2016 high-close / 2020 high at 102.95/99 and the 2023 yearly open at 103.49.
Key support remains unchanged at the 2018 swing high / 61.8% retracement of the 2018 advance at 97.71-98.39- a close below this threshold would threaten another bout of accelerated USD losses with subsequent support seen at the 96-handle, the 2022 LDC at 95.17 and the March 2020 low at 94.65.
A rebound off key support takes the U.S. Dollar into initial resistance with major event risk on tap tomorrow. From a trading standpoint, losses should be limited to this week’s low IF price is heading higher on this stretch with a breach above 100.42 needed to fuel the next leg of the recovery.
-MB

Japanese Yen Short-term Outlook: USD/JPY Breakout ahead of NFPThe U.S. Dollar plunged more nearly 12% off the yearly high against the Japanese Yen with USD/JPY rebounding off support at last week near the 2024 low.
Initial resistance now in view at the 100% extension of the recent advance at 146.11 and is backed by the 38.2% retracement at 147.14- both levels of interest for possible topside exhaustion / price inflection IF reached. Broader bearish invalidation is eyed at the 1.6185% extension / 2022 weekly high close at 148.67/73.
Ultimately, a break / daily close below 140.25 is needed to mark downtrend resumption with the subsequent support seen at the March high-day close (HDC) / March high at 137.35/91 and the 78.6% retracement at 134.65.
From a trading standpoint, rallies would need to be limited to 147.14 IF price is heading lower on this stretch with a close below 140.25 needed to fuel the next leg of the decline.
-MB

BITCOIN | 30M | IMPORTANT SUPPORT ZONE Hello, my friends,
Yesterday, I shared a Bitcoin analysis and stated that my target level is 97,300.
At the moment, we are within the blue support zone I highlighted in my analysis yesterday. Although this is not a very strong support zone, I am expecting an upward movement from here. However, the most critical support level lies between 92,000 and 91,000.
As I mentioned yesterday, as long as the price does not drop below the 92,000 - 91,000 levels, my target remains at 97,300.
Please don't forget to like.
Thank you to everyone who supports with likes.
