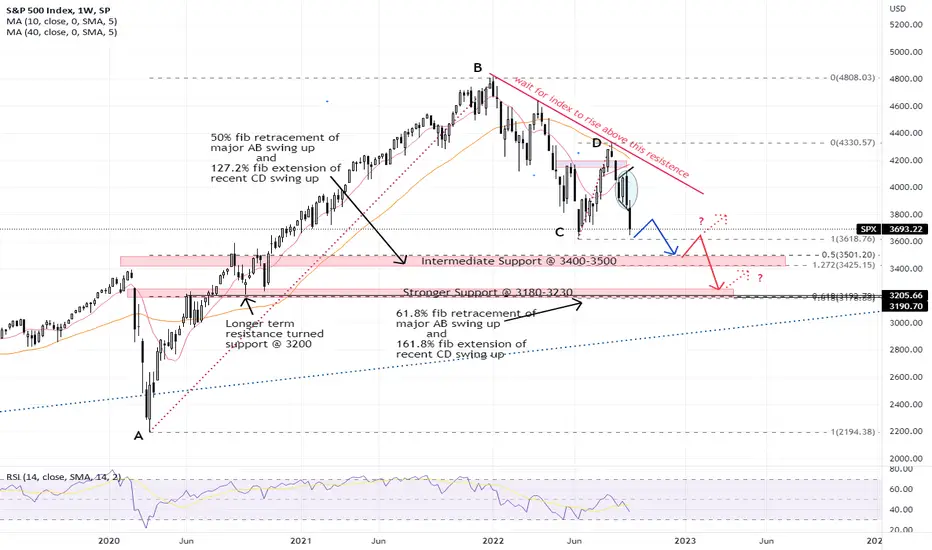
SPX - How far can it drop?S&P broke down from it's weekly broadening "pennant" decisively last week after Powell gave another blow to the markets ("don't fight the FED" resonated with a resounding punch to the hopeful bulls, ouch!).
It is now near June's low (point C) and pretty oversold in the near term. Hence a short bounce from here is possible but there is likely a lot less conviction for a sustainable bounce this time.
Should we break June's low in the coming days, then the next support is around 3400-3500 where we have a conflucence of:
1. 50% fib retracementand of the major AB swing up and
2. 127% fib extension of the recent CD swing up
However, I won't rule out a worst case scenario where market might not bottom until around 3200 where we have a conflucence of:
1. 61.8% fib retracement of the major AB swing up and
2. 161.8% fib extension of the recent CD swing up
3. horizontal resistence turned support @ 3200
This is just a technical prediction and by no means guaranteed. The market is fluid and Economic situations (& Powell) could change along the way and until we see a clearer sign that the bottom could be in, it is safer not to catch a falling knife unless one is an asttute short term trader or an ultra long term investor.
Disclaimer: Just my 2 cents and not a trade advice. Kindly do your own due diligence and trade according to your own risk tolerance and don't forget that money management is important! Take care and Good Luck!
Fibonacci Extension
1321: EAST PIPES (TASI)Breakout is observed
Series of HH, HL
Watchout for the formation of HL (Retest)
Aggressive entry can be taken at current level (74.6)
Safe entry can be taken after formation of HL
Trade with SL,
Target Prices (fib levels) are mentioned, Ride the trend with trailing stop loss

DXY Fundamental & Fibonacci AnalysisThe Covid-19 pandemic and Russia vs Ukraine war created supply shortages and imbalance in the global economy. In order to balance out the supply & demand and find equilibrium, demand needs to be reduced to meet supply. The way they can achieve this is by hiking interest rates, making things more expensive and making risk assets costly to hold. Until inflation has cooled down, the Federal Reserve will continue to hike interest rates, which means selling of risk assets by smart money in exchange for USD, so they can profit from Dollar strength and high interest rates even when markets are going down, like a safe haven. It is estimated that at least 2 more rate hikes are priced in. If the Fed doesn't hike interest rates before recession it would be disastrous for the economy, it's unfortunate for most of the population but it's tough medicine.
I expect continuation of the uptrend until the fundamental situation changes, which should happen sometime in 2023, possibly at the end of Q1, a year before the Bitcoin halving also. I expect DXY to break the Lower High at 121 and top out at 132, at the Golden Ratio of the previous swing impulse and the -0.272 Fibonacci extension.
If you appreciate my analysis, don't forget to like this post and follow my page. Share your thoughts in the comments. Thank you

BTC SIMPLY FALL DOWN TO 5500$I don't want to say anything that hasn't been technically analyzed, but based on trend lines and Fibonacci tools, Bitcoin will fall between $5500-5900 and then grow, a huge and strange growth.

GBPUSD bullish switch to mitigate monthly fib retracement @ 38.2Please see chart markups and anchored notes for multi-time frame top-down analysis from monthly - weekly - daily - H4
Chart demonstrates my price direction bias based on H4 liquidity/ supply & demand areas

GOOG daily bullish hammer with RSI divergence Sell Stop 101.27 LMT 101.27 GTC
Buy Stop 105.08 GTC
Buy Limit 95.46 GTC
GOOG daily bullish hammer with RSI divergence, Stop loss above local high pivot, take profit to fibonacci 50% extension.

BTC weekly falling wedge and bullish signs#BTC/USDT
$BTC in the weekly time frame shows a divergence between RSI and price, also RSI candles are above HMA indicator, and price is above the lower zone of the falling wedge pattern.
🐮 these are some bullish signs that if it remains this way price will make a leg up to touch the resistance zone around $30k which is the same with the upper zone of the falling wedge pattern.
🐻 breaking down from 1.272 fib level will invalidate this scenario and price will drop to 1.414 fib level which is the lower of the lower line of the falling wedge.
#women_life_freedom


EUR/USD SELL IDEAStoryline: EU is currently in a bearish condition and has been that way for a minute.
Basically the whole year so far. Last week price action initiated a sell for the continuation of the trend.
Price is currently moving off a weekly OB and headed for 0.95429 which is the -sell side liquidity that lies below the previous range swing low.
0.94655 and 0.87377 would be the levels to look forward to get tagged next.
Follow for more...
Thanks for reading :)

BTC.D - The Alt Season is around the corner! Don't miss it.
The Alt Season is around the corner, I can see it on this chart! It's not a question of if it will happen, but when it will happen.
The lighting network is not supported by major exchanges because they don't want it and it's not in their business plan (as per the statement). This is, at this moment, very positive for altcoins.
It's really important to pick the right altcoins because we are not in 2017 when even scam coins pump.
We have been moving sideways on this chart for a long time, but nothing lasts forever. I expect a breakdown of this bearish rectangle pattern very soon!
As per my Elliott Wave analysis, this structure is very bearish and we should continue down with another impulse wave. From an EW standpoint, an ABC correction has been completed, so there is probably nothing that can stop this downtrend.
ALT SEASON usually happens when the BTC.D goes down. It's usually during bull markets. When we are in a bear market, everyone is selling their altcoins and buying bitcoin instead.
The 0.618 FIB extension from wave (1) to wave (2) is the next target, but I think we can go even lower later.
Make sure to pick the right altcoins. I expect tremendous gains for selected altcoins. You can find them in the related section down below.
For more analysis, hit "Like" and "Follow"!

Elliott Wave CheatSheet with Fibonacci Targets - LogScaleHi EW Fans,
added some interesting and helpful Fibonacci Numbers in Terms of Elliott Wave from an old Sheet i have found in the Web. You need to switch your Chart and your Fibonacci Tool to Log-Scale.
Greetings

Volkswagen going wild soon Germany's largest carmaker and DAX40 group Volkswagen did not perform well on the stock market in recent months and the share price went south. Since the beginning of the Ukraine war, the price lost slightly over 50% or 126€.
On the overarching chart picture, however, this sell-off is only part of an overarching correction according to my assessment. The market is catching its breath to be able to survive the upcoming wave 3 well.
Due to the current market situation on the indices, especially the strong sell-off in the German economy, the price will probably come down to the 0.887 retracement at the 99€, before the trend direction of the market turns.
From there, a price increase of at least 300% is possible on a multi-year level. The 1.618 extension is at 396€ per share.

I Entered Long on Bitcoin TodayBitcoin broke a temporary downtrend with an impulse up. With the 1 marked on the fib tool, I drew down to where the impulse started from. Noticing that it retraced without a bar close below the 88 percent retracement effectively, I entered the trade. Luckily, it has not reached the 161.8 percent extension of its golden ratio sequence of the pattern that all assets follow.

AUDUSD CONSOLIDATION BREAKOUTPair: AUDUSD
Timeframe: 4H
Analysis: Round number level, trend line, volume profile, support and resistance, consolidation break
—————
Key Takeaway: Been ranging for some time now and we finally saw some breaks to the downside toward the end of last week, we are looking for re-tests of this broken level of support before shorting as USD has gained some strength pushing this pair down
—————
Level needed: need a close by —
—————
Trade: Short
RISK:REWARD —
—————
DO NOT ENTER OUR SETUPS WITHOUT CONFIRMATION

IWM weekly bearish hammer wave 5 downtrendOrder SELL IWM ARCA Stop 164.04 LMT 164.04 will be automatically canceled at 20230401 01:00:00 EST
IWM weekly bearish hammer wave 5 downtrend take profit at 168% fibonacci extension of wave 4 downtrend, stop loss above the hammer.

Long for Bank niftyStop loss and Target provided on Chart
everything on Chart you can see 2 levels meet on support levels

4170: TASI (TOURISM ENTERPRISE CO.) Short move within EquivalenShort move within Equivalent Triangle
(Rising Support to Falling Resistance top)
Trade with proper stop loss
Watch for breakout of Symmetrical Triangle Pattern
Ride the trend with trailing stop loss and TP @idnetified fib levels

3 FIBONACCI TOOLS YOU MUST KNOW 💡
Hey traders,
In this article, we will discuss 3 classic Fibonacci tools you must know.
1️⃣Fibonacci Retracement
Fib.Retracement is my favorite fib.tool. It is aimed to identify strong horizontal support and resistance levels within the impulse leg.
We draw this tool based on the high and low of the impulse (from wick to wick) and it shows us POTENTIALLY strong structure levels determined by Fibonacci numbers.
Common Fib.Retracement levels are: 0.382, 0.5, 0.618, 0.786.
Once one of the levels is reached, wait for a confirmation before you open a trading positions.
2️⃣Fibonacci Extension
Fib.Extension indicates strong horizontal support and resistance levels beyond the impulse. Similar to Fib.Retracement tool, Fib.Extension is drawn relying on impulse's high and low (from wick to wick) and it shows POTENTIALLY strong structure levels where the consequent impulses may complete based on Fibonacci number.
Common Fib.Extension levels are: 1.272, 1.414, 1.618.
Once one of the levels is reached, wait for a confirmation before you open a trading positions.
3️⃣Fibonacci Channel
Fib.Channel shows strong vertical supports and resistances (trend lines) within the channel. The tool is drawn based on the trend line of a valid parallel channel (based on wicks) and it shows POTENTIALLY strong trend lines from where the market may retrace.
The trend lines within Fib.Channel rest on 0.382, 0.5, 0.618, 0.786 Fib.Levels.
Once one of the levels is reached, wait for a confirmation before you open a trading positions.
Remember that Fibonacci's are simply tools in a toolbox. In order to use them properly, you need to build a trading system around them, test it and confirm its efficiency.
❤️If you have any questions, please, ask me in the comment section.
Please, support my work with like, thank you!❤️


10/5/22 XOMExxon Mobil Corporation ( NYSE:XOM )
Sector: Energy Minerals (Integrated Oil )
Market Capitalization: $413.096B
Current Price: $99.12
Breakout price: $100.00
Buy Zone (Top/Bottom Range): $97.60-$87.90
Price Target: $105.00-$106.20 (3rd), $120.10-$121.70 (4th)
Estimated Duration to Target: 26-29d (3rd), 85-91d (4th)
Contract of Interest: $XOM 10/21/22 100c, $XOM 12/16/22 105c, $3.80/contract
Trade price as of publish date: $2.69/contract, $3.80/contract

10/5/22 CEGConstellation Energy Corporation ( NASDAQ:CEG )
Sector: Utilities (Electric Utilities)
Market Capitalization: $29.200B
Current Price: $88.17
Breakout price: $89.45
Buy Zone (Top/Bottom Range): $86.80-$82.45
Price Target: $93.20-$95.00
Estimated Duration to Target: 21-23d
Contract of Interest: $CEG 11/18/22 95c
Trade price as of publish date: $3.00/contract

Jumping S-curvesIn this post, I will explain what jumping S-curves means and how you can identify potential S-curves before they jump .
First, let's begin with the chart above (also copied below).
This is a yearly chart of McKesson Corporation (MCK), a medical supplies company.
As you can see in the chart below, this stock has been soaring over the past year despite most other stocks being significantly lower.
Here is the performance of the S&P 500 over the same time period.
Whenever I see something highly unusual in a chart, such as extreme outperformance, I check the higher timeframes to see what's driving price on a technical level. Below is the yearly chart for MCK.
When I examine price action over a long time period, I always log adjust my chart. Below is the log-adjusted chart.
Upon seeing this chart I immediately knew what was going on: the stock price jumped S-curves. I will try to illustrate below how I reached this conclusion.
To begin, I drew Fibonacci levels from the last reaction low to the last reaction high on the yearly timeframe.
The previous reaction low was the bottom of 2008 because that bottom was a Fibonacci retracement of some earlier reaction high, the reaction high is the top in 2015 because price did not surpass that high without first undergoing a Fibonacci retracement (to the golden ratio).
As you can see above, from 2015 to 2018 the price retraced down to the golden ratio (0.618) on the yearly chart. It is often from this retracement level that the base of the second S-curve is created. (For simplicity, I only included the 0.618 Fibonacci level on the chart).
Some may say that this pattern is merely a bull flag or pennant. (See chart below)
Indeed, bull flags and pennants can be another way to visualize S-curve jumps.
Whereas, on a deeper, more mathematical level, S-curve jumps are logarithmic spirals (approximated as Fibonacci spirals or Golden spirals). If you wish to delve deeper into logarithmic spirals, including the Golden spiral, you can check out this Wikipedia page: en.wikipedia.org
These Fibonacci or Golden spirals are present on mostly every chart and they appear on mostly every timeframe (hence they are fractal ).
One of the best charts you can use to visualize these spirals is the chart of Bitcoin. Below are charts of Bitcoin which attempt to show the endless fractal nature of Fibonacci spirals (or "S-curve jumps").
I've only illustrated a few of the spirals, but indeed there are numerous spirals. (I tried to do my best using the tools on Trading View to draw these spirals, but it can be quite hard to manipulate the curves perfectly to price action.)
One may ask what about when price falls? That is obviously not an S-curve jump since the price is falling.
Actually, when price is crashing it is usually just an S-curve jump, or Fibonacci spiral, on the inverted chart.
Although I have not tested it with scientific rigor, I do hypothesize that Bitcoin's price movement is a series of infinitely fractal and competing Fibonacci spirals on various timeframes, including Fibonacci spirals on inverted scales. Price movement can be thought of as an infinite series of S-curve dilemmas where infinitely fractal S-curves, including those of which are inverse S-curves, compete to govern the next price move.
Each dilemma is resolved when an S-curve reaches its inflection point, such that it governs price movement and price moves rapidly in that direction until it approaches capacity and faces its next dilemma.
Those who know Calculus may recognize this chart. Indeed this is the graph of a logistic function. The mathematical terminology for an "S-curve" is sigmoid function .
Here are some more interesting charts of S-curves (none of which is intended to be investment advice)
Meridian Bioscience (VIVO) jumps S-curves on its yearly chart
The U.S. Dollar Index jumps S-curves on its yearly chart
The entire price action of Chinese EV Company (NIO) is an S-curve that just completed a perfect golden ratio retracement
Japan's faces a population S-curve dilemma
Citigroup underwent S-curve growth up until the Great Recession.
Then it crashed or underwent S-curve growth on the inverted chart.
In summary, price movement involves an endless series of S-curves or Fibonacci spirals. Identifying an S-curve on a high time frame before it reaches its inflection point and breaks out can lead to tremendous gains (among the most lucrative gains one can realistically make in the financial markets).

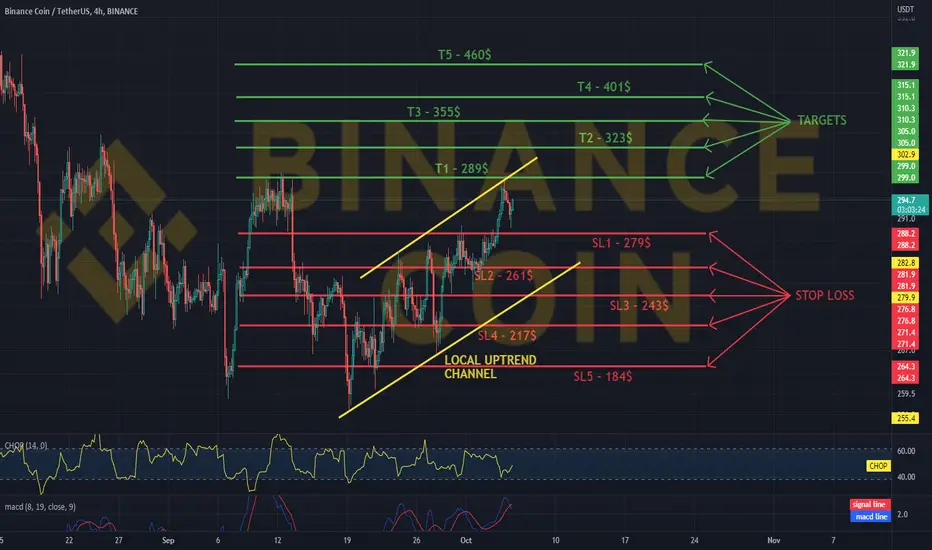
BNB / USDT 4HCHART TARGETS AND STOPLOSSHello everyone, let's take a look at the 4H BNB to USDT chart as you can see the price is moving in the local uptrend channel.
Let's start by setting goals for the near future that we can consider:
T1 - $ 289
T2 - $ 323
T3 - $ 355
T4 - $ 401
and
T5 - $ 460
Now let's move on to the stop loss in case of further market declines:
SL1 - $ 279
SL2 - $ 261
SL3 - $ 243
SL4 - $ 217
and
SL5 - $ 184
Looking at the CHOP indicator, we can see that in the 4H range the energy slowly starts to rise, while the MACD indicator shows a local downward trend.