XRP - Choppy Market, Will We See $1.5 Again?After finishing the 5-wave structure in early 2025, XRP had a rough patch, trading between $3 and $2 and offering some pretty neat swing trade opportunities. Now, two months later, the big question is: will this range continue, or is a breakout on the horizon? Let’s break down the key levels and high-probability setups.
Short Trade Setup
Resistance Zone:
The weekly level and the 0.618 Fibonacci retracement are both around $2.5763 to $2.5792, aligning nicely with each other.
The anchored VWAP from the all-time high at $3.4 adds extra resistance at about $2.63.
Setup Details:
A low-risk short trade can be considered at the weekly level, with a stop-loss set above both the anchored VWAP and the swing high.
Target: The monthly open, aiming for an R:R of about 4:1.
Support Backup:
Additional support in this range comes from the 0.618 Fibonacci retracement (from a low at $1.9 to a high at $2.59), the weekly 21 SMA at $2.28, and a weekly level at $2.0942 just below the monthly open.
This support between the weekly level at $2.0942 and the monthly open is crucial for maintaining bullish momentum. If it holds, the bearish short setup stands; if it breaks, things could get tricky.
Long Trade Setup
When to Consider a Long:
If the support zone mentioned above fails, look for a long trade opportunity at the swing low around $1.77.
Support Confluence:
Primary Support: The swing low at $1.77, with lots of liquidity around that area.
Additional Layers:
The monthly level at $1.5988.
The weekly level at $1.5605 sits just below the monthly.
The 0.618 Fibonacci retracement from the 5-wave structure at $1.5351.
Anchored VWAP from the low at $0.3823, aligning with the weekly level.
And don’t forget the psychological level at $1.5.
Setup Details:
This long trade setup would offer an attractive R:R of roughly 6:1, targeting back to the monthly open for an approximate 33% gain, with a stop-loss placed below the $1.5 mark.
XRP's current trading range has provided some good short and long trade setups, a long opportunity at the swing low ($1.77-$1.5) could be the next big play. Whether you lean towards short or long, finding these confluence zones helps in making more informed, high-probability trade decisions.
If you found it helpful, please leave a like and a comment. Happy trading!
Fibonacci Retracement

GOLD → Consolidation before the news. What to expect?FX:XAUUSD is not going to turn around. The level of economic risks is still at a high level and the price may continue to rise, but after the end of consolidation.
Gold is back to a record $3,246 despite calm markets. Lower US bond yields and a pause in capital withdrawals are supporting demand for protective assets.
Uncertainty around Trump's tariff policy and expectations of a Fed rate cut are driving prices higher. Additional support is provided by inflows into Chinese ETFs and expectations of Chinese GDP data. Further gold movement depends on headlines on tariffs and Fed rhetoric.
Technically, the focus is on consolidation 3244 - 3187 and internal support level 3208.
Resistance levels: 3244, 3270
Support levels: 3208, 3187
The market is likely to be in consolidation until tomorrow, when important economic reports will be published. But nevertheless, there could be strong movements intraday due to various factors. I expect to see a retest of support at 3208 or 3187 before further upside. But, consolidation near 3244, breakout and consolidation above the level may give a chance for growth
Regards R. Linda!

SOL Bulls Strike Back — But Is It Sustainable?Solana continues to respect technicals with precision — after a +42.9% move from the $95 low, we're now at a pivotal moment in price structure. Let’s break down what’s happening and where the high-probability setups lie.
📍 Key Bounce Zone – Golden Pocket Confluence
Local Low: $95.26
Golden Pocket Zone (0.618–0.666): $97.09–$94.82
This area acted as a major demand zone, with price sharply rebounding.
First Volume Spike: Followed by retracement into Golden Pocket Zone at $102.
Second Volume Spike: Occurred right after touching Anchored VWAP ($108.21) from the $95.26 low, which added beautiful confluence with the Golden Pocket Zone – a secondary high-conviction long entry.
📈 Rally to Resistance – Short-Term Climax
After the anchored VWAP retest, SOL rallied into the key resistance zone aligned with the 0.786 Fib retracement from the previous down move — a historically reactive level and a prime profit-taking zone.
Monthly 21 EMA ($135.83) and the monthly 21 SMA ($133) — both key dynamic resistance zones.
Low-volume retest of that key high suggests buyer exhaustion, not continuation — a classic setup for a short-term reversal.
🧭 Current Market Structure
Current Price Action: Trading above both the weekly open ($128.38) and the monthly open ($124.54).
This forms a critical S/R zone between $124–$128, now acting as a potential battleground for bulls and bears.
As long as price stays above this zone, momentum remains with the bulls.
🔍 What to Watch Next – Reclaim or Reject?
Key Support to Watch:
$125 (psychological level) and monthly open at $124.54 – This zone is likely to be liquidity-hunted. Expect a sweep of this low, look for the reaction.
Daily Support Confluence: currently at 21 EMA: $123.77 & 21 SMA: $123.27
1.) 📈 Scenario A – Bullish Reclaim:
If SOL sweeps the low and shows strong buying reaction (bullish engulfing candle, volume spike), it sets up a potential long opportunity towards the weekly open, to watch for the next reaction.
2.) 📉 Scenario B – Failed Hold:
If there's no bullish reaction at $124–$125, expect further downside.
First target = $122
Second target = $120.65
🎯 Tactical Game Plan
Bulls:
Watch for reaction at $124–$125 – potential scalp long with tight SL.
Confirmation on volume expansion and break of $128.38 for continuation.
Re-enter long after clean retest of weekly open from above.
Bears:
Short setup possible if weekly/monthly open is broken and retested as resistance.
First TP = $122, second TP = $120.65.

ETH is fighting in the support zoneHello everyone, I invite you to review the current situation on ETH. When we enter the one-day interval, we can see how the ETH price moved in a strong downtrend channel. What's more, we can see that the price fell below the main uptrend line.
As we can see, the price is currently fighting to break out on top in the support zone from $ 1690 to $ 1350, in a situation if this zone was broken, we could see another strong drop to the support area at $ 884 at the previous low after the bull run.
On the other hand, if ETH gets wind in its sails again, it must first pass through the resistance zone from $ 1952 to $ 2100, while further on there is a very strong zone from $ 2500 to $ 2740.
However, here, taking into account the one-day interval, the RSI indicator shows a breakout above the top of the border, which may affect the potential end of the current uptrend.

GOLD → Countertrend correction. What to do in this case?FX:XAUUSD , after a bull run, bumps into strong limit resistance at 3244 and enters a correction phase, which is generally a logical maneuver amid strong gains.
Gold corrects from Friday's record $3,245 and moves back to $3,200 amid improving market sentiment and progress in trade talks. The price pared gains after a strong weekly rally, reacting to U.S. concessions on tariffs on Chinese electronics and China's pledges to boost economic stimulus. Additional influences come from the dialog between the US and Iran, as well as the anticipation of China's GDP and trade data for March. Despite the pullback, downside may be limited due to ongoing uncertainty.
Technically, it is worth looking at the 3187 - 3167 conglomerate of support, which can stop (temporarily or even turn the price upward) a strong and sharp decline, as the fundamental backdrop within the tariff war is still tense.
Resistance levels: 3244, 3270
Support levels: 3187, 3174, 3167
The rally is temporarily halted, but there is no talk of a trend reversal, as the tariff war fire is still burning, Trump or Xi Jinping may add to the fire....
Within the framework of counter-trend correction, the emphasis is on the support of 3187, 3174, 3167 from which we can trade a false breakdown and catch the price rebound.
Regards R. Linda!

NZDJPY → Back in range, there's a chance to strengthenFX:NZDJPY is forming a false break of the range support and within the reversal pattern confirms the break of the bearish structure
The fundamental background has been extremely unstable lately and depends on any harsh statements of politicians, mainly related to the trade war.
But, technically, the pair is returning to the range on the background of local market recovery. A false breakdown of the range support is formed.
The break of the bearish structure, the formation of the reversal pattern and the return to the trading range give chances for strengthening of the price. If the bulls hold the defense above 83.7 - 84.2, the currency pair may strengthen to 85.15 - 87.4
Resistance levels: 84.196, 86.15
Support levels: 83.79, 83.31, 82.21
Consolidation above the key support zone may allow the bulls to strengthen the price to the local zone of interest. Global trend is neutral, local trend is upward.
Regards R. Linda!

EUR/NZDExpecting price to react off the levels that I marked, to continue higher, these levels I marked are aligned with my Fib levels.

$HNT Massive Weekly Close up 60%
Grabbed all downside liquidity.
Helium Up 60% on the week.
W bottom reversal pattern formed.
Broke out of a 16-week downtrend, but got rejected at .236 Fib
Closed above the EMA9, which is now support.

Will BTC emerge from the descending channel on top?Hello everyone, I invite you to review the current situation on BTC. On the one-day interval, you can see how the price is moving in the downtrend channel in which there is again a fight with the upper boundary of the channel. At this stage, you can also see how the EMA Cross 50/200, they have come very close but still indicate the maintenance of a long-term upward trend.
Here you can see how the price has currently bounced off the resistance zone from $ 86,503 to $ 87,934. Only an upper exit from this zone will open the way towards the second important zone at the levels of $ 93,959 to $ 96,142, and then we have visible strong resistance around $ 101,800.
Looking the other way, you can see that in the event of further declines, we have support at $ 80,550, then you can see an important zone that previously maintained the price decline from $ 74,340 to $ 71,380, in a situation where this zone is broken, we can see a quick decline to around $ 65,360.
The MACD indicator shows an attempt to switch to an upward trend, it is worth watching whether there is enough energy for further movement.

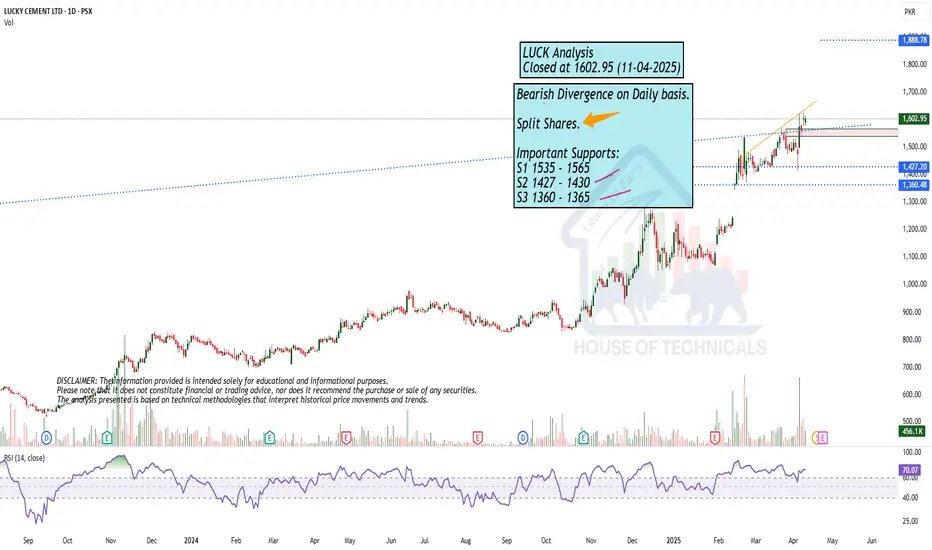
Wait for a Proper Support!Wait for some Bullish Candles to appear at Support level with Good Volumes.

Impact of Split sharesBearish Divergence on Daily basis.
Split Shares.
Important Supports:
S1 1535 - 1565
S2 1427 - 1430
S3 1360 - 1365
GOLD → Price is consolidating, but to what end? Growth?FX:XAUUSD continues on its way as part of a strong rally. Price is testing strong resistance and there is a good chance of a new high as the trade war escalation intensifies. Against the backdrop of the bull run, there is no need to think about selling!
Gold is trading near all-time highs above $3,200 on Friday, posting a weekly gain of about 5.5%. Rising prices are fueled by concerns over U.S. financial stability and the possible resignation of the Fed chief, adding to pressure on the dollar. Expectations of recession and Fed rate cuts are increasing amid escalating trade war with China, after the US imposed tariffs of 145% and Beijing retaliated - China raised tariffs to 125%. Inflation in March came in below expectations, reinforcing forecasts for a rate cut. Focus is on further trade talks and China's response
Resistance levels: 3219.5
Support levels: 3197, 3187, 3167
Emphasis on the local range: 3219 - 3187. Breakdown and price consolidation above the resistance will provoke rally continuation. But I do not rule out a correction to accumulate energy before the continuation of growth. In this case gold may test 3197 (0.7f), or support of 3187 range.
But we should be aware of the fact of unpredictability: If the US and China sit down for negotiations, the situation may change dramatically.
Regards R. Linda!

Wait for Weekly Closing..Weekly Closing above 165
would be a +ve sign.
Immediate Targets can be
around 176 - 178 & then 185 - 187.
Trade must be closed if it
breaks 152 as Next Support
will be around 133 - 134.

Hidden Bullish DivergenceMonthly Closing above
75000 would be a +ve sign.
Hidden Bullish Divergence on Daily TF
has also appeared.

BITCOIN → Testing trend resistance. Will there be a breakout?BINANCE:BTCUSDT is approaching trend resistance and most likely it may test the liquidity zone and risk zone for sellers (liquidity hunt ?), but does the market have the potential to support the upside?
Bitcoin is strengthening and channel resistance may not stop this growth. Based on the nature of price movement (smooth, gradual, consolidating), bitcoin may test liquidity 84.7K - 88.8K. But it is too early to talk about further growth
On W1, the price is in a trading range (consolidation) between the previously broken global consolidation support and the current support. Short bodies, long shadows speak about consolidation. Also worth noting are the relatively long tails to the downside and the weak market reaction...
Fundamentally, the cryptocurrency market (community as a whole) for the past week did not get anything positive as from the very beginning of this year, the growth can be attributed to the 90-day technical break by Trump, but there are a number of nuances:
- the fire has not yet been put out
- just because they gave a 90-day break doesn't mean everything is fine. It's just a head start for the U.S. to prepare for the situation more thoroughly
- The escalating conflict between the U.S. and China has investors looking for less risky assets like gold. Cryptocurrencies are definitely not on that list.
- Rumors of a US interest rate cut are likely to provide support as well.
Resistance levels: 84700, 88800
Support levels: 78200, 73-74К, 66500
I would not hurry with conclusions about further growth. Growth could be considered if bitcoin overcomes 88800 and consolidates above this zone. But a sharp approach or a false breakout of one of the mentioned liquidity zones may provoke a reversal and fall.
Regards R. Linda!

LTC/USDT 1W ChartHello everyone, I invite you to review the current situation on LTC. When we enter the one-week interval, we can see how the price is struggling to return above the upward trend lines.
Here you can see how the current rebound is going towards resistance at $ 82.82, then resistance is visible at $ 95, but an important resistance point will be around $ 115.
Looking the other way, you can see that the price has gone below the support level at $ 70, however, we could see a quick rebound, in a situation where the price continues to go down, the next very strong support is around $ 50.
It is worth looking at the RSI indicator, which shows another descent in the week interval to the level where we could previously see strong price rebounds, which could potentially repeat itself.

BIG BIG weekI think 7 FED speakers,
A lot of tension in the markets, tops mean polarisation, considering reflexivity theory extreme volatility will ensue.
A lot of people might think the -0.786 ATH we got before the holidays is the top. I think they are mistaken as seen in the analysis below.
There is still legroom for higher, this is a big bet on my part.
I have a few contracts on the mag7 (GOOGL, TSLA and META) focusing on GOOGL since they seem to be in the same headwind as S&P
Let's see how this plays out

Closing just below Weekly Resistance.Closing just below Weekly Resistance.
If 36.90 is Broken, we may witness further
Selling pressure.
Sustaining 36 - 37 would again take the
price towards 49 - 52. However, Weekly
Resistances are there like 43 - 44 & then
48 - 49.

Does History Repeat Itself? How Far Can the Nasdaq Fall?Let's examine the current 2025 correction on a logarithmic chart: the price movements show significant similarities to the February 2020 decline. At that time, the global crisis—then driven by COVID-19 panic—fundamentally influenced market movements, while now, trade uncertainties are generated by President Trump's aggressive tariff announcements.
The chart reveals that the Nasdaq is declining steeply, and technical levels play a decisive role: yesterday, the price bounced back from the 61.8% Fibonacci retracement level. However, it is clear that supporting technical indicators—such as the break of the RSI convergence trend on the days triggering the decline—confirm the downward movement.
In the earlier 2020 decline, massive volume accompanied the initial weeks' movements, while this year's movement is characterized by steadily increasing volume. Nevertheless, the current volume peak falls short of the peak measured in the 2020 week (4.45 million vs. 6.8 million), indicating that the trend may continue with further declines.
Overall, technical analysis—the examination of logarithmic charts, the break of the RSI trend, and volume movements—suggests that the current correction may deepen further, and the Nasdaq's target price can be estimated between 14,500 and 15,000 points.
Observing a similar scenario in history, when global events triggered high volatility, it appears that market reactions now do not differ from past patterns. If the current negative trend continues, a further deepening of the correction is plausible, as the lag in market volume (4.45M vs. 6.8M) indicates that investors have not yet been able to offset the negative sentiment prevailing in the sector.

GOLD → Global economic risk indicator consolidates ahead of CPIFX:XAUUSD , rather quickly changes the market structure to bullish and continues its aggressive rally. The economic risk indicator is working perfectly. Technically, the focus is on the range 3135 - 3099
Gold is consolidating around $3,100 in anticipation of US inflation data. The escalating trade war between the US and China keeps demand for defensive assets alive despite the pause in price gains. Trump imposed 125% tariffs on Chinese goods and China retaliated with duties of 84% on U.S. imports. Increased tariff tensions are raising recession expectations and encouraging bets on a Fed interest rate cut, which supports gold. However, a rise in March CPI inflation (expected 2.6% y/y) could trigger a downward correction, although the impact could be short-lived - tariff news remains the main driver
Technically, the price failed to reach the 3135 liquidity zone and reversed, which attracted the crowd willing to sell (deceptive maneuver). But, after correction the price may return to the target quite quickly
Resistance levels: 3135, 3167
Support levels: 3100, 3090, 3077
Emphasis on the range boundaries, possible retest of 3100-3090- 3075 before continuation of growth. On the news or before the opening of the American session there may be a long squeeze before the continuation of growth.
Regards R. Linda!

DOGE → Will the market hold strength or lose it all?BINANCE:DOGEUSDT is testing the liquidity and resistance zone amid a downtrend as part of a news-induced rally. Will the market hold this trend or return to a sell-off?
The downtrend continues. As part of the correction triggered by the news backdrop, bitcoin strengthened and pulled the altcoins with it. But the market may lose all its growth quite quickly, as bearish pressure on the market is still very strong (There are no fundamental positive changes for the market). The fall of BTC may be followed by DOGE as well.
Technically, the price is forming a false break of the resistance zone 0.1622 - 0.15700, consolidation of the price below this zone will provoke the continuation of the fall to the nearest zone of interest 0.13646.
Resistance levels: 0.157, -0.1622
Support levels: 0.13646, 0.1277, 0.1154
A retest of the trend resistance is possible, but price consolidation below the key zone will be a good signal indicating the seller's strength, the decline may continue. On the weekly timeframe we have a trigger at 0.14217, break of which will open the way to 0.1277 - 0.1025.
Regards R. Linda!

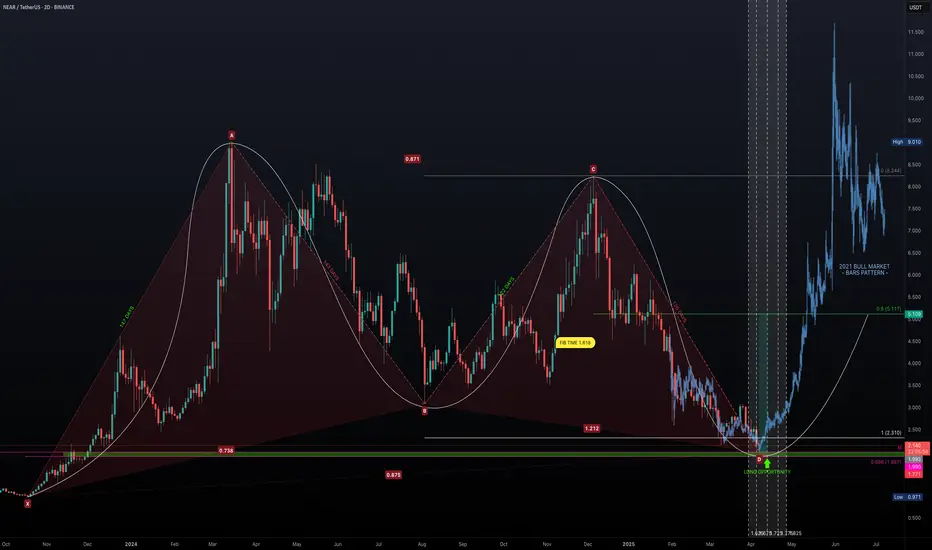
NEAR the Bottom? - The Crash Ends HereBack in October 2023, NEAR embarked on an incredible bull run lasting 147 days, surging from a low of $0.971 to a high of $9.01—an astounding +828% gain. Following this euphoric phase, the market sentiment shifted dramatically. Over the subsequent 392 days, NEAR retraced to around $2, marking a -78% decline. Now, with the market at a critical juncture, the question remains: when does the madness of the crash end, and can we finally see a reversal?
Harmonic Patterns & Fibonacci Confluence
Chart Pattern Analysis: The XABCD Framework
Using the XABCD pattern tool, we identify the following key points:
Point X: $0.971
Point A: $9.01
Point B: $3.076
Point C: $8.244
Point D: $1.978
Durations:
X-A: 147 Days
A-B: 143 Days
B-C: 122 Days
C-D: 126 Days
These durations show remarkable symmetry—with the up-move phases (X-A and A-B) nearly matching in time, and similarly for the correction phases (B-C and C-D). This time symmetry supports the presence of a harmonic structure, and the retracement levels help validate the potential for a reversal.
Fibonacci Implications
Fib Retracement of XA: Point B is at 0.738
Fib Retracement of AB: Point C sits at 0.871
Fib Retracement of BC: Point D lands at 0.875
Fib Extension of BC: Point D is at 1.212
While Point D’s retracement at 0.875 is slightly deeper than the classic 0.786 level expected for a Gartley Harmonic, it remains close enough to validate a harmonic correction, especially considering market noise. Additionally, the expansion of BC at 1.212 is close to the 1.27 range, lending further credence to this being a Gartley-type pattern.
Time Factor: Fibonacci Time Extensions & Exhaustion
147-day Bull Run: NEAR rose from $0.971 to $9.01 in 147 days.
392-day Bearish Correction: Since hitting $9.01, the price has retraced for 392 days.
Fibonacci Time Extensions:
1.618 multiplier: 147 × 1.618 ≈ 238 days. A Classic "golden ratio" reversal target. This period coincided with a +135% surge in November.
2.618 multiplier: 147 × 2.618 ≈ 385 days. High-probability exhaustion point. This is nearly equal to the current 392 days, suggesting that time-based exhaustion may be imminent.
The alignment of these time-based measures with the price retracement (approximately 87.5% retracement of the original move) signals a critical juncture where the bearish phase could soon be over.
Identifying the Support Zone & Long Opportunity
Based on harmonic and Fibonacci analyses, the confluence of key support levels points to a potential bottom:
Harmonic Point D: Trading near $2.
Monthly Level: $1.99 acts as a strong support benchmark.
Fibonacci Retracement (0.886): at $1.887.
These levels create a long opportunity window between $1.99 and $1.887. This confluence offers a solid entry region for long positions.
Additionally, other confluence factors include:
Fibonacci time extension at the 2.618 level (around 385 days) aligning with the current duration of the bearish phase.
The symmetry of the XABCD pattern adds to the reliability of the support structure.
High-Probability Trade Setup
Long Entry:
Entry Zone: Accumulate positions in the $1.99 to $1.887 range.
Target: Aim for the 0.5 Fibonacci retracement level of the bull run, approximately $5.00, which represents a potential +150% gain from current levels.
Risk-to-Reward (R:R): With the setup targeting a substantial rebound, the risk-reward ratio is very attractive, particularly if entry is taken in the defined confluence zone.
Market Outlook:
Current Sentiment: NEAR is in a significant downtrend, evidenced by a dramatic -78% retracement after an explosive bull run.
Reversal Indicators: The harmonic pattern, Fibonacci retracements, and time exhaustion (392 days approaching the 2.618 extension) all point towards a possible bottom formation in the coming month, particularly during April.
Potential Reversal: If NEAR holds within the $1.99 to $1.887 window, a reversal back towards $5.00 appears plausible, echoing the conditions seen at previous market cycle reversals.
Key Takeaways
Historic Run & Severe Correction: NEAR surged over +828% in 147 days only to retrace -78% over the following 392 days.
Harmonic Confluence: The XABCD pattern and Fibonacci levels create a compelling argument for a turnaround.
Time & Price Alignment: Fibonacci time extension around 385 days combined with an 87.5% price retracement suggests market exhaustion.
Solid Long Entry Zone: The support between $1.99 and $1.887 offers an attractive risk entry point with the potential to target a move back up to $5.00.
After decades in the trading arena, one thing is clear—the market often cycles through periods of euphoria and despair before turning a corner. NEAR's confluence of harmonic symmetry, Fibonacci retracement, and time-based exhaustion is almost too aligned to ignore. With a defined long entry window between $1.99 and $1.887, this might be the moment to consider a high-probability long trade. As always, manage your risk diligently and wait for clear confirmation.
Wrapping it up here, happy trading =)
If you found this helpful, leave a like and comment below! Got requests for the next technical analysis? Let me know.
GOLD → Bounce back to accumulate energy before growthFX:XAUUSD confirms interim bottom at 2970 after a false breakdown and as part of the escalating trade war, price is strengthening from support to the important medium-term level of 3054.
Further dynamics will depend on the market reaction to the minutes of the March Fed meeting and the introduction of reciprocal tariffs between the US and China. The introduction of 104% duties on Chinese goods increases trade tensions, reduces investor confidence and supports the price of gold against the background of a weakening dollar. Even with the Fed's cautious rhetoric, gold may keep rising due to the escalating trade war.
The medium-term situation depends on the Fed (namely hints or actions on rate cuts), the trade war and negotiations on the situation in Eastern Europe
Resistance levels: 3054, 3077, 3099
Support levels: 3033, 3013 (0.5f), 2995
Since the opening of the session (the price has passed the daily norm) gold has exhausted the technical potential and the 3054 area may push the price down (false breakout). As part of a technical pullback, gold may test 3033 - 3013 before looking at upside attempts again.
Additional scenario: pullback to the fvg zone (0.7 - 0.79 fibo) before further growth.
Regards R. Linda!
