Bitcoin compared to DASH, LTC and ZECHow do Dash, LTC and ZEC move against btc? Can we learn anything from their relative movements?
Orange arrows indicate the tops in altcoins which usually results in a stall or minor consolidation in btc price
Blue arrows indicate bottom of alt moves and either coincide with or lead the rise in btc price.
Check the fib retracements to check for potential bottoms. We already had a wick to 62%
New moon was on the 25th and may coincide with a local top
Fibonnacci

50% R2R (Circular Geometry)50% R2R (Circular Geometry)
The large Price/Time Continuum Harmonic is completed, the 2.618 Arc has been reached.
Is a 50% Retrace 2 Reload needed, are there any indications it will.
No large Retraces have happened in Bitcoins recent rallies.
Yes, minor corrections to the .236 or .386 but the last major 50% retrace was on 03/03.
So yes maybe we are overdue and is this the market structure being build.
Is this the third driver? and are we in for a big retracement/Correction.
I doubt this strongly there is simple no reason for people to sell and Bitcoin is getting exponentially scarcer over time as more people want them.
Injoy
Om Sri Satoshi Ji Namah
OM Sri Satoshi Mahadev! Jai!
OM


ETHBTC opportunity for short positionETH had very interesting movement for the last couple of weeks and I think that the losses are not finished yet.
There is a big bearish candle from 3rd of April. This kind of big candles tend to create support/resistance which is placed at 50% of Retracement of the body of the candle ( shadows doesn't count).
…Yes you can apply this kind of analyze to any other big candle but this level seems to be respected for last couple of days.
I marked something similar to double top where 0.04075 was hit twice with doji candle. I consider this as the confirmation for further loses.
Pair is trading below 200Ema which is another signal for bearish movement.
I would put SL above the green line and TP as follows:
0.030000 Most likely
0.025000 Probably
0.020000 well it is possible
I would advise to open position with small stake only.

2.5 RR BAT PATTERN 4HR USDCADPerfect Bat pattern has formed on the 4HR time frame for USDCAD, analysis lines up perfectly with my adjusted EURCAD short which is currently up 40+ pips
Tight PRZ for this trade, expect volatile moves with the news today.


Gold - which way ??????Case for a buy - if price closes above the 9 ema , gold may be a buy towards the .618 retracement.
Case for a sell - if price closes beneath the 14 ema , gold may be a sell towards an equal legs projection towards 1001.
A move to the downside seems likely because
i. Price has nearly made a 50% retracement.
ii. Hidden divergence is present. ( it may or may not be significant).
iii. That RSI ticked below 70.
iii. Risk reward favours the downside.
I would appreciate any assistance, with comments or ideas.


GBP/NZD - "Corrective Structure Over? Fib conf, Support Zone"Recent Corrective price action on the GBP/NZD Hit 50 fib, hoping for a break of the channel and some to new structure highs

Trendline and Fib testingTesting the Trendline and the 50.00% Fib and as you can see it's forming HL on the 4h chart. Watching how market behaves the next hours and if it doesn't break => Long position


Continuation Pattern for EURUSDAfter some indecision, last week a doji candle was formed in weekly major support level. We can now se on the daily chart some head and shoulders pattern indicating long for EU in the short term.
We are expecting it to reach the 61.8 fib retracement on the green line, and then a possible downside breakout.
This will probably stop at the -27% extension to then retest major levels, and continue to move to the downside.
This is a long term trade, which on it's way, will leave a lot of intraday opportunities.
THE OVERALL SENTIMENT IS SHORT FOR THE LONG TERM.

AUDUSD Buy if trendline breakIf we see price breaking the upper trendline this is the setup we could potentially see

GBPUSD: Valid CypherOn FX:GBPUSD , there is a great opportunity to go long. The market moves sideways, which formed the valid Cypher pattern. Thus, it gives a good Risk/Ratio. However, it is better to wait the market to be opened and see Monday reactions, not to rush a trade.
T1 - 38.2%
T2 - 61.8%
-----------------------------------------------------------------------------------------------------------------------------------------------------
Top 10 Forex Brokers List - www.best10forex.com
Best Binary Options Brokers - www.binaryreviewed.com

EURUSD - Back to Back Bearish AB = CD Pattern It looks like a valid AB=CD Short Formation anyone else thinks it's a good idea to go short?

8/29/2016 WTI Oil Short - Fib levels and candle analysisHello everyone. Been a while since I traded again. I've been holding back since Brexit and trying to avoid trading with the US elections going on but started looking at charts again last week. Today I am entering short on WTI Crude Oil. I have entered at the current price of 46.94$ with a stop loss of 50$. Please use your own judgment if you trade in agreement for your entry and limits.
As shown we have a traditional candle pattern of an Evening Star within the last 5 days. On top of this formation we have what may be a double top while coming down from a 76.4 Fibonacci replacement and sitting on the support of the 61.8 level waiting to break under. Not only do we have both of these going on, there is also bearish divergence in Williams %R and Stochastic Oscillator, depending on your settings for them. My stochastic is set to be the same as Williams %R on default settings. I didn't mark it on my chart but you can also see a very large volume for the week on the day of the doji candle.


HOW I TRADE (VERY HELPFUL!!)HOPEFULLY THIS HELPS YOU GUYS!
REMEMBER TO HIT THAT LIKE BUTTON!
GIVE US A FOLLOW AND ASK ANY QUESTIONS IF NEEDED!
THANKS
TOM

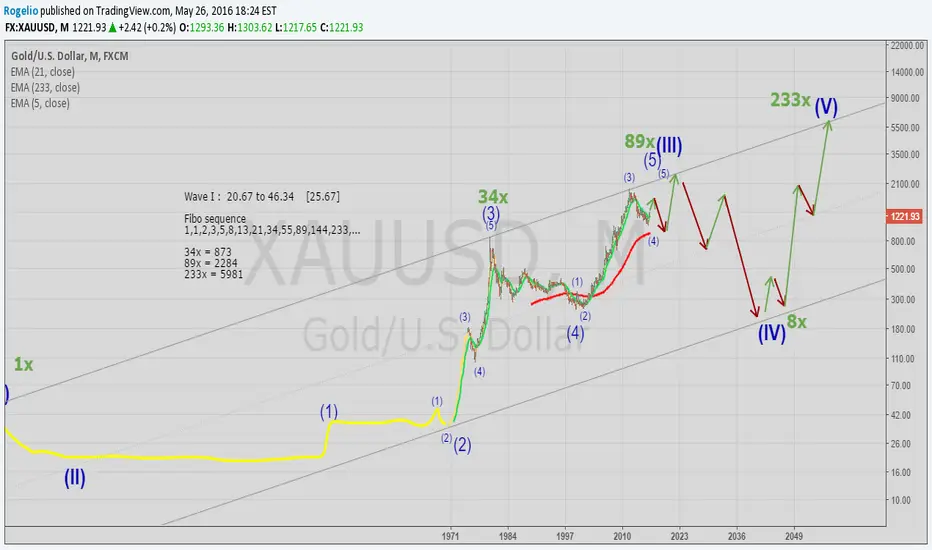
Gold very long termXAUUSD
Very longterm chart
Trading wave 4, before reaching a new high (2284).
Wave 5 possible $6000, but not in our lifetime.
Fibo multiples for the new highs, maybe also apply for the lows
chart:
www.zerohedge.com
www.zerohedge.com
AUDUSDBouncing of the 141.4% Extension level on the H1, @weekly its targeting the 61.8% retracement.
This is yet again another possible trend continuation area from the weekly view, ill will be watching closely
for a possible inversed HH or an aggressive break of the previous HH and giving LL to find an good entry point. I will follow up this idea with posts. Im yet not in a trade, we were looking at the 50% the last time which did not held.
Closely monitoring the USDOLLAR as well, if it will show weakness on the technical side
#RunItUp!
Im trading live on weekdays at www.twitch.tv visit my channel!
Good luck guys

AUDNZD symmetrical triangle with 5 hitsSymmetrical triangle has been forming on the AUDNZD pair for 3 months now.
5 strong hit points .
Look for a break to the upside at hit point 6 or a break to the downside at hit point 7 after hit 6.
Profit targets are clearly indicated by green lines and are based on previous structure. The top profit target is unlikely but very hopeful if we get a break to the upside.

USDZAR bearish cypher pattern enter nowBearish cypher to enter now.
Strong bearish divergence on the RSI.
Profit target is based on Fibonacci levels and is 15.44830 as an initial target and then 15.29297 as a second target.
Stop loss is based on previous structure, which isn't great for this trade.

EURUSD SHORT BIASHERE IS ANOTHER EXAMPLE OF WHY I CALL THIS PATTERN A STAIR CASE OR STAIRS, WHICH ENDS WITH A U SHAPE.
THE RATIOS ARE: 23.6-38% RETRACE BETWEEN A STRONG MOVE,
THEN A 76 % FIB EXPANSION CONTINUATION OF THE MOVE
WHICH THEN GOES INTO A 38% RETRACE.
AS ALL TECHNICAL ANALYSIS, THERE ARE A BIT MORE MATHS INVOLVE BUT IT'S MOSTLY EXPERIMENTAL. THE TREND ANGLE FOR EXAMPLE IS A GREAT TOOL TO UTILIZE DURING ANALYSIS, IT ASSIST IN PREDICTION WHEN COMPARING TIME PERIOD AND PRICE.
HAPPY NEW YEAR, I WISH FOR EVERYONE A PROSPEROUS 2016!
