Bitcoin sending mixed signalsOn the daily BTC is sending contradicting signals. On the bearish scope, a bear flag pattern has formed which is a reliable signal that the trend will continue downward. But as the flag pattern formed there is also a falling wedge formation which is a very bullish signal, about 63% of the time the market trends upwards. We most take into consideration, inflation, Ukraine and Fed policy have played a huge part in downward movement, right now the path of least resistance is downward because there is big resistance around the $ 42,000 dollar area. We will have to wait and see what happens but most likely bitcoin will test lows it hasn't tested since July 2021 when it was sub $30,000 dollars where it will meet strong support at the $29,000 area.
If you like or don't like my idea please feel free to comment, I would like to read your take on things.
Flagformation

AUDCHF Heading to the downside? (FUNDAMENTALS)Hey Traders,
AUD is showing weakness as the RBA are ready to start hiking rates, this data is usually already priced into the market but it is the meeting minutes which indicate where we are heading into the future. Also expecting lower retail sales data later in the week.
CHF is looking rather bullish, on the other hand with not much room for the Monetary Policy to ease the outlook is rather Dovish. The data releases do remain weak but with stocks heading lower I can see money flooding into the CHF.
As you can see by the chart, we have formed and broken a clean flag pattern on the 4h timeframe. Keep an eye on how this chart runs and the reaction to the interest rate hikes by the RBA.
Good luck traders!

When a Symmetrical Triangle Pattern Fails, What to DoDon't mind the audio quality & the background noise I didn't plan this just decided to share.
One of the ways I figure out why a pattern fails and while my stop loss hit I fix it and make sure I recover it and even more sometime. Yea I know its not good to have that mentality of "I must recover, I can't take a loss" but as a professional you can fix it right on spot and that is why I'm sharing this for the beginners and even professional that do not know about this.
As you can see on the chart the 1st symmetrical pattern was forming so I thought this is it but unfortunately after the so called breakout (which I thought) it didn't succeed I took some loss the when I saw a potential Flag Pattern forming I thought yes, this is my chance, it's happening, I would take a long immediately after breakout but again I was wrong, the 2nd lager Symmetrical Triangle is forming so when I finally figured it out I knew where exactly the next move and I took it. I recovered from the first loss and made extra, cool.

Market Unpredictability This is a perfect example of the market sometimes not going your way. I shorted on the first bearish flag thinking of course that this is one of the strongest indicators of market direction and I got burned (lost a little money). My mistake: Not looking for other signals. In this case the 20ema crossed over 50ema sending the price up. Sometimes you have to look at more than 1 indicator or pattern, this isn't always the case but it is better to have 2 signals than one.
The second time both the indicator and chart pattern aligned perfectly together and as a result the market dropped as expected.
I want to be clear that you should never jump back in so fast in a trade, personally after a loosing trade I step back for a day or two or trade another pair. But in this case the analysis was strong and it led me to some profits.
The market is always going to do what it wants, all we can do is analyze, prepare our risk management and execute.

AdaniportsAdaniports made flag pattern on an hourly chart & broke out of it with good volumes.
Could be bought with mentioned stoploss && targets..

Bull Flag Pattern - Everything You Need To Know! 🏳️Hello Traders!
This is the first post in my educational series, today we will be talking about Bull Flag's.
- I've basically detailed everything that you need to know in the chart so theres not much more to say.
- The only crucial things you need to know are...
** A Bull Flag is a bullish consolidation pattern. (Means price is preparing for the next move up)
** Anything beyond a 45* degree angle is no longer bullish and is bearish.
** There is a "Technical Target" associated with a bull flag that tends to be pretty accurate, you can use this to know when to sale.
Thats basically it, like i said everything you need to know is detailed in the chart!
If you found this helpful please like and follow for more educational topics!
Thanks Everyone, best of luck trading!

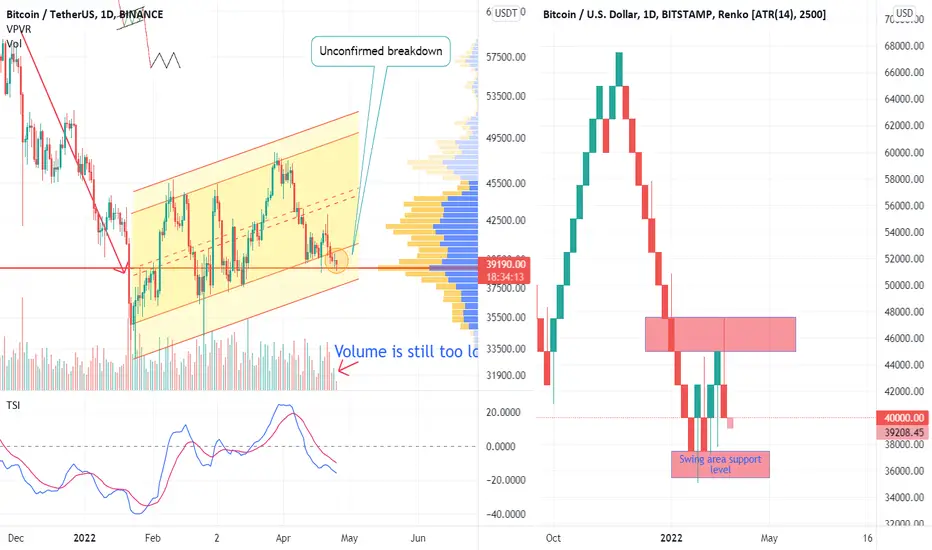
unconfirmed breakdown of the bearish flag patternit seems bitcoin is forming a bearish flag pattern. we can find a breakdown in this pattern, but we still can not confirm this breakdown for the following reasons:
1- the Volume is to low
2- The price has not left the Break Down area quickly
3- We can not identify a strong red candle
To confirm this breakdown, Bitcoin must first breakdown the Renko swing pattern.
If the price returns to the flag pattern, the current failed breakdown can be considered as a potential spring.
ShardaCropShardaCrop made flag pattern & broke out of it n trading comfortably above it with good set of volumes.
Could be bought with mentioned stoploss & targets.

BTC SHORT SET UPMarket just finished 1 to 5 Elliot Wave Theory and formed a bearish flag pattern at the bottom, broke it at the bottom so we are expecting price to continue dropping until it reaches demand zone at 30000 zone.
Target:30200
Entry: 37729
Invalidation: 40571

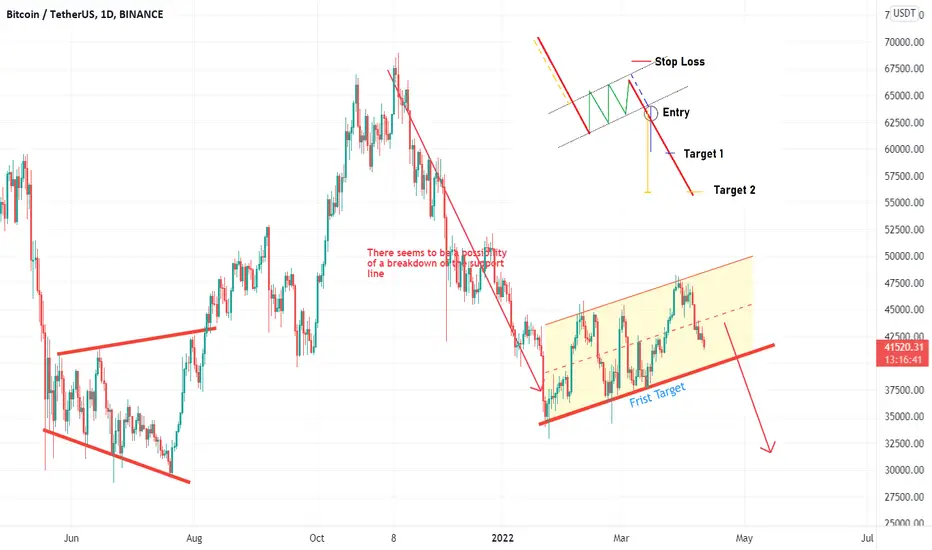
the first target is 40300As mentioned earlier, Bitcoin has created a downward flag pattern (see the chart below).
Although I expect breakdown of this pattern in the future; But its short-term target is 40,300
McDonalds - MCD• Nice upside of the MCD in the last weeks.
• It looks like a flag formation beginning April at the 61.8% Fibonacci Retracement
• The gap before the flag formation showed a nice support at USD 242.95/244.77
• 50 MA is turning positive and will cross the 200 MA soon if the upside is continuing
• Outbreak of the flag formation was with higher volume which is supportive for the continuation
• Price target at around USD 280
• Let’s see if the price can break through the resistance of the 100 MA and the 76.4% Fibonacci Retracement in the next days

BTC is Forming A Bear Flag in downtrendIn the Binance chart, it is noticeable that Bitcoin is apparently forming a bear flag pattern in the downtrend. This pattern usually leads to breakdown and continues the downtrend

Copper looks interestingIt seems we have an ascending wedge formation on the 3h timeframe
Further confluence would be to
1.Wait for the break of the structure
2. Look for a lower timeframe structure for dirty (it could be a flag, triangle or even a smaller wedge)
It's a long way down patience pay
There's enough time to plan the trade and trade the prepared plan

AXS **FLAG** formation = Online 🔥🔥Just wait breakout :)
CUP and HANDLE formation target at least 91 USD.

DOGE : Flag & Cup and Handle formationDOGECOIN : Flag & Cup and Handle formation active :) 20-25% target 2% stop margin 5 % spot (**wait break out to buy**)

AUDCAD Analysis I Potential Rise to Resistance Welcome back! Here's an analysis of this pair!
**AUDCAD - listen to video analysis.
We recommend that you keep this pair on your watchlist and enter when the entry criteria of your strategy is met.
Please support this idea with a LIKE and COMMENT if you find it useful and Click "Follow" on our profile if you'd like these trade ideas delivered straight to your email in the future.
Thanks for your continued support!
Brian & Kenya Horton, BK Forex Academy

BTC Bear Flag - Continuation DownBTC is still in a strong downtrend, with the most recent attempt at a reversal failing to gain steam. Price has created a small parallel channel up off the lows - a textbook Bearish Flag pattern.
Expect the see a break below the lower boundary of this channel for a bearish continuation.
A break below the swing low would be confirmation of continuation of the downtrend.
Still aiming for the big psychological level of 30k mentioned in previous ideas in the charts below - in a downtrend like this, these big round numbers tend to act like magnets. Remaining patient.

SIKA - Flag pattern Breakout🔴DISCLAIMER
***** It's just for an educational purpose and so you must also follow your own technical analysis before taking up the trade ******
Aggressive traders enter at the breakout and conservative traders may give entry after retracement (Retracement is optional, we cannot expect every stock to take a retest after the breakout, it may also continue to have its bullish pressure after the breakout)
After reaching our targets, trail your stop loss to get maximum profit from the stock in a single trade

USD/JPY Flag PatternLooking at a legit Flag Pattern here on USD/JPY if this is a solid pattern price should break up out of flag for continuation. Will see what happens.

Torrent PowerTorrent power made flag pattern on hourly charts.
Torrent power is breaking out of this pattern.
Buy with mentioned sloss & tgt of 590++

PidilitePidilite made an flagnpole pattern also took support @ 50% fib retracement level.
Buy with sloss 2325 & tgt of 2500

SOLANA CHART PATTERNSOLANA has been forming a bullish flag pattern, the volume is also showing that the bear market is getting exhausted and is possible that the general tendency is going upwards.

TSLA - Another Pattern is formingI can say now, the pennant pattern is invalid, because it broke the violet line that would have served as support for the pattern. But, now it is forming a new bullish pattern.
The Bull Flag Pattern, bullish flag is also an extension/continuation of the existing trend. Even though flags suggest a continuation of the current trend, it is prudent to wait for the initial breakout to avoid a false signal.
"TA is just a probabilistic analysis- not certainty. Everything is possible. The analysis just points to what is likely probable. TA is not 100% correct." - George Tan
