Bitcoin's road into 2032This is the most conservative and optimistic outlook short term as long term I can think of as provocative as it may look...
This chart incorporates data from 2014 up to 2032 influenced by fundamental ideas stated in "The Bitcoin Standard", macro analytic data from Martin Armstong's study "The Economic Confidence Model", chart patterns inspired by Opticalart and the ideas stated in Tyler Jenk's article "The Long And Winding Road To A $10 Million Bitcoin" as well as his Hyperwave study that predicts a return to the $1000 base at some point during the capitulation phase that I think has yet to happen.
According to the seen drawings, capitulation should take place around December this year with a sharp violent bounce back to the $5000 mark followed by a year-long stagnation and momentum built up in the $3000 range and a slow but steady rise back with $20000 highs being broken during '24 and the final move towards first $500000 by '26 and then 10$ million by '32 entering Armstong's next economic cycle with Bitcoin becoming the global reserve currency.
Forcast

USDJPY ShortSell USDJPY after hitting the resistance above as shown
TP: 107.200
SL: 109.900
looking for to read your comments
good luck

GBPNZD going shortGBPNZD going short, coming from a double top pattern, and re-tested the resistance (support previously)
tp and sl are on the chart
good luck

BAT - broke important resistance After breaking out of the 2650 satoshi range, it's now time to get a broader look at where it could possibly move to.
Let's put a long right now and see if we have the 2650 satoshi level as support if we break lower than stop loss would be located at ~2600 sats.
More over the next resistance levels are marked at with the upper red lines.

EURUSD FORCASTI HAVE BEEN IN BUY POSITION SINCE LAST WEEK ON THIS TRADE, BUT THE PRICE KEEP CONSOLIDATING AROUND THE SUPPORT ZONE...
THERE IS 2 BUY ZONE HERE, IF YOU ARE NOT IN THE TRADE ALREADY, YOU CAN WAIT FOR THE PRICE TO REACH BUY ZONE 2..
THE PRICE MAY NOT COME DOWN TO BUY ZONE ZONE COS IS ALREADY MOVING UPWARD.. NOBODY KNOWS
you can give your comment

NZDUSD FORCASTWE ARE GOING ON LONG SELL FOR NZDUSD...
Strong resistance gonna pull the price down... We are selling 90%

BTC will top on December 11th at $9555.50.I see the top for BTC in 2019 to be at $9555.50 December 11th.
This is part of a more long term chart.

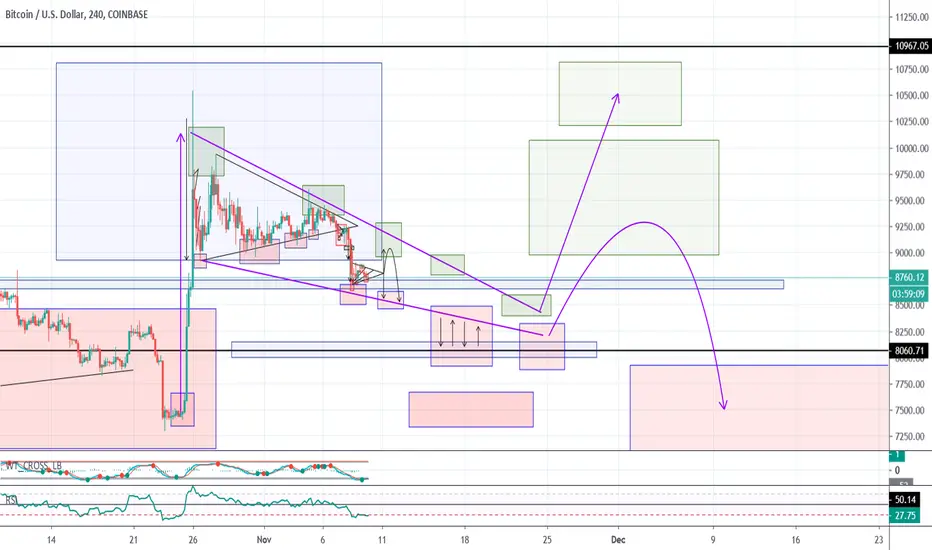
BTC at critical level,holding above 8400 for a possible reversalHi, guys, the market is in a gloomy mood. Pump and dump have occurred from time to time for the last two weeks. Overall, BTC price has gone through a measured downtrend movement for the time period which is not friendly to traders, because not volatility means no trading opportunities.
So any hope of a turnaround this week?
Let's walk through the technical picture first.
The weekly chart looks bearish as the push-up that happened at the end of October has almost vanished, topping at 10500. And bearish pin bar generated in the last weeks clearly indicate selling force has overrun BTC.
Daily Chart is very weak, with an orderly slide to 8400 over the last two weeks, whereas no quick slump shows the market is not panic anyway.
RSI comes down to 40, sitting at the trendline.
So, in the daily picture, BTC is not oversold and may still have some downside room until the panic price movement crop up. Anyway, $8400 is a very critical price level. Once broken, the bear will definitely push the price down close to 8000. Low volatility indicates the ongoing choppy move may soon come to an end.

ETH short term correction, long term Bullish !Before ETH could launch of, first a small correction and we are good to go !

Q4 Bitcoin analysis, weekly chart forcast from line break chartSimple and to the point.
1.Currently we are sitting within the $8000 range
2. 20 day moving average of $8120 is acting as strong resistance
3. Bearish sentiment has set in on the MACD and RSI
4. As of right now Next level of support is looking to be $7850
5. Failure to hold $7850 could see a further decline to the 50 day moving average of $5700
6. Possibly within the next 3 to 6 weeks another selloff will occur.
7. Based on current trend, I'm looking for a buy in around February or March of 2020


BTCUSD November breakout, beginning of halving bullrun.Based on current sideways trading momentum I'm looking for Bitcoin to breakout sometime around end of October beginning of November. Around that time look for a bounce off the 200 day


Alt sesaon coming soon ??Altcoins are not performing well since the pump and dump taking place in bitcoin. Everyone is waiting for all season to come and expecting to give more profit than 2017 Bull run.
However, most of the altcoins are dead or broke their all-time low. As per the chart, still, it can take about a month to decide if we will see alt seasons again.
Wait till the candle crosses above 21MA which gives us confirmation about the Boom in Altcoins.


Possible AUD/USD Short position!!SMP TRADING
SELF DEVELOPMENT/METHODOLOGY/PSYCHOLOGY
Chart time frame - H4
Timeframe - 1-4 Days
Actions on -
A – Activating Event
Market will meet resistance in zone @ 0.7046 - .... and fall to the 0.692 . In order to enter, the pair MUST be in line with my Entry Procedure....
B – Beliefs
Market move towards the first Target 1 level @ 0.692
FX:AUDUSD
Trade Management
Entered @ .....
Stop Loss @ .....
Target 1 @ 0.692
Target 2 @ ....
Risk/Reward @ 3.5.1
Happy trading :)
Follow your Trading plan, remain disciplined and keep learning !!
Please Follow, Like,Comment & Follow
This information is not a recommendation to buy or sell. It is to be used for educational purposes only!


BTC OUTLOOKLots of signs to say we will head down over the next week or two.
IMO this is a healthy move for BTC to make its way down to 5800-6800 area before starting its next run up.
Enjoy


