Bullish bounce off 50% Fibonacci support?USD/JPY is falling towards the pivot and could bounce to the pullback resistance.
Pivot: 141.82
1st Support: 140.15
1st Resistance: 144.52
Risk Warning:
Trading Forex and CFDs carries a high level of risk to your capital and you should only trade with money you can afford to lose. Trading Forex and CFDs may not be suitable for all investors, so please ensure that you fully understand the risks involved and seek independent advice if necessary.
Disclaimer:
The above opinions given constitute general market commentary, and do not constitute the opinion or advice of IC Markets or any form of personal or investment advice.
Any opinions, news, research, analyses, prices, other information, or links to third-party sites contained on this website are provided on an "as-is" basis, are intended only to be informative, is not an advice nor a recommendation, nor research, or a record of our trading prices, or an offer of, or solicitation for a transaction in any financial instrument and thus should not be treated as such. The information provided does not involve any specific investment objectives, financial situation and needs of any specific person who may receive it. Please be aware, that past performance is not a reliable indicator of future performance and/or results. Past Performance or Forward-looking scenarios based upon the reasonable beliefs of the third-party provider are not a guarantee of future performance. Actual results may differ materially from those anticipated in forward-looking or past performance statements. IC Markets makes no representation or warranty and assumes no liability as to the accuracy or completeness of the information provided, nor any loss arising from any investment based on a recommendation, forecast or any information supplied by any third-party.
Forexsignals

Falling towards pullback support?The Kiwi (NZD/USD) is falling towards the pivot which has been identified as a pullback support and could bounce to the 1st resistance.
Pivot: 0.5887
1st Support: 0.5828
1st Resistance: 0.6019
Risk Warning:
Trading Forex and CFDs carries a high level of risk to your capital and you should only trade with money you can afford to lose. Trading Forex and CFDs may not be suitable for all investors, so please ensure that you fully understand the risks involved and seek independent advice if necessary.
Disclaimer:
The above opinions given constitute general market commentary, and do not constitute the opinion or advice of IC Markets or any form of personal or investment advice.
Any opinions, news, research, analyses, prices, other information, or links to third-party sites contained on this website are provided on an "as-is" basis, are intended only to be informative, is not an advice nor a recommendation, nor research, or a record of our trading prices, or an offer of, or solicitation for a transaction in any financial instrument and thus should not be treated as such. The information provided does not involve any specific investment objectives, financial situation and needs of any specific person who may receive it. Please be aware, that past performance is not a reliable indicator of future performance and/or results. Past Performance or Forward-looking scenarios based upon the reasonable beliefs of the third-party provider are not a guarantee of future performance. Actual results may differ materially from those anticipated in forward-looking or past performance statements. IC Markets makes no representation or warranty and assumes no liability as to the accuracy or completeness of the information provided, nor any loss arising from any investment based on a recommendation, forecast or any information supplied by any third-party.

USOILUSOIL price is near the support zone 62.10-60.89. If the price cannot break through 60.89, it is expected that in the short term there is a chance that the price will rebound. Consider buying in the red zone.
🔥Trading futures, forex, CFDs and stocks carries a risk of loss.
Please consider carefully whether such trading is suitable for you.
>>GooD Luck 😊
❤️ Like and subscribe to never miss a new idea!

Bullish bounce?EUR/GBP is falling towards the pivot and could bounce to the 1st resistance.
Pivot: 0.8526
1st Support: 0.8447
1st Resistance: 0.8615
Risk Warning:
Trading Forex and CFDs carries a high level of risk to your capital and you should only trade with money you can afford to lose. Trading Forex and CFDs may not be suitable for all investors, so please ensure that you fully understand the risks involved and seek independent advice if necessary.
Disclaimer:
The above opinions given constitute general market commentary, and do not constitute the opinion or advice of IC Markets or any form of personal or investment advice.
Any opinions, news, research, analyses, prices, other information, or links to third-party sites contained on this website are provided on an "as-is" basis, are intended only to be informative, is not an advice nor a recommendation, nor research, or a record of our trading prices, or an offer of, or solicitation for a transaction in any financial instrument and thus should not be treated as such. The information provided does not involve any specific investment objectives, financial situation and needs of any specific person who may receive it. Please be aware, that past performance is not a reliable indicator of future performance and/or results. Past Performance or Forward-looking scenarios based upon the reasonable beliefs of the third-party provider are not a guarantee of future performance. Actual results may differ materially from those anticipated in forward-looking or past performance statements. IC Markets makes no representation or warranty and assumes no liability as to the accuracy or completeness of the information provided, nor any loss arising from any investment based on a recommendation, forecast or any information supplied by any third-party.

Bearish reversal off pullback resistance?USD/CHF is rising towards the resistance level which is a pullback resistance that lines up with the 38.2% and the 61.8% Fibonacci retracement and could reverse from this level to our take profit.
Entry: 0.8364
Why we like it:
There is a pullback resistance level that lines up with the 38.2% and the 61.8% Fibonacci retracement.
Stop loss: 0.8511
Why we like it:
There is a pullback resistance level that is slightly below the 61.8% Fibonacci retracement.
Take profit: 0.8212
Why we like it:
There is a pullback support level.
Enjoying your TradingView experience? Review us!
Please be advised that the information presented on TradingView is provided to Vantage (‘Vantage Global Limited’, ‘we’) by a third-party provider (‘Everest Fortune Group’). Please be reminded that you are solely responsible for the trading decisions on your account. There is a very high degree of risk involved in trading. Any information and/or content is intended entirely for research, educational and informational purposes only and does not constitute investment or consultation advice or investment strategy. The information is not tailored to the investment needs of any specific person and therefore does not involve a consideration of any of the investment objectives, financial situation or needs of any viewer that may receive it. Kindly also note that past performance is not a reliable indicator of future results. Actual results may differ materially from those anticipated in forward-looking or past performance statements. We assume no liability as to the accuracy or completeness of any of the information and/or content provided herein and the Company cannot be held responsible for any omission, mistake nor for any loss or damage including without limitation to any loss of profit which may arise from reliance on any information supplied by Everest Fortune Group.

Potential bullish rise?USD/CAD has reacted off the resistance level which is an overlap resistance and could rise from this level to our take profit.
Entry: 1.3844
Why we like it:
There is an overlap resistance level.
Stop loss: 1.3781
Why we like it:
There is a pullback support level.
Take profit: 1.4029
Why we like it:
There is a pullback resistance level that lines up with the 50% Fibonacci retracement.
Enjoying your TradingView experience? Review us!
Please be advised that the information presented on TradingView is provided to Vantage (‘Vantage Global Limited’, ‘we’) by a third-party provider (‘Everest Fortune Group’). Please be reminded that you are solely responsible for the trading decisions on your account. There is a very high degree of risk involved in trading. Any information and/or content is intended entirely for research, educational and informational purposes only and does not constitute investment or consultation advice or investment strategy. The information is not tailored to the investment needs of any specific person and therefore does not involve a consideration of any of the investment objectives, financial situation or needs of any viewer that may receive it. Kindly also note that past performance is not a reliable indicator of future results. Actual results may differ materially from those anticipated in forward-looking or past performance statements. We assume no liability as to the accuracy or completeness of any of the information and/or content provided herein and the Company cannot be held responsible for any omission, mistake nor for any loss or damage including without limitation to any loss of profit which may arise from reliance on any information supplied by Everest Fortune Group.

Falling towards overlap support?GBP/USD is falling towards the support level which is an overlap support and could bounce from this level to our take profit.
Entry: 1.3203
Why we like it:
There is an overlap support level.
Stop loss: 1.3056
Why we like it:
There is a pullback support level that lines up with the 50% Fibonacci retracement.
Take profit: 1.3412
Why we like it:
There is a pullback resistance level.
Enjoying your TradingView experience? Review us!
Please be advised that the information presented on TradingView is provided to Vantage (‘Vantage Global Limited’, ‘we’) by a third-party provider (‘Everest Fortune Group’). Please be reminded that you are solely responsible for the trading decisions on your account. There is a very high degree of risk involved in trading. Any information and/or content is intended entirely for research, educational and informational purposes only and does not constitute investment or consultation advice or investment strategy. The information is not tailored to the investment needs of any specific person and therefore does not involve a consideration of any of the investment objectives, financial situation or needs of any viewer that may receive it. Kindly also note that past performance is not a reliable indicator of future results. Actual results may differ materially from those anticipated in forward-looking or past performance statements. We assume no liability as to the accuracy or completeness of any of the information and/or content provided herein and the Company cannot be held responsible for any omission, mistake nor for any loss or damage including without limitation to any loss of profit which may arise from reliance on any information supplied by Everest Fortune Group.

Bullish bounce?EUR/USD is falling towards the support level which is a pullback support that is slightly below the 38.2% Fibonacci retracement and could bounce from this level to our take profit.
Entry: 1.1278
Why we like it:
There is a pullback support level that is slightly below the 38.2% Fibonacci retracement.
Stop loss: 1.1149
Why we like it:
There is a pullback support level that aligns with the 61.8% Fibonacci retracement.
Take profit: 1.1428
Why we like it:
There is a pullback resistance level.
Enjoying your TradingView experience? Review us!
Please be advised that the information presented on TradingView is provided to Vantage (‘Vantage Global Limited’, ‘we’) by a third-party provider (‘Everest Fortune Group’). Please be reminded that you are solely responsible for the trading decisions on your account. There is a very high degree of risk involved in trading. Any information and/or content is intended entirely for research, educational and informational purposes only and does not constitute investment or consultation advice or investment strategy. The information is not tailored to the investment needs of any specific person and therefore does not involve a consideration of any of the investment objectives, financial situation or needs of any viewer that may receive it. Kindly also note that past performance is not a reliable indicator of future results. Actual results may differ materially from those anticipated in forward-looking or past performance statements. We assume no liability as to the accuracy or completeness of any of the information and/or content provided herein and the Company cannot be held responsible for any omission, mistake nor for any loss or damage including without limitation to any loss of profit which may arise from reliance on any information supplied by Everest Fortune Group.

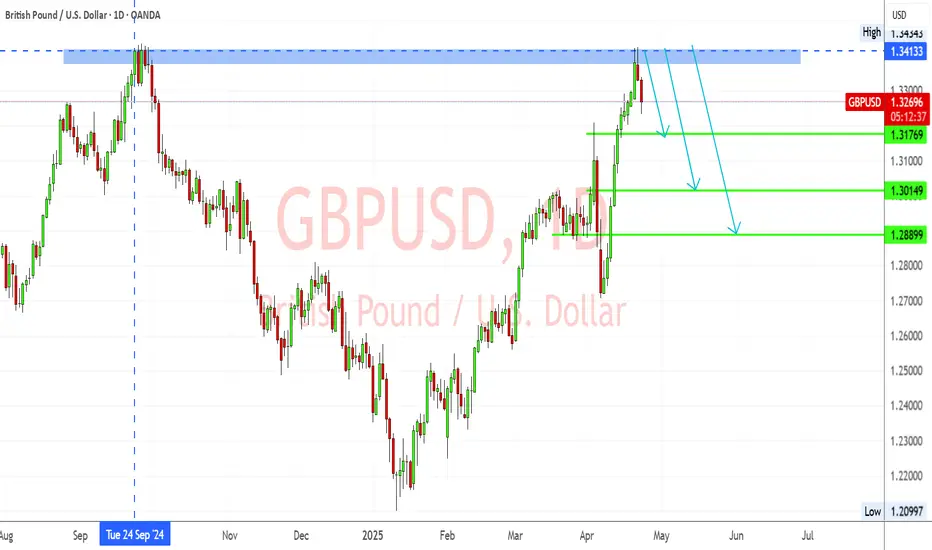
GBPUSD – Rejected at Multi-Month Resistance Amid Weak UK DataGBPUSD has clearly rejected the 1.3413–1.3443 resistance zone—a key area that previously acted as strong supply in September 2024. The pair has formed a bearish rejection candle and is now showing signs of downward momentum.
Key Levels:
Resistance: 1.3413 – 1.3443 (major rejection zone)
TP1: 1.3176 (minor structure)
TP2: 1.3014 (key demand zone)
TP3: 1.2890 (deeper support target)
Bearish Confluences:
Price rejected from major resistance
Bearish candle formation
Previous similar reaction from the same level
Momentum indicators favor downside
📰 Fundamental Analysis:
🔻 UK Data Weakens Further:
According to the latest S&P Global Flash UK PMI (Apr 23):
Composite Output Index: 48.2 (vs 51.5 in March) – 29-month low
Services PMI: 48.9 – 27-month low
Manufacturing PMI: 44.0 – 20-month low
This shows UK private sector activity contracting, led by a steep fall in new export orders, the worst since May 2020.
🔺 Inflation Still High:
Despite falling activity, input and output prices surged, driven by National Insurance hikes and wage growth. This makes it harder for the BoE to justify a cut, despite recession signs.
📌 Conclusion:
The bearish rejection at 1.3413 resistance, combined with deteriorating UK fundamentals, suggests a strong downside setup for GBPUSD. A break below 1.3176 would confirm the bearish move, targeting 1.3014 and potentially 1.2890.
XAU/USD - H1 Time Frame Trade Plan 23-04-2024⚙️ Gold (XAU/USD) – H1 Time Frame Trade Plan
🧭 Current Market Bias (H1)
Check if price is above or below 50 EMA and 200 EMA
Above both = bullish bias
Below both = bearish bias
Between = range / indecision
✅ Bullish Trade Setup (Buy the Dip)
Entry Zone: $2,340 – $2,350 (recent demand zone)
Entry Signal: Bullish engulfing / hammer / RSI bounce from 40
Stop Loss: $2,325 (below recent swing low)
Take Profit 1: $2,370
Take Profit 2: $2,390
Risk:Reward: At least 1:2
❌ Bearish Trade Setup (Sell the Rally)
Entry Zone: $2,390 – $2,400 (strong resistance)
Entry Signal: Bearish engulfing / shooting star / RSI rejection from 70
Stop Loss: $2,415 (above previous swing high)
Take Profit 1: $2,360
Take Profit 2: $2,340
📌 Extra Tips
Use MACD crossovers or RSI divergence for confirmation.
Avoid entering during high-impact news (e.g., FOMC, CPI, NFP).
Consider partial closes and trailing stops if price action moves in your favor.

XAU/USD Short Setup | M15 Trend Reversal OpportunityGold (XAU/USD) M15 timeframe par bearish signals show kar raha hai. Price ne key resistance zone reject kiya hai aur lower highs bana raha hai — possible short opportunity.
Trade idea includes:
Resistance rejection
Bearish candlestick pattern
Volume confirmation
Tight stop loss & clear TP levels
Disclaimer: Educational purpose only. Always manage your risk and use proper risk-reward ratio.

NZDCHF - Important Breakout !Hello Traders !
The NZDCHF failed to create a new lower low !
The price broke the resistance level (0.48828 - 0.48553).
This key level becomes new support !
So, I expect a bullish move🚀
______________
TARGET: 0.49420🎯

XAU/USD: New ATH ~ $3500, What's Next? (READ THE CAPTION)Upon reviewing the 15-minute gold chart, we can see that the price once again reached a new high today, rallying up to the key psychological level of $3500. Following this move, gold has experienced a pullback down to $3423 so far. If the price stabilizes below $3442, we will likely see a further correction toward the next target at $3411. (This analysis will be updated)
Please support me with your likes and comments to motivate me to share more analysis with you and share your opinion about the possible trend of this chart with me !
Best Regards , Arman Shaban

Bullish bounce?EUR/USD has bounced off the support level, an overlap support, and could rise from this level to the upside.

Eur/Usd Apr/23 Elliott wave AnalysisHello eveyone...
IMO 5th wave compelted...so i'm looking for Corrective Waves

AUD/USD is Bullish: More Gains AheadFenzoFx—The AUD/USD pair rebounded from the $0.6363 support level, aided by the 50-period simple moving average, and is currently trading near $0.6413.
Resistance stands at $0.6444. A close above this level may extend the bullish move toward $0.6940 and $0.7200.
Bearish Scenario : A drop below $0.6363 would invalidate the bullish outlook, potentially triggering a decline toward $0.6322.

Hellena | BITCOIN (4H): LONG to resistance level of 90,000.Colleagues, after drawing the waves I realized that bitcoin is in a major wave “IV” correction and I believe that this correction is either over or about to be over.
Either way I believe that long positions should be prioritized.
I expect that the price will either immediately start an upward movement and reach the psychological resistance level of 90,000, or will update the low in the area of 75,866 a little more and then start moving towards the target.
In the second case, I advise using pending limit orders.
Manage your capital correctly and competently! Only enter trades based on reliable patterns!

USDCAD: Breakout & Bearish Continuation 🇺🇸🇨🇦
USDCAD broke and closed below a key intraday/daily horizontal support cluster.
I expect a bearish trend continuation after its retest.
Next goal - 1.376
❤️Please, support my work with like, thank you!❤️
I am part of Trade Nation's Influencer program and receive a monthly fee for using their TradingView charts in my analysis.

US30 | 1H | BUYHey There;
SIGNAL ALERT
BUY US30 / 38,689,19
🟢TP1: 39,258,56
🟢TP2: 39,910,75
🟢TP3: 41,287,59
🔴SL: 37,415,50
RR / 2,00
Please don't forget to like 🙏🏻
Thanks to everyone who supports my analysis with likes. 💙💙💙

GER40 | 4H | SWING TRADING | BULL Hey there my friend
SIGNAL ALERT
BUY GER40 - 20,783,0 / 20,281,0
🟢TP1: 21,000,0
🟢TP2: 21,500,0
🟢TP3: 22,950,0
🔴SL: 19,298,5
RR - 20,797,0 - 1,50 / 20,281,0 - 2,97
Please don't forget to like 🙏🏻

Potential bullish rise?GBP/CHF has reacted off the pivot which is a pullback resistance and could rise tot he 1st resistance which is a pullback resistance.
Pivot: 1.0889
1st Support: 1.0784
1st Resistance: 1.1094
Risk Warning:
Trading Forex and CFDs carries a high level of risk to your capital and you should only trade with money you can afford to lose. Trading Forex and CFDs may not be suitable for all investors, so please ensure that you fully understand the risks involved and seek independent advice if necessary.
Disclaimer:
The above opinions given constitute general market commentary, and do not constitute the opinion or advice of IC Markets or any form of personal or investment advice.
Any opinions, news, research, analyses, prices, other information, or links to third-party sites contained on this website are provided on an "as-is" basis, are intended only to be informative, is not an advice nor a recommendation, nor research, or a record of our trading prices, or an offer of, or solicitation for a transaction in any financial instrument and thus should not be treated as such. The information provided does not involve any specific investment objectives, financial situation and needs of any specific person who may receive it. Please be aware, that past performance is not a reliable indicator of future performance and/or results. Past Performance or Forward-looking scenarios based upon the reasonable beliefs of the third-party provider are not a guarantee of future performance. Actual results may differ materially from those anticipated in forward-looking or past performance statements. IC Markets makes no representation or warranty and assumes no liability as to the accuracy or completeness of the information provided, nor any loss arising from any investment based on a recommendation, forecast or any information supplied by any third-party.

Bearish drop off pullback resistance?EUR/AUD has rejected off the pivot and could drop to the 1st support that lines up with the 138.2% Fibonacci extension.
Pivot: 1.79761
1st Support: 1.74140
1st Resistance: 1.80920
Risk Warning:
Trading Forex and CFDs carries a high level of risk to your capital and you should only trade with money you can afford to lose. Trading Forex and CFDs may not be suitable for all investors, so please ensure that you fully understand the risks involved and seek independent advice if necessary.
Disclaimer:
The above opinions given constitute general market commentary, and do not constitute the opinion or advice of IC Markets or any form of personal or investment advice.
Any opinions, news, research, analyses, prices, other information, or links to third-party sites contained on this website are provided on an "as-is" basis, are intended only to be informative, is not an advice nor a recommendation, nor research, or a record of our trading prices, or an offer of, or solicitation for a transaction in any financial instrument and thus should not be treated as such. The information provided does not involve any specific investment objectives, financial situation and needs of any specific person who may receive it. Please be aware, that past performance is not a reliable indicator of future performance and/or results. Past Performance or Forward-looking scenarios based upon the reasonable beliefs of the third-party provider are not a guarantee of future performance. Actual results may differ materially from those anticipated in forward-looking or past performance statements. IC Markets makes no representation or warranty and assumes no liability as to the accuracy or completeness of the information provided, nor any loss arising from any investment based on a recommendation, forecast or any information supplied by any third-party.

EURUSDEURUSD price has a chance to test the 1.14550 and 1.15419 levels. If the price cannot break through the 1.15419 resistance zone, it is expected that the price has a chance to go down. Consider selling the red zone.
🔥Trading futures, forex, CFDs and stocks carries a risk of loss.
Please consider carefully whether such trading is suitable for you.
>>GooD Luck 😊
❤️ Like and subscribe to never miss a new idea!
