Bullish bounce?AUD/JPY has bounced of the pivot and could potentialy rise to the 1st resistance.
Pivot: 92.28
1st Support: 92.68
1st Resistance: 94.19
Risk Warning:
Trading Forex and CFDs carries a high level of risk to your capital and you should only trade with money you can afford to lose. Trading Forex and CFDs may not be suitable for all investors, so please ensure that you fully understand the risks involved and seek independent advice if necessary.
Disclaimer:
The above opinions given constitute general market commentary, and do not constitute the opinion or advice of IC Markets or any form of personal or investment advice.
Any opinions, news, research, analyses, prices, other information, or links to third-party sites contained on this website are provided on an "as-is" basis, are intended only to be informative, is not an advice nor a recommendation, nor research, or a record of our trading prices, or an offer of, or solicitation for a transaction in any financial instrument and thus should not be treated as such. The information provided does not involve any specific investment objectives, financial situation and needs of any specific person who may receive it. Please be aware, that past performance is not a reliable indicator of future performance and/or results. Past Performance or Forward-looking scenarios based upon the reasonable beliefs of the third-party provider are not a guarantee of future performance. Actual results may differ materially from those anticipated in forward-looking or past performance statements. IC Markets makes no representation or warranty and assumes no liability as to the accuracy or completeness of the information provided, nor any loss arising from any investment based on a recommendation, forecast or any information supplied by any third-party.
Forexsignals

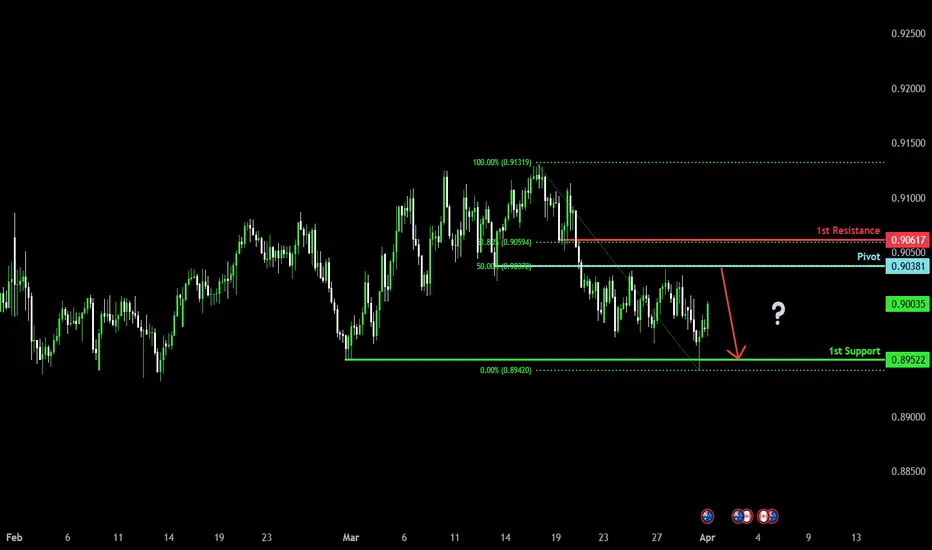
Bearish reversal?AUD/CAD is rising towards pivot and could reverse to the 1st support.
Pivot: 0.90381
1st Support: 0.89522
1st Resistance: 0.90617
Risk Warning:
Trading Forex and CFDs carries a high level of risk to your capital and you should only trade with money you can afford to lose. Trading Forex and CFDs may not be suitable for all investors, so please ensure that you fully understand the risks involved and seek independent advice if necessary.
Disclaimer:
The above opinions given constitute general market commentary, and do not constitute the opinion or advice of IC Markets or any form of personal or investment advice.
Any opinions, news, research, analyses, prices, other information, or links to third-party sites contained on this website are provided on an "as-is" basis, are intended only to be informative, is not an advice nor a recommendation, nor research, or a record of our trading prices, or an offer of, or solicitation for a transaction in any financial instrument and thus should not be treated as such. The information provided does not involve any specific investment objectives, financial situation and needs of any specific person who may receive it. Please be aware, that past performance is not a reliable indicator of future performance and/or results. Past Performance or Forward-looking scenarios based upon the reasonable beliefs of the third-party provider are not a guarantee of future performance. Actual results may differ materially from those anticipated in forward-looking or past performance statements. IC Markets makes no representation or warranty and assumes no liability as to the accuracy or completeness of the information provided, nor any loss arising from any investment based on a recommendation, forecast or any information supplied by any third-party.
Potential Bearish Drop?USD/JPY is reacting off the pivot whichis a pullback resistance and could drop from this level to he downside.

Potential bullish bounce?NZD/USD is reacting off the support level which is a pullback support and could bounce from this level to our take profit.
Entry: 0.5665
Why we like it:
There is a pullback support level that lines up with the 78.6% Fibonacci projection.
Stop loss: 0.5634
Why we like it:
There is a pullback support level that line sup with the 78.6% Fibonacci retracement.
Take profit: 0.5710
Why we like it:
There is a pullback resistance level that lines up with the 50% Fibonacci retracement.
Enjoying your TradingView experience? Review us!
Please be advised that the information presented on TradingView is provided to Vantage (‘Vantage Global Limited’, ‘we’) by a third-party provider (‘Everest Fortune Group’). Please be reminded that you are solely responsible for the trading decisions on your account. There is a very high degree of risk involved in trading. Any information and/or content is intended entirely for research, educational and informational purposes only and does not constitute investment or consultation advice or investment strategy. The information is not tailored to the investment needs of any specific person and therefore does not involve a consideration of any of the investment objectives, financial situation or needs of any viewer that may receive it. Kindly also note that past performance is not a reliable indicator of future results. Actual results may differ materially from those anticipated in forward-looking or past performance statements. We assume no liability as to the accuracy or completeness of any of the information and/or content provided herein and the Company cannot be held responsible for any omission, mistake nor for any loss or damage including without limitation to any loss of profit which may arise from reliance on any information supplied by Everest Fortune Group.

Heading into pullback resistance?AUD/USD is rising towards the resistance level which is a pullback resistance that aligns with the 50% Fibonacci retracement and could reverse from this level to our take profit.
Entry: 0.6276
Why we like it:
There is a pullback resistance level that aligns with the 50% Fibonacci retracement.
Stop loss: 0.6321
Why we like it:
There is an overlap resistance that line sup with the 61.8% Fibonacci retracement.
Take profit: 0.6214
Why we like it:
There is a pullback support level.
Enjoying your TradingView experience? Review us!
Please be advised that the information presented on TradingView is provided to Vantage (‘Vantage Global Limited’, ‘we’) by a third-party provider (‘Everest Fortune Group’). Please be reminded that you are solely responsible for the trading decisions on your account. There is a very high degree of risk involved in trading. Any information and/or content is intended entirely for research, educational and informational purposes only and does not constitute investment or consultation advice or investment strategy. The information is not tailored to the investment needs of any specific person and therefore does not involve a consideration of any of the investment objectives, financial situation or needs of any viewer that may receive it. Kindly also note that past performance is not a reliable indicator of future results. Actual results may differ materially from those anticipated in forward-looking or past performance statements. We assume no liability as to the accuracy or completeness of any of the information and/or content provided herein and the Company cannot be held responsible for any omission, mistake nor for any loss or damage including without limitation to any loss of profit which may arise from reliance on any information supplied by Everest Fortune Group.

Eurusd signal On Monday, EUR/USD remains rangebound around 1.0800, as risk-averse sentiment keeps the US Dollar buoyant amid ongoing tariff concerns, while investors remain wary ahead of "liberation day"
- Support Zones: Initial support comes from the 200-day SMA at 1.0730. Below that, watch the 55-day SMA at 1.0561, the 100-day SMA at 1.0519, and the February 28 low at 1.0359. Further weakness could expose the weekly low of 1.0282 (February 10) and the 2025 bottom of 1.0176 (January 13).

Bullish bounce?EUR/USD is falling towards the support level which is a pullback support that lines up with the 78.6% Fibonacci retracement and could bounce from this level to our take profit.
Entry: 1.0765
Why we like it:
There is a pullback support level that line sup with the 78.6% Fibonacci retracement.
Stop loss: 1.0732
Why we like it:
There is a pullback support level.
Take profit: 1.0836
Why we like it:
There is an overlap resistance level.
Enjoying your TradingView experience? Review us!
Please be advised that the information presented on TradingView is provided to Vantage (‘Vantage Global Limited’, ‘we’) by a third-party provider (‘Everest Fortune Group’). Please be reminded that you are solely responsible for the trading decisions on your account. There is a very high degree of risk involved in trading. Any information and/or content is intended entirely for research, educational and informational purposes only and does not constitute investment or consultation advice or investment strategy. The information is not tailored to the investment needs of any specific person and therefore does not involve a consideration of any of the investment objectives, financial situation or needs of any viewer that may receive it. Kindly also note that past performance is not a reliable indicator of future results. Actual results may differ materially from those anticipated in forward-looking or past performance statements. We assume no liability as to the accuracy or completeness of any of the information and/or content provided herein and the Company cannot be held responsible for any omission, mistake nor for any loss or damage including without limitation to any loss of profit which may arise from reliance on any information supplied by Everest Fortune Group.

Could the price reverse from here?USD/JPY is rising towards the resistance level which is a pullback resistance that lines up with the 71% Fibonacci retracement and could drop from this level to our take profit.
Entry: 150.40
Why we like it:
There is a pullback resistance level that lines up with the 71% Fibonacci retracement.
Stop loss: 150.89
Why we like it:
There is a pullback resistance that lines up with the 88.6% Fibonacci retracement.
Take profit: 149.62
Why we like it:
There is a pullback support level.
Enjoying your TradingView experience? Review us!
Please be advised that the information presented on TradingView is provided to Vantage (‘Vantage Global Limited’, ‘we’) by a third-party provider (‘Everest Fortune Group’). Please be reminded that you are solely responsible for the trading decisions on your account. There is a very high degree of risk involved in trading. Any information and/or content is intended entirely for research, educational and informational purposes only and does not constitute investment or consultation advice or investment strategy. The information is not tailored to the investment needs of any specific person and therefore does not involve a consideration of any of the investment objectives, financial situation or needs of any viewer that may receive it. Kindly also note that past performance is not a reliable indicator of future results. Actual results may differ materially from those anticipated in forward-looking or past performance statements. We assume no liability as to the accuracy or completeness of any of the information and/or content provided herein and the Company cannot be held responsible for any omission, mistake nor for any loss or damage including without limitation to any loss of profit which may arise from reliance on any information supplied by Everest Fortune Group.

GBP/JPYHello friends
Due to the price correction, the support area has now been identified, so you can buy in steps with capital management.
The target has also been identified.
*Trade safely with us*

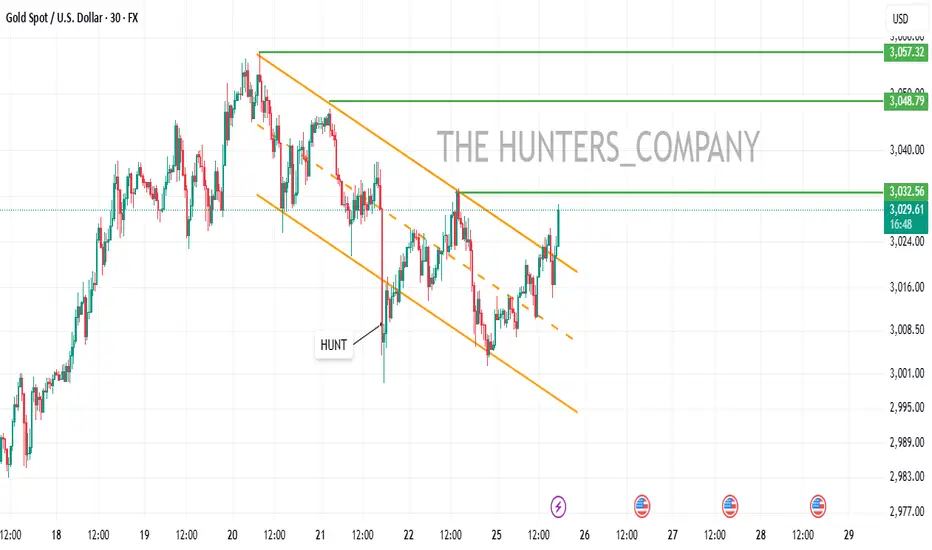
GOLD BUYHello friends
Due to the channel breakdown, the price is expected to move to the specified targets. Be sure to follow capital management.
*Trade safely with us*
XAUUSDHello Traders! 👋
What are your thoughts on GOLD?
Gold remains in a strong uptrend, and the first target is expected to be around $3200. At this level, due to a resistance zone, a temporary correction is likely.
This correction may extend down to the bottom of the ascending channel, which acts as a key support area. After completing the pullback, the bullish trend is expected to resume, aiming for the top of the channel as the next target.
If price breaks above the channel, higher targets could be activated.
Don’t forget to like and share your thoughts in the comments! ❤️

USDCAD: Price Action & Swing Analysis
The analysis of the USDCAD chart clearly shows us that the pair is finally about to tank due to the rising pressure from the sellers.
Disclosure: I am part of Trade Nation's Influencer program and receive a monthly fee for using their TradingView charts in my analysis.
❤️ Please, support our work with like & comment! ❤️

USDCHF BUY BIASWe have a buy bias on this pair we have seen liquidity taken and we expect further push the upside with more opportunities to scale up this pair.

MarketBreakdown | EURUSD, GBPUSD, USDJPY, AUDUSD
Here are the updates & outlook for multiple instruments in my watch list.
1️⃣ #EURUSD daily time frame 🇪🇺🇺🇸
For the last 2 weeks, EURUSD shows a strong bearish momentum.
The price managed to break and close below a key daily support cluster.
A strong bearish reaction that followed after its retest confirms a strong
selling pressure.
I think that the pair has a potential to drop lower this week.
2️⃣ #GBPUSD daily time frame 🇬🇧🇺🇸
In comparison to EURUSD, GBPUSD looks very stable.
The pair is consolidating within quite a wide range on a daily.
For now, probabilities are high that sideways movement will continue.
Consider trading the upper and lower boundary of the underlined channel.
Alternatively, a breakout of one of the underlined structures will give you a strong
bullish/breaish signal.
3️⃣ #USDJPY daily time frame 🇺🇸🇯🇵
Looks like the market is returning to a mid-term bearish trend.
The price is currently breaking a support line of a bearish flag pattern.
A daily candle close below its support will provide a strong bearish confirmation.
4️⃣ #AUDUSD daily time frame 🇦🇺🇺🇸
I see a completed head & shoulders pattern on a daily.
The price is currently breaking its neckline.
A daily candle close below that will provide a strong bearish confirmation
and suggest a highly probable bearish continuation.
Do you agree with my market breakdown?
❤️Please, support my work with like, thank you!❤️
I am part of Trade Nation's Influencer program and receive a monthly fee for using their TradingView charts in my analysis.

EURUSD 4H Bearish Cross starting the peak formation.The EURUSD pair posted a strong rebound last week, which is along the lines of our long-term bearish structure estimate, similar to the September 2024 Top.
The 4H MA50/100 Bearish Cross that was formed on Thursday, simply confirms that the pattern goes according to plan as on September 06 2024, the price got rejected after its completion and then rebounded to test Resistance 1 before the ultimate market peak.
We still expect a similar development, with our ultimate long-term Target being 1.03650, just above Support 1.
-------------------------------------------------------------------------------
** Please LIKE 👍, FOLLOW ✅, SHARE 🙌 and COMMENT ✍ if you enjoy this idea! Also share your ideas and charts in the comments section below! This is best way to keep it relevant, support us, keep the content here free and allow the idea to reach as many people as possible. **
-------------------------------------------------------------------------------
Disclosure: I am part of Trade Nation's Influencer program and receive a monthly fee for using their TradingView charts in my analysis.
💸💸💸💸💸💸
👇 👇 👇 👇 👇 👇

EUR/USD: Range-Bound with Bearish Potential Below ResistanceThe EUR/USD market recently completed an ABC pullback, briefly testing above Friday’s high, but price action remains contained within last week’s range, signaling a lack of clear trend direction.
If the price rejects the current resistance zone, a move lower is likely, possibly forming another ABC structure toward the 1.06000 support level. With the zone below 1.07700 already cleared—despite a prior false breakout—a retest of that area is possible. Unless the price manages a close above 1.08500, the pair is expected to drift toward last week’s low, with the next target at the support zone around 1.07610

CADCHF - Buy Setup at Key Support LevelOANDA:CADCHF is approaching a key support zone, marked by strong buying pressure. This area has historically served as a demand zone, suggesting the potential for a bullish reversal if buyers step in.
The current market structure indicates that if the price confirms a rejection from this support zone, there is a high probability of an upward move. I anticipate that if buyers defend this level, the market may head higher toward the 0.61900 target, which represents a logical target within the current market structure. However, a break below this support would invalidate the bullish bias and could lead to further declines.
If you have any thoughts on this setup or see an alternative perspective, feel free to comment!

NZDCHF: Bear Trap & Pullback From Support 🇳🇿🇨🇭
It looks like we have a bearish trap on NZDCHF after
a test of a key daily support.
The price went way below that but recovered steadily,
forming a double bottom pattern.
A formation of a bullish imbalance candle on an hourly
indicate a very likely bullish movement.
Goal - 0.5035
❤️Please, support my work with like, thank you!❤️
I am part of Trade Nation's Influencer program and receive a monthly fee for using their TradingView charts in my analysis.

NZDCAD Potential Bullish ReversalNZDCAD price seems to exhibit signs of a potential Bullish Reversal on the shorter timeframes if the price action forms a credible Higher High with multiple confluences from key Fibonacci and Support levels.
Trade Plan :
Entry @ 0.822500
Stop Loss @ 0.81600
TP 0.9 - 1 @ 0.82830 - 0.82890

Bullish bounce?EUR/NOK is reacting off the pivot which has been idetified as a pullback support and a bounce from this level could indicate a double bottom pattern which might lead to a potential price rise to the 1st resistance.
Pivot: 11.28684
1st Support: 11.18417
1st Resistance: 11.18417
Risk Warning:
Trading Forex and CFDs carries a high level of risk to your capital and you should only trade with money you can afford to lose. Trading Forex and CFDs may not be suitable for all investors, so please ensure that you fully understand the risks involved and seek independent advice if necessary.
Disclaimer:
The above opinions given constitute general market commentary, and do not constitute the opinion or advice of IC Markets or any form of personal or investment advice.
Any opinions, news, research, analyses, prices, other information, or links to third-party sites contained on this website are provided on an "as-is" basis, are intended only to be informative, is not an advice nor a recommendation, nor research, or a record of our trading prices, or an offer of, or solicitation for a transaction in any financial instrument and thus should not be treated as such. The information provided does not involve any specific investment objectives, financial situation and needs of any specific person who may receive it. Please be aware, that past performance is not a reliable indicator of future performance and/or results. Past Performance or Forward-looking scenarios based upon the reasonable beliefs of the third-party provider are not a guarantee of future performance. Actual results may differ materially from those anticipated in forward-looking or past performance statements. IC Markets makes no representation or warranty and assumes no liability as to the accuracy or completeness of the information provided, nor any loss arising from any investment based on a recommendation, forecast or any information supplied by any third-party.

Potential bearish drop?CAD/JPY gas rejected off the pivot which is a pullback resistance and could drop to the 1st support/
Pivot: 105.18
1st Support: 101.71
1st Resistance: 107.74
Risk Warning:
Trading Forex and CFDs carries a high level of risk to your capital and you should only trade with money you can afford to lose. Trading Forex and CFDs may not be suitable for all investors, so please ensure that you fully understand the risks involved and seek independent advice if necessary.
Disclaimer:
The above opinions given constitute general market commentary, and do not constitute the opinion or advice of IC Markets or any form of personal or investment advice.
Any opinions, news, research, analyses, prices, other information, or links to third-party sites contained on this website are provided on an "as-is" basis, are intended only to be informative, is not an advice nor a recommendation, nor research, or a record of our trading prices, or an offer of, or solicitation for a transaction in any financial instrument and thus should not be treated as such. The information provided does not involve any specific investment objectives, financial situation and needs of any specific person who may receive it. Please be aware, that past performance is not a reliable indicator of future performance and/or results. Past Performance or Forward-looking scenarios based upon the reasonable beliefs of the third-party provider are not a guarantee of future performance. Actual results may differ materially from those anticipated in forward-looking or past performance statements. IC Markets makes no representation or warranty and assumes no liability as to the accuracy or completeness of the information provided, nor any loss arising from any investment based on a recommendation, forecast or any information supplied by any third-party.

Bearish drop off pullback resistnce?CAD/CHF has rejected off the pivot and could drop to the 1st support.
Pivot: 0.61954
1st Support: 0.60758
1st Resistance: 0.62626
Risk Warning:
Trading Forex and CFDs carries a high level of risk to your capital and you should only trade with money you can afford to lose. Trading Forex and CFDs may not be suitable for all investors, so please ensure that you fully understand the risks involved and seek independent advice if necessary.
Disclaimer:
The above opinions given constitute general market commentary, and do not constitute the opinion or advice of IC Markets or any form of personal or investment advice.
Any opinions, news, research, analyses, prices, other information, or links to third-party sites contained on this website are provided on an "as-is" basis, are intended only to be informative, is not an advice nor a recommendation, nor research, or a record of our trading prices, or an offer of, or solicitation for a transaction in any financial instrument and thus should not be treated as such. The information provided does not involve any specific investment objectives, financial situation and needs of any specific person who may receive it. Please be aware, that past performance is not a reliable indicator of future performance and/or results. Past Performance or Forward-looking scenarios based upon the reasonable beliefs of the third-party provider are not a guarantee of future performance. Actual results may differ materially from those anticipated in forward-looking or past performance statements. IC Markets makes no representation or warranty and assumes no liability as to the accuracy or completeness of the information provided, nor any loss arising from any investment based on a recommendation, forecast or any information supplied by any third-party.

Bearish drop?NZD/CAD has reacted of the pivot and could drop to the 1st support.
Pivot: 0.8201
1st Support: 0.8078
1st Resistance: 0.8309
Risk Warning:
Trading Forex and CFDs carries a high level of risk to your capital and you should only trade with money you can afford to lose. Trading Forex and CFDs may not be suitable for all investors, so please ensure that you fully understand the risks involved and seek independent advice if necessary.
Disclaimer:
The above opinions given constitute general market commentary, and do not constitute the opinion or advice of IC Markets or any form of personal or investment advice.
Any opinions, news, research, analyses, prices, other information, or links to third-party sites contained on this website are provided on an "as-is" basis, are intended only to be informative, is not an advice nor a recommendation, nor research, or a record of our trading prices, or an offer of, or solicitation for a transaction in any financial instrument and thus should not be treated as such. The information provided does not involve any specific investment objectives, financial situation and needs of any specific person who may receive it. Please be aware, that past performance is not a reliable indicator of future performance and/or results. Past Performance or Forward-looking scenarios based upon the reasonable beliefs of the third-party provider are not a guarantee of future performance. Actual results may differ materially from those anticipated in forward-looking or past performance statements. IC Markets makes no representation or warranty and assumes no liability as to the accuracy or completeness of the information provided, nor any loss arising from any investment based on a recommendation, forecast or any information supplied by any third-party.
