Bullish bounce?USD/JPY is falling towards the support level which is an overlap support that aligns with the 127.2% Fibonacci extension and the 71% Fibonacci retracement and could bounce from this level to our take profit.
Entry: 147.31
Why we like it:
There is an overlap support level that aligns with the 127.2% Fibonacci extension and the 71% Fibonacci retracement.
Stop loss: 146.54
Why we like it:
There is a pullback support level.
Take profit: 148.14
Why we like it:
There is a pullback resistance level.
Enjoying your TradingView experience? Review us!
Please be advised that the information presented on TradingView is provided to Vantage (‘Vantage Global Limited’, ‘we’) by a third-party provider (‘Everest Fortune Group’). Please be reminded that you are solely responsible for the trading decisions on your account. There is a very high degree of risk involved in trading. Any information and/or content is intended entirely for research, educational and informational purposes only and does not constitute investment or consultation advice or investment strategy. The information is not tailored to the investment needs of any specific person and therefore does not involve a consideration of any of the investment objectives, financial situation or needs of any viewer that may receive it. Kindly also note that past performance is not a reliable indicator of future results. Actual results may differ materially from those anticipated in forward-looking or past performance statements. We assume no liability as to the accuracy or completeness of any of the information and/or content provided herein and the Company cannot be held responsible for any omission, mistake nor for any loss or damage including without limitation to any loss of profit which may arise from reliance on any information supplied by Everest Fortune Group.
Forexsignals

Bearish reversal?EUR/USD is rising towards the resistance level which is an overlap resistance that aligns with the 50% Fibonacci retracement and could drop from this level to our take profit.
Entry: 1.0887
Why we like it:
There is an overlap resistance level that aligns with the 50% Fibonacci retracement.
Stop loss: 1.0947
Why we like it:
There is a pullback resistance level.
Take profit: 1.0809
Why we like it:
There is a pullback support level.
Enjoying your TradingView experience? Review us!
Please be advised that the information presented on TradingView is provided to Vantage (‘Vantage Global Limited’, ‘we’) by a third-party provider (‘Everest Fortune Group’). Please be reminded that you are solely responsible for the trading decisions on your account. There is a very high degree of risk involved in trading. Any information and/or content is intended entirely for research, educational and informational purposes only and does not constitute investment or consultation advice or investment strategy. The information is not tailored to the investment needs of any specific person and therefore does not involve a consideration of any of the investment objectives, financial situation or needs of any viewer that may receive it. Kindly also note that past performance is not a reliable indicator of future results. Actual results may differ materially from those anticipated in forward-looking or past performance statements. We assume no liability as to the accuracy or completeness of any of the information and/or content provided herein and the Company cannot be held responsible for any omission, mistake nor for any loss or damage including without limitation to any loss of profit which may arise from reliance on any information supplied by Everest Fortune Group.

XAUUSDGold price has retested the resistance zone 2946-2954 again. If the price cannot break through the 2954 level, it is expected that the price will drop. Consider selling in the red zone.
(Very Risky Trade)
🔥Trading futures, forex, CFDs and stocks carries a risk of loss.
Please consider carefully whether such trading is suitable for you.
>>GooD Luck 😊
❤️ Like and subscribe to never miss a new idea!

#AUDNZD 1DAYAUDNZD (1D Timeframe) Analysis
Market Structure:
The price has recently broken down from a triangle pattern, indicating a potential shift in market sentiment towards the downside. The breakdown suggests that selling pressure has overtaken buying interest, leading to a bearish bias.
Forecast:
A sell opportunity is anticipated following the triangle breakdown. If the price retests the broken support level as resistance and confirms rejection, further downside movement is likely.
Key Levels to Watch:
- Entry Zone: Consider entering a sell position after a retest and rejection of the broken triangle support.
- Risk Management:
- Stop Loss: Placed above the retest level or recent swing high.
- Take Profit: Target nearby support levels for potential profit.
Market Sentiment:
The breakdown of the triangle pattern highlights bearish sentiment, with potential for continued downward movement. Waiting for confirmation on a retest can improve trade reliability.

#GBPUSD 4HGBPUSD (4H Timeframe) Analysis
Market Structure:
The price is currently trading near a key resistance area, where previous selling pressure has been observed. This level has historically acted as a barrier, rejecting upward movements and leading to price declines.
Forecast:
A sell opportunity is anticipated from the resistance area if the price shows signs of rejection, such as bearish candlestick patterns or a decrease in buying momentum.
Key Levels to Watch:
- Entry Zone: Consider entering a sell position if the price fails to break above the resistance and confirms rejection.
- Risk Management:
- Stop Loss: Placed above the resistance area or recent swing high to manage risk.
- Take Profit: Target nearby support levels for potential downside movement.
Market Sentiment:
The resistance area is a critical zone to monitor for potential price reversal. Confirmation through bearish signals is recommended before executing a trade.

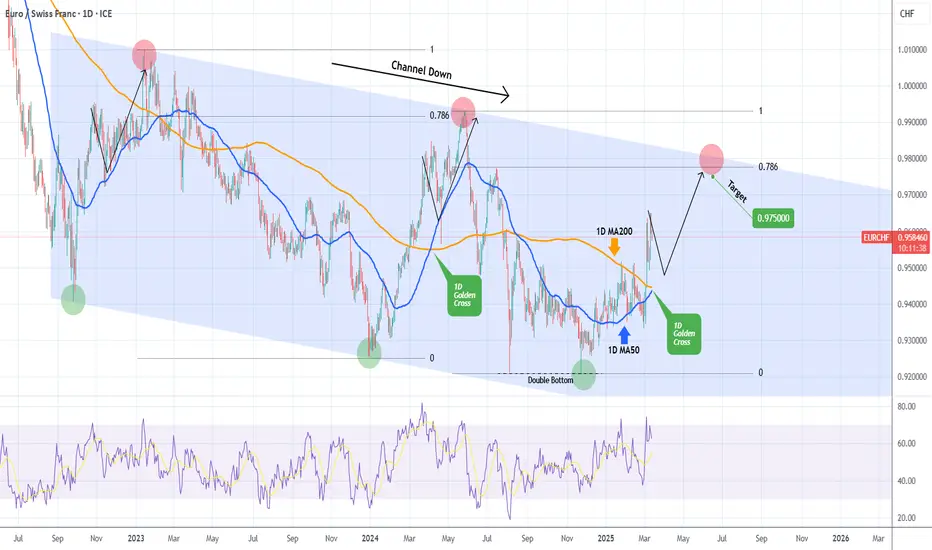
EURCHF 1D Golden Cross for one final push.The EURCHF pair has been trading within a 2.5-year Channel Down pattern and is currently on the latest Bullish Leg that is about to complete a 1D Golden Cross. The last Golden Cross was also during the previous Bullish Leg and caused an initial pull-back that was followed by the pricing of the Channel's Top on the 0.786 Fibonacci level.
As a result, be ready to buy on the next 1D MA50 (blue trend-line) contact and target 0.97500 (just below the 0.786 Fib).
-------------------------------------------------------------------------------
** Please LIKE 👍, FOLLOW ✅, SHARE 🙌 and COMMENT ✍ if you enjoy this idea! Also share your ideas and charts in the comments section below! This is best way to keep it relevant, support us, keep the content here free and allow the idea to reach as many people as possible. **
-------------------------------------------------------------------------------
💸💸💸💸💸💸
👇 👇 👇 👇 👇 👇
#CHFJPY 4HCHFJPY (4H Timeframe) Analysis
Market Structure:
The price has successfully broken out of the downtrend resistance line, indicating a potential shift in market sentiment from bearish to bullish. This breakout suggests that buyers are gaining strength and may push the price higher.
Forecast:
A buy opportunity is anticipated following the breakout. It is advisable to watch for a potential retest of the broken resistance line, which could now act as support, for additional confirmation.
Key Levels to Watch:
- Entry Zone: Consider buying after a confirmed breakout and potential retest of the previous resistance turned support.
- Risk Management:
- Stop Loss: Placed below the retest level or recent swing low to manage risk.
- Take Profit: Target the next key resistance levels for potential upside gains.
Market Sentiment:
The breakout from the downtrend resistance signals bullish sentiment. Confirmation through price action or candlestick patterns will strengthen the probability of an upward move.

CADCHF; Heikin Ashi Trade IdeaOANDA:CADCHF
In this video, I’ll be sharing my analysis of CADCHF, using my unique Heikin Ashi strategy. I’ll walk you through the reasoning behind my trade setup and highlight key areas where I’m anticipating potential opportunities.
I’m always happy to receive any feedback.
Like, share and comment! ❤️
Thank you for watching my videos! 🙏

GBPNZD Bullish Continuation - Will Buyers Push Toward 2.28000?OANDA:GBPNZD is trading within a well-defined ascending channel, with price action consistently respecting both the upper and lower boundaries. The recent bullish impulse suggests that buyers are maintaining control, indicating a potential continuation toward the upper boundary.
The price has recently broken above a key resistance zone and may come back for a retest. If this level holds as support, it would reinforce the bullish structure and increase the likelihood of a move toward 2.28000, which aligns with the channel’s upper boundary.
As long as the price remains above this support zone, the bullish outlook remains valid. However, a failure to hold the support zone would invalidate the bullish scenario and open the possibility for a deeper pullback toward the channel’s lower boundary.
Remember, always confirm your setups and trade with solid risk management.
Best of luck!

Ceylon Wall Street GBPJPY Trade setup 2025.03.11 / 2.36 PMWait for price pullback resistance Zone.
If price stabilizes and shows bearish momentum around 191.800 - 192.000
Stop-Loss: Above 192.200
Take-Profit: Near 191.200 - 191.100 (next support)

Bullish bounce?GBP/JPY is reacting off the pivot which acts as an overlap support and could rise to the 1st resistance.
Pivot: 191.22
1st Support: 190.49
1st Resistance: 192.46
Risk Warning:
Trading Forex and CFDs carries a high level of risk to your capital and you should only trade with money you can afford to lose. Trading Forex and CFDs may not be suitable for all investors, so please ensure that you fully understand the risks involved and seek independent advice if necessary.
Disclaimer:
The above opinions given constitute general market commentary, and do not constitute the opinion or advice of IC Markets or any form of personal or investment advice.
Any opinions, news, research, analyses, prices, other information, or links to third-party sites contained on this website are provided on an "as-is" basis, are intended only to be informative, is not an advice nor a recommendation, nor research, or a record of our trading prices, or an offer of, or solicitation for a transaction in any financial instrument and thus should not be treated as such. The information provided does not involve any specific investment objectives, financial situation and needs of any specific person who may receive it. Please be aware, that past performance is not a reliable indicator of future performance and/or results. Past Performance or Forward-looking scenarios based upon the reasonable beliefs of the third-party provider are not a guarantee of future performance. Actual results may differ materially from those anticipated in forward-looking or past performance statements. IC Markets makes no representation or warranty and assumes no liability as to the accuracy or completeness of the information provided, nor any loss arising from any investment based on a recommendation, forecast or any information supplied by any third-party.

Hellena | GOLD (4H): LONG to resistance area at 2955 (Wave 3).As in the last forecast - I insist that the five-wave movement is not over yet. Therefore, I believe that the price will reach at least the resistance area at 2955.837.
The correction wave “2” is either already completed or will be completed soon.
Manage your capital correctly and competently! Only enter trades based on reliable patterns!

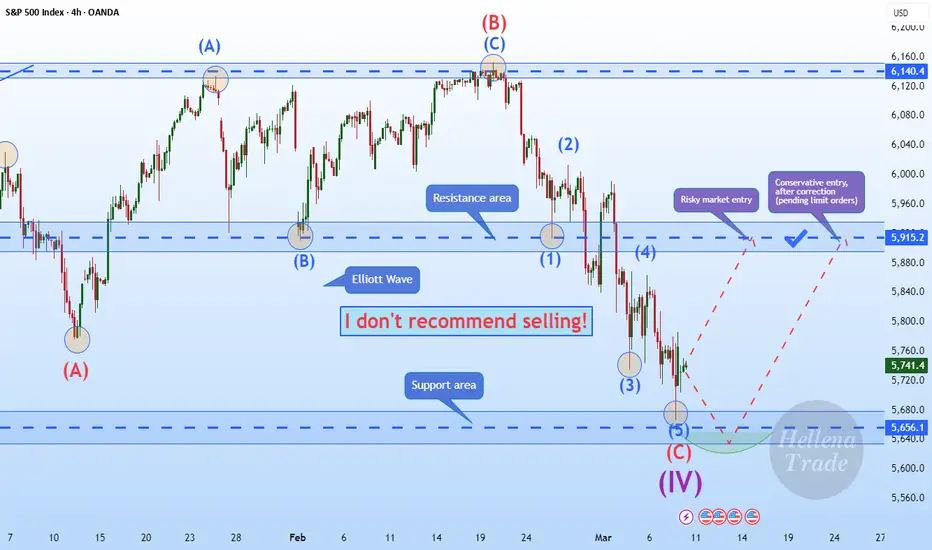
Hellena | SPX500 (4H): LONG to resistance area of 5915.Colleagues, I was waiting for the price to reach the support area of 5656, because the big corrective wave “IV” should end soon.
I am still looking for a long entry point. I expect that wave “IV” has either ended or will soon end its downward movement in the 5656 area and we will see the beginning of an upward wave.
I expect that the first target is the resistance area of 5915.
Manage your capital correctly and competently! Only enter trades based on reliable patterns!
Bullish momentum to extend?GBP/CAD is falling towards the pivot and could bounce tot he 1st resistance which is a pullback resistance.
Pivot: 1.8515
1st Support: 1.8403
1st Resistance: 1.8751
Risk Warning:
Trading Forex and CFDs carries a high level of risk to your capital and you should only trade with money you can afford to lose. Trading Forex and CFDs may not be suitable for all investors, so please ensure that you fully understand the risks involved and seek independent advice if necessary.
Disclaimer:
The above opinions given constitute general market commentary, and do not constitute the opinion or advice of IC Markets or any form of personal or investment advice.
Any opinions, news, research, analyses, prices, other information, or links to third-party sites contained on this website are provided on an "as-is" basis, are intended only to be informative, is not an advice nor a recommendation, nor research, or a record of our trading prices, or an offer of, or solicitation for a transaction in any financial instrument and thus should not be treated as such. The information provided does not involve any specific investment objectives, financial situation and needs of any specific person who may receive it. Please be aware, that past performance is not a reliable indicator of future performance and/or results. Past Performance or Forward-looking scenarios based upon the reasonable beliefs of the third-party provider are not a guarantee of future performance. Actual results may differ materially from those anticipated in forward-looking or past performance statements. IC Markets makes no representation or warranty and assumes no liability as to the accuracy or completeness of the information provided, nor any loss arising from any investment based on a recommendation, forecast or any information supplied by any third-party.

Bullish bounce off overlap support?EUR/GBP is falling towards the support which has been identified as an overlap support and could bounce tot he 1st resistance which is a pullback resistance.
Pivot: 0.8387
1st Support: 0.8355
1st Resistance: 0.8452
Risk Warning:
Trading Forex and CFDs carries a high level of risk to your capital and you should only trade with money you can afford to lose. Trading Forex and CFDs may not be suitable for all investors, so please ensure that you fully understand the risks involved and seek independent advice if necessary.
Disclaimer:
The above opinions given constitute general market commentary, and do not constitute the opinion or advice of IC Markets or any form of personal or investment advice.
Any opinions, news, research, analyses, prices, other information, or links to third-party sites contained on this website are provided on an "as-is" basis, are intended only to be informative, is not an advice nor a recommendation, nor research, or a record of our trading prices, or an offer of, or solicitation for a transaction in any financial instrument and thus should not be treated as such. The information provided does not involve any specific investment objectives, financial situation and needs of any specific person who may receive it. Please be aware, that past performance is not a reliable indicator of future performance and/or results. Past Performance or Forward-looking scenarios based upon the reasonable beliefs of the third-party provider are not a guarantee of future performance. Actual results may differ materially from those anticipated in forward-looking or past performance statements. IC Markets makes no representation or warranty and assumes no liability as to the accuracy or completeness of the information provided, nor any loss arising from any investment based on a recommendation, forecast or any information supplied by any third-party.

Could the price bounce from here?CAD/JPY is falling towards the pivot and could bounce to the overlap resistance.
Pivot: 102.38
1st Support: 101.36
1st Resistance: 104.86
Risk Warning:
Trading Forex and CFDs carries a high level of risk to your capital and you should only trade with money you can afford to lose. Trading Forex and CFDs may not be suitable for all investors, so please ensure that you fully understand the risks involved and seek independent advice if necessary.
Disclaimer:
The above opinions given constitute general market commentary, and do not constitute the opinion or advice of IC Markets or any form of personal or investment advice.
Any opinions, news, research, analyses, prices, other information, or links to third-party sites contained on this website are provided on an "as-is" basis, are intended only to be informative, is not an advice nor a recommendation, nor research, or a record of our trading prices, or an offer of, or solicitation for a transaction in any financial instrument and thus should not be treated as such. The information provided does not involve any specific investment objectives, financial situation and needs of any specific person who may receive it. Please be aware, that past performance is not a reliable indicator of future performance and/or results. Past Performance or Forward-looking scenarios based upon the reasonable beliefs of the third-party provider are not a guarantee of future performance. Actual results may differ materially from those anticipated in forward-looking or past performance statements. IC Markets makes no representation or warranty and assumes no liability as to the accuracy or completeness of the information provided, nor any loss arising from any investment based on a recommendation, forecast or any information supplied by any third-party.

Heading into 61.8% Fibonacci resistance?CAD/CHF is rising towards the pivot which is a pullback resistance and could reverse to the 1st support.
Pivot: 0.61595
1st Support: 0.60808
1st Resistance: 0.62223
Risk Warning:
Trading Forex and CFDs carries a high level of risk to your capital and you should only trade with money you can afford to lose. Trading Forex and CFDs may not be suitable for all investors, so please ensure that you fully understand the risks involved and seek independent advice if necessary.
Disclaimer:
The above opinions given constitute general market commentary, and do not constitute the opinion or advice of IC Markets or any form of personal or investment advice.
Any opinions, news, research, analyses, prices, other information, or links to third-party sites contained on this website are provided on an "as-is" basis, are intended only to be informative, is not an advice nor a recommendation, nor research, or a record of our trading prices, or an offer of, or solicitation for a transaction in any financial instrument and thus should not be treated as such. The information provided does not involve any specific investment objectives, financial situation and needs of any specific person who may receive it. Please be aware, that past performance is not a reliable indicator of future performance and/or results. Past Performance or Forward-looking scenarios based upon the reasonable beliefs of the third-party provider are not a guarantee of future performance. Actual results may differ materially from those anticipated in forward-looking or past performance statements. IC Markets makes no representation or warranty and assumes no liability as to the accuracy or completeness of the information provided, nor any loss arising from any investment based on a recommendation, forecast or any information supplied by any third-party.

Bullish bounce?AUD/CHF is falling towards the pivot and could bounce to the 1st resistance.
Pivot: 0.55517
1st Support: 0.55053
1st Resistance: 0.56177
Risk Warning:
Trading Forex and CFDs carries a high level of risk to your capital and you should only trade with money you can afford to lose. Trading Forex and CFDs may not be suitable for all investors, so please ensure that you fully understand the risks involved and seek independent advice if necessary.
Disclaimer:
The above opinions given constitute general market commentary, and do not constitute the opinion or advice of IC Markets or any form of personal or investment advice.
Any opinions, news, research, analyses, prices, other information, or links to third-party sites contained on this website are provided on an "as-is" basis, are intended only to be informative, is not an advice nor a recommendation, nor research, or a record of our trading prices, or an offer of, or solicitation for a transaction in any financial instrument and thus should not be treated as such. The information provided does not involve any specific investment objectives, financial situation and needs of any specific person who may receive it. Please be aware, that past performance is not a reliable indicator of future performance and/or results. Past Performance or Forward-looking scenarios based upon the reasonable beliefs of the third-party provider are not a guarantee of future performance. Actual results may differ materially from those anticipated in forward-looking or past performance statements. IC Markets makes no representation or warranty and assumes no liability as to the accuracy or completeness of the information provided, nor any loss arising from any investment based on a recommendation, forecast or any information supplied by any third-party.

Bearish drop?NZD/JPY has reacted off the pivot and could drop to the 1st support.
Pivot: 86.22
1st Support: 83.43
1st Resistance: 86.10
Risk Warning:
Trading Forex and CFDs carries a high level of risk to your capital and you should only trade with money you can afford to lose. Trading Forex and CFDs may not be suitable for all investors, so please ensure that you fully understand the risks involved and seek independent advice if necessary.
Disclaimer:
The above opinions given constitute general market commentary, and do not constitute the opinion or advice of IC Markets or any form of personal or investment advice.
Any opinions, news, research, analyses, prices, other information, or links to third-party sites contained on this website are provided on an "as-is" basis, are intended only to be informative, is not an advice nor a recommendation, nor research, or a record of our trading prices, or an offer of, or solicitation for a transaction in any financial instrument and thus should not be treated as such. The information provided does not involve any specific investment objectives, financial situation and needs of any specific person who may receive it. Please be aware, that past performance is not a reliable indicator of future performance and/or results. Past Performance or Forward-looking scenarios based upon the reasonable beliefs of the third-party provider are not a guarantee of future performance. Actual results may differ materially from those anticipated in forward-looking or past performance statements. IC Markets makes no representation or warranty and assumes no liability as to the accuracy or completeness of the information provided, nor any loss arising from any investment based on a recommendation, forecast or any information supplied by any third-party.

Usdjpy analysis This chart represents a technical analysis of USD/JPY on the 1-hour timeframe from TradingView, outlining potential price movements based on key support and resistance levels.
Support Level: Marked around 147.175, this level is expected to act as a strong demand zone where buyers might step in if the price retraces.
Current Price: USD/JPY is trading around 148.262, showing signs of bullish momentum.
Potential Price Movement: The chart suggests a possible pullback toward the support level before resuming an uptrend.
First Target: Positioned at approximately 149.678, this is the next key resistance level where price action might encounter selling pressure.
Second Target: Identified near 151.002, indicating further bullish continuation if the first target is broken.
Outlook:
The analysis suggests a bullish bias, but a retracement to support may occur before a potential breakout. Traders may look for confirmation signals before entering positions. The volume profile on the right shows strong activity around these levels, reinforcing the importance of these key zones.

USOLI NEXT MOVE ounter-Analysis (Bearish Scenario Instead of Bullish)
Rejection at Resistance Instead of Breakout
The targets assume that price will move past resistance zones at $69-$71, but resistance could hold, causing a reversal.
If sellers step in near resistance, we could see another leg downward instead of a rally.
Support Failure Instead of Bounce
The chart suggests that crude oil will bounce from support (~$66.89), but if selling pressure increases, the price could break below support instead.
A break below $65.85 (strong support) could send USOIL toward lower levels ($64 or below).
Lower High Formation Instead of Uptrend
If oil fails to break above resistance and forms a lower high, it could indicate continued bearish momentum rather than a bullish reversal.
The previous downtrend might still be intact, with this current move just being a retracement before another drop.
Fundamental Risks
Macroeconomic factors like higher interest rates, reduced demand, or increased oil supply could prevent a bullish rally.
If economic data suggests slowing growth, oil prices could struggle to push higher.

Gold (XAU/USD) Key Resistance Test – Breakout or Reversal?hello traders
what are your thoughts on xauusd.
in my analysis the gold is at resistance level here we can assume possible reversal.
The chart highlights a strong resistance area around 2,928-2,930, where price previously reversed.
if the market does not revers than we assume new high targets indecating in the chart

Bullish bounce?USD/CAD is falling towards the support level which is a pullback support that is slightly above the 78.6% Fibonacci projection and could bounce from this level to our take profit.
Entry: 1.4299
Why we like it:
There is a pullback support level that is slightly above the 78.6% Fibonacci projection.
Stop loss: 1.4222
Why we like it:
There is a pullback support level.
Take profit: 1.4416
Why we like it:
There is a pullback resistance level.
Enjoying your TradingView experience? Review us!
Please be advised that the information presented on TradingView is provided to Vantage (‘Vantage Global Limited’, ‘we’) by a third-party provider (‘Everest Fortune Group’). Please be reminded that you are solely responsible for the trading decisions on your account. There is a very high degree of risk involved in trading. Any information and/or content is intended entirely for research, educational and informational purposes only and does not constitute investment or consultation advice or investment strategy. The information is not tailored to the investment needs of any specific person and therefore does not involve a consideration of any of the investment objectives, financial situation or needs of any viewer that may receive it. Kindly also note that past performance is not a reliable indicator of future results. Actual results may differ materially from those anticipated in forward-looking or past performance statements. We assume no liability as to the accuracy or completeness of any of the information and/or content provided herein and the Company cannot be held responsible for any omission, mistake nor for any loss or damage including without limitation to any loss of profit which may arise from reliance on any information supplied by Everest Fortune Group.
