GOLD UPWARD COMING SOON Gold (XAU/USD) shows the price currently trading within a defined range between the support level at 3272.581 and the resistance zone around 3367.926.
Technical Highlights:
- Support Level: Strong demand seen around 3272.581 where price has previously rebounded.
- Resistance Zone: 3367.926 marks a key supply area that has held several past tests.
- Current Structure: A bullish corrective move appears underway with the potential to test the target area at 3338.838, aligning with a minor resistance zone.
- Price Behavior: Recent rejection from the support zone indicates bullish pressure; if momentum holds, price is likely to challenge the next resistance.
Next Target: 3338.838
Outlook: If gold sustains above the mid-range support, bullish continuation toward 3338.838 is favored. However, price must break minor resistance cleanly for further upside confirmation.
Would you like a social media caption or short signal text for this as well?
Forexsignals

GBPJPY – Correction Could Offer a Good EntryA few days ago, I mentioned that GBPJPY could rise and test the 195.00 handle – and that idea still stands.
After pushing up to 191.75, the pair began to correct, which might be just what we needed: a chance to enter a long trade at better levels.
Is this correction a healthy pullback before resumption of the up move?
For now, it looks like a typical retracement within an uptrend (bullish flag).
The 190.00 zone, highlighted on the chart, is the ideal spot for long setups.
Why 190.00 is key:
- Strong horizontal support.
- Great risk-reward potential, with over 1:2 R:R possible.
- Price remains in bullish structure above 188.00.
Trading Plan:
Look for bullish confirmation around 190.00 – this zone could provide an excellent buying opportunity.
However, a break below 188.00 would invalidate the setup and call for caution.
Until then, buying the dip remains the plan.
Let the correction finish, and be ready to ride the next wave higher.
Disclosure: I am part of Trade Nation's Influencer program and receive a monthly fee for using their TradingView charts in my analyses and educational articles.

Bearish drop off overlap resistance?GBP/AUD has reacted off the pivot and could potentially drop to the 1st support.
Pivot: 2.1038
1st Support: 2.0639
1st Resistance: 2.1260
Risk Warning:
Trading Forex and CFDs carries a high level of risk to your capital and you should only trade with money you can afford to lose. Trading Forex and CFDs may not be suitable for all investors, so please ensure that you fully understand the risks involved and seek independent advice if necessary.
Disclaimer:
The above opinions given constitute general market commentary, and do not constitute the opinion or advice of IC Markets or any form of personal or investment advice.
Any opinions, news, research, analyses, prices, other information, or links to third-party sites contained on this website are provided on an "as-is" basis, are intended only to be informative, is not an advice nor a recommendation, nor research, or a record of our trading prices, or an offer of, or solicitation for a transaction in any financial instrument and thus should not be treated as such. The information provided does not involve any specific investment objectives, financial situation and needs of any specific person who may receive it. Please be aware, that past performance is not a reliable indicator of future performance and/or results. Past Performance or Forward-looking scenarios based upon the reasonable beliefs of the third-party provider are not a guarantee of future performance. Actual results may differ materially from those anticipated in forward-looking or past performance statements. IC Markets makes no representation or warranty and assumes no liability as to the accuracy or completeness of the information provided, nor any loss arising from any investment based on a recommendation, forecast or any information supplied by any third-party.

Bearish drop?The Silver (XAG/USD) has rejected off the pivot and could drop to the pullback support.
Pivot: 33.12
1st Support: 32.19
1st Resistance: 33.67
Risk Warning:
Trading Forex and CFDs carries a high level of risk to your capital and you should only trade with money you can afford to lose. Trading Forex and CFDs may not be suitable for all investors, so please ensure that you fully understand the risks involved and seek independent advice if necessary.
Disclaimer:
The above opinions given constitute general market commentary, and do not constitute the opinion or advice of IC Markets or any form of personal or investment advice.
Any opinions, news, research, analyses, prices, other information, or links to third-party sites contained on this website are provided on an "as-is" basis, are intended only to be informative, is not an advice nor a recommendation, nor research, or a record of our trading prices, or an offer of, or solicitation for a transaction in any financial instrument and thus should not be treated as such. The information provided does not involve any specific investment objectives, financial situation and needs of any specific person who may receive it. Please be aware, that past performance is not a reliable indicator of future performance and/or results. Past Performance or Forward-looking scenarios based upon the reasonable beliefs of the third-party provider are not a guarantee of future performance. Actual results may differ materially from those anticipated in forward-looking or past performance statements. IC Markets makes no representation or warranty and assumes no liability as to the accuracy or completeness of the information provided, nor any loss arising from any investment based on a recommendation, forecast or any information supplied by any third-party.

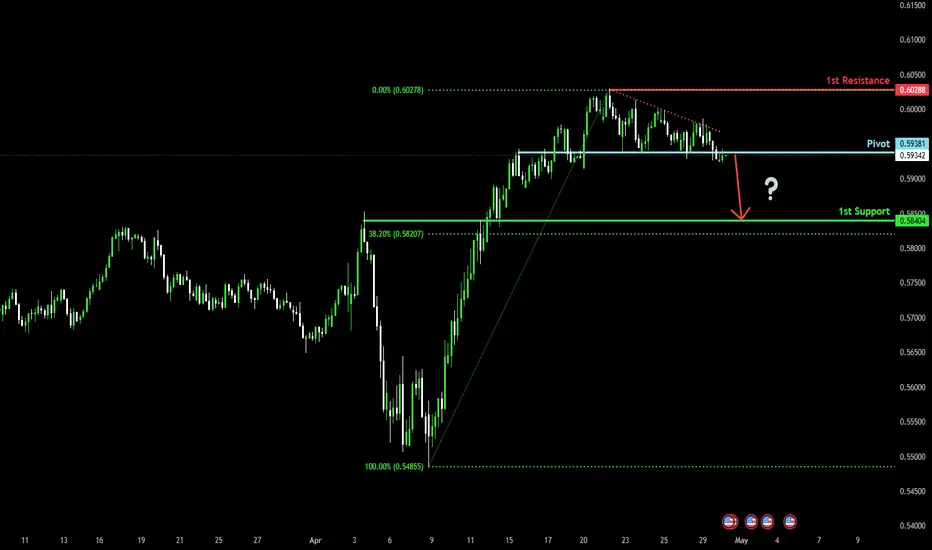
Potential bearish drop?The Kiwi (NZD/USD) is reacting off the pivot which is a pullback resistance and could drop to the 1st support which acts as a pullback support.
Pivot: 0.5938
1st Support: 0.5840
1st Resistance: 0.6028
Risk Warning:
Trading Forex and CFDs carries a high level of risk to your capital and you should only trade with money you can afford to lose. Trading Forex and CFDs may not be suitable for all investors, so please ensure that you fully understand the risks involved and seek independent advice if necessary.
Disclaimer:
The above opinions given constitute general market commentary, and do not constitute the opinion or advice of IC Markets or any form of personal or investment advice.
Any opinions, news, research, analyses, prices, other information, or links to third-party sites contained on this website are provided on an "as-is" basis, are intended only to be informative, is not an advice nor a recommendation, nor research, or a record of our trading prices, or an offer of, or solicitation for a transaction in any financial instrument and thus should not be treated as such. The information provided does not involve any specific investment objectives, financial situation and needs of any specific person who may receive it. Please be aware, that past performance is not a reliable indicator of future performance and/or results. Past Performance or Forward-looking scenarios based upon the reasonable beliefs of the third-party provider are not a guarantee of future performance. Actual results may differ materially from those anticipated in forward-looking or past performance statements. IC Markets makes no representation or warranty and assumes no liability as to the accuracy or completeness of the information provided, nor any loss arising from any investment based on a recommendation, forecast or any information supplied by any third-party.
Market Analysis: USD/CHF – 4H ChartThe USD/CHF pair is exhibiting a **clear bearish trend** on the 4-hour chart, with price currently consolidating around the **0.81500** level after a sharp decline. This consolidation is forming a **range-bound structure**, with support near the recent H4 low and resistance around the **0.82500** zone.
Key Observations:
Bearish momentum remains dominant, evidenced by lower highs and lower lows.
Price is currently trading just above a well-tested H4 support level.
There are two probable outcomes from this consolidation zone:
Potential Scenarios:
1. Bullish Breakout:
A rejection from the H4 support could see price push back towards the **0.82500** level.
A breakout beyond this resistance could lead to further recovery towards **0.83500** or higher.
2. **Bearish Continuation**:
A break below the H4 support zone would confirm further downside momentum.
This could lead price towards the next key support around **0.80000**, with potential extension to the **0.78500** region.
Conclusion:
USD/CHF is currently at a decision point within a broader bearish structure. Traders should watch for a breakout from the current range to confirm the next directional move, with **0.82500** and **0.80000** acting as critical inflection zones.

XAUUSD (Gold)As we can see from overall perspective that Gold is still very bullish.
From technical and fundamental angle, everything sustains a bullish trend.
This is an opportunity to join the bullish trend.

Bullish bounce off pullback support?USD/JPY is falling towards the pivot which is a pullback support and could rise to the 1st resistance.
Pivot: 141.63
1st Support: 141.00
1st Resistance: 142.75
Risk Warning:
Trading Forex and CFDs carries a high level of risk to your capital and you should only trade with money you can afford to lose. Trading Forex and CFDs may not be suitable for all investors, so please ensure that you fully understand the risks involved and seek independent advice if necessary.
Disclaimer:
The above opinions given constitute general market commentary, and do not constitute the opinion or advice of IC Markets or any form of personal or investment advice.
Any opinions, news, research, analyses, prices, other information, or links to third-party sites contained on this website are provided on an "as-is" basis, are intended only to be informative, is not an advice nor a recommendation, nor research, or a record of our trading prices, or an offer of, or solicitation for a transaction in any financial instrument and thus should not be treated as such. The information provided does not involve any specific investment objectives, financial situation and needs of any specific person who may receive it. Please be aware, that past performance is not a reliable indicator of future performance and/or results. Past Performance or Forward-looking scenarios based upon the reasonable beliefs of the third-party provider are not a guarantee of future performance. Actual results may differ materially from those anticipated in forward-looking or past performance statements. IC Markets makes no representation or warranty and assumes no liability as to the accuracy or completeness of the information provided, nor any loss arising from any investment based on a recommendation, forecast or any information supplied by any third-party.

Bullish bounce?The Cable (GBP/USD) is falling towards the pivot and could bounce to the 1st resistance.
Pivot: 1.3338
1st Support: 1.3276
1st Resistance: 1.3442
Risk Warning:
Trading Forex and CFDs carries a high level of risk to your capital and you should only trade with money you can afford to lose. Trading Forex and CFDs may not be suitable for all investors, so please ensure that you fully understand the risks involved and seek independent advice if necessary.
Disclaimer:
The above opinions given constitute general market commentary, and do not constitute the opinion or advice of IC Markets or any form of personal or investment advice.
Any opinions, news, research, analyses, prices, other information, or links to third-party sites contained on this website are provided on an "as-is" basis, are intended only to be informative, is not an advice nor a recommendation, nor research, or a record of our trading prices, or an offer of, or solicitation for a transaction in any financial instrument and thus should not be treated as such. The information provided does not involve any specific investment objectives, financial situation and needs of any specific person who may receive it. Please be aware, that past performance is not a reliable indicator of future performance and/or results. Past Performance or Forward-looking scenarios based upon the reasonable beliefs of the third-party provider are not a guarantee of future performance. Actual results may differ materially from those anticipated in forward-looking or past performance statements. IC Markets makes no representation or warranty and assumes no liability as to the accuracy or completeness of the information provided, nor any loss arising from any investment based on a recommendation, forecast or any information supplied by any third-party.

Gold Price in Key Compression Zone: Awaiting BreakoutThe 1-hour chart of XAU/USD (Gold Spot vs US Dollar) shows a clear symmetrical triangle formation, where the price has been compressing between a descending resistance zone (red) and a horizontal support zone (green). Here's a breakdown of the setup:
Support Zone (~3040–3080 USD):
This area has acted as a strong base multiple times, suggesting buyers are stepping in consistently at this level.
Resistance Trendline (~3310–3320 USD):
The price has repeatedly tested this descending resistance line but has failed to break above it so far.
EMA Indicators:
50 EMA (black line): Currently acting as dynamic resistance.
200 EMA (blue line): Price is hovering around it, indicating indecision.
Projected Breakout Scenarios:
Upside Breakout:
If price breaks above the resistance trendline, a sharp rally is projected towards the 3480–3520 USD zone. This move aligns with previous supply levels.
Downside Breakout:
If support fails, we could see a breakdown toward the 3040 USD region, with extended targets near 3080–3040 USD.
Current Bias:
The market is consolidating, and a breakout is imminent. Watch for volume and candle confirmation at either the resistance or support to determine the next major move.
================================================================
Disclosure:
I am a participant in TradeNation's Influencer Program and receive a monthly fee for utilising their TradingView charts in my market analysis.
=================================================================

Potential bearish drop?USD/CHF has reacted off the resistance level which is a pullback resistance that lines up with the 38.2% Fibonacci retracement and could drop from this level to our take profit.
Entry: 0.8253
Why we like it:
There is a pullback resistance level that lines up with the 38,2% Fibonacci retracement.
Stop loss: 0.8321
Why we like it:
There is a pullback resistance level.
Take profit: 0.8135
Why we like it:
There is a pullback support level that aligns with the 100% Fibonacci projection.
Enjoying your TradingView experience? Review us!
Please be advised that the information presented on TradingView is provided to Vantage (‘Vantage Global Limited’, ‘we’) by a third-party provider (‘Everest Fortune Group’). Please be reminded that you are solely responsible for the trading decisions on your account. There is a very high degree of risk involved in trading. Any information and/or content is intended entirely for research, educational and informational purposes only and does not constitute investment or consultation advice or investment strategy. The information is not tailored to the investment needs of any specific person and therefore does not involve a consideration of any of the investment objectives, financial situation or needs of any viewer that may receive it. Kindly also note that past performance is not a reliable indicator of future results. Actual results may differ materially from those anticipated in forward-looking or past performance statements. We assume no liability as to the accuracy or completeness of any of the information and/or content provided herein and the Company cannot be held responsible for any omission, mistake nor for any loss or damage including without limitation to any loss of profit which may arise from reliance on any information supplied by Everest Fortune Group.

Bearish drop?EUR/USD is reacting off the resistance level which is a pullback resistance that lines up with the 50% Fibonacci retracement and could drop from this level to our take profit.
Entry: 1.1427
Why we like it:
There is a pullback resistance level that lines up with the 50% Fibonacci retracement.
Stop loss: 1.1560
Why we like it:
There is a pullback resistance level.
Take profit: 1.1278
Why we like it:
There is a pullback support level.
Enjoying your TradingView experience? Review us!
Please be advised that the information presented on TradingView is provided to Vantage (‘Vantage Global Limited’, ‘we’) by a third-party provider (‘Everest Fortune Group’). Please be reminded that you are solely responsible for the trading decisions on your account. There is a very high degree of risk involved in trading. Any information and/or content is intended entirely for research, educational and informational purposes only and does not constitute investment or consultation advice or investment strategy. The information is not tailored to the investment needs of any specific person and therefore does not involve a consideration of any of the investment objectives, financial situation or needs of any viewer that may receive it. Kindly also note that past performance is not a reliable indicator of future results. Actual results may differ materially from those anticipated in forward-looking or past performance statements. We assume no liability as to the accuracy or completeness of any of the information and/or content provided herein and the Company cannot be held responsible for any omission, mistake nor for any loss or damage including without limitation to any loss of profit which may arise from reliance on any information supplied by Everest Fortune Group.

USD/JPY : Bull or Bear? Let's See! (READ THE CAPTION)Upon reviewing the USD/JPY chart on the daily timeframe, we observe that due to the sharp drop in the Dollar Index, the price has reached the 140.850 level. This decline was very strong and impulsive; however, as seen on the chart, the price has now approached a significant demand zone between 139.6 and 141. If the price manages to close and stabilize above this area, we can expect a further bullish move from this pair.
Please support me with your likes and comments to motivate me to share more analysis with you and share your opinion about the possible trend of this chart with me !
Best Regards , Arman Shaban

EUR/USD: Possible Fall Ahead? Let's See! (READ THE CAPTION)Upon reviewing the EUR/USD chart on the 3-day timeframe, we can see that following a sharp decline in the Dollar Index (DXY), the pair experienced a bullish move, reaching the 1.15 supply zone. If the price manages to stabilize and close below the 1.15–1.17 area, we can anticipate a further drop in EUR/USD to fill the created Liquidity Void (LV). This analysis will be updated accordingly.
Please support me with your likes and comments to motivate me to share more analysis with you and share your opinion about the possible trend of this chart with me !
Best Regards , Arman Shaban

GBPAUD / 1H / BULLHey There;
My GBPAUD target level is 2.10269
My target may come a bit late because this trade is a swing trade.
I would appreciate it very much if you do not miss your likes within the framework of Respect for Labor Thank you very much in advance

Bearish drop off pullback resistance?GBP/JPY has reacted off the pivot and could drop to the 38.2% Fibonacci support.
Pivot: 191.76
1st Support: 189.40
1st Resistance: 193.84
Risk Warning:
Trading Forex and CFDs carries a high level of risk to your capital and you should only trade with money you can afford to lose. Trading Forex and CFDs may not be suitable for all investors, so please ensure that you fully understand the risks involved and seek independent advice if necessary.
Disclaimer:
The above opinions given constitute general market commentary, and do not constitute the opinion or advice of IC Markets or any form of personal or investment advice.
Any opinions, news, research, analyses, prices, other information, or links to third-party sites contained on this website are provided on an "as-is" basis, are intended only to be informative, is not an advice nor a recommendation, nor research, or a record of our trading prices, or an offer of, or solicitation for a transaction in any financial instrument and thus should not be treated as such. The information provided does not involve any specific investment objectives, financial situation and needs of any specific person who may receive it. Please be aware, that past performance is not a reliable indicator of future performance and/or results. Past Performance or Forward-looking scenarios based upon the reasonable beliefs of the third-party provider are not a guarantee of future performance. Actual results may differ materially from those anticipated in forward-looking or past performance statements. IC Markets makes no representation or warranty and assumes no liability as to the accuracy or completeness of the information provided, nor any loss arising from any investment based on a recommendation, forecast or any information supplied by any third-party.

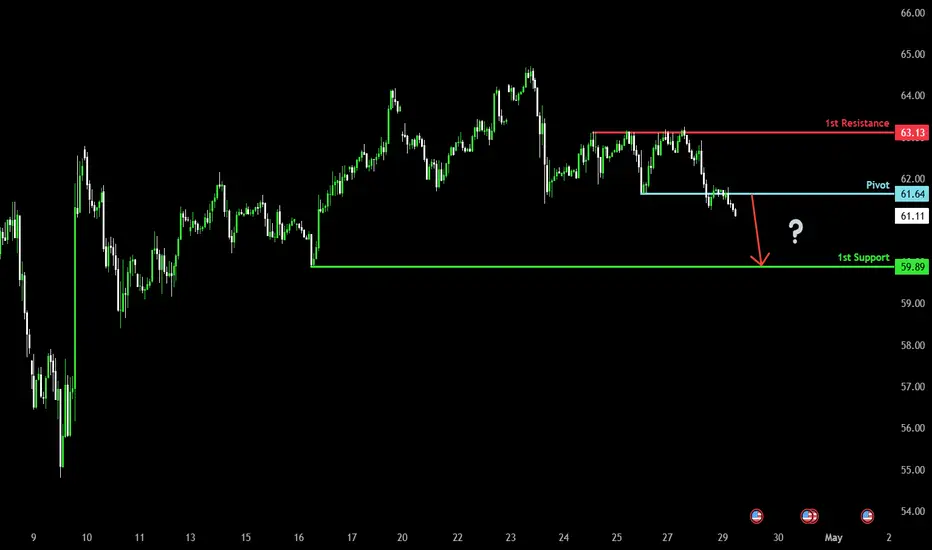
Bearish drop off pullback resistance?WTI Oil (XTI/USD) has rejected off the pivot which is a pullback resistance and could drop to the pullback support.
Pivot: 61.64
1st Support: 59.89
1st Resistance: 63.13
Risk Warning:
Trading Forex and CFDs carries a high level of risk to your capital and you should only trade with money you can afford to lose. Trading Forex and CFDs may not be suitable for all investors, so please ensure that you fully understand the risks involved and seek independent advice if necessary.
Disclaimer:
The above opinions given constitute general market commentary, and do not constitute the opinion or advice of IC Markets or any form of personal or investment advice.
Any opinions, news, research, analyses, prices, other information, or links to third-party sites contained on this website are provided on an "as-is" basis, are intended only to be informative, is not an advice nor a recommendation, nor research, or a record of our trading prices, or an offer of, or solicitation for a transaction in any financial instrument and thus should not be treated as such. The information provided does not involve any specific investment objectives, financial situation and needs of any specific person who may receive it. Please be aware, that past performance is not a reliable indicator of future performance and/or results. Past Performance or Forward-looking scenarios based upon the reasonable beliefs of the third-party provider are not a guarantee of future performance. Actual results may differ materially from those anticipated in forward-looking or past performance statements. IC Markets makes no representation or warranty and assumes no liability as to the accuracy or completeness of the information provided, nor any loss arising from any investment based on a recommendation, forecast or any information supplied by any third-party.
Bearish breakout?The Kiwi (NZD/USD) is falling towards the pivot, which acts as an overlap support. A breakout could lead the price to drop to the 1st support, which is also an overlap support.
Pivot: 0.5938
1st Support: 0.5840
1st Resistance: 0.6028
Risk Warning:
Trading Forex and CFDs carries a high level of risk to your capital and you should only trade with money you can afford to lose. Trading Forex and CFDs may not be suitable for all investors, so please ensure that you fully understand the risks involved and seek independent advice if necessary.
Disclaimer:
The above opinions given constitute general market commentary, and do not constitute the opinion or advice of IC Markets or any form of personal or investment advice.
Any opinions, news, research, analyses, prices, other information, or links to third-party sites contained on this website are provided on an "as-is" basis, are intended only to be informative, is not an advice nor a recommendation, nor research, or a record of our trading prices, or an offer of, or solicitation for a transaction in any financial instrument and thus should not be treated as such. The information provided does not involve any specific investment objectives, financial situation and needs of any specific person who may receive it. Please be aware, that past performance is not a reliable indicator of future performance and/or results. Past Performance or Forward-looking scenarios based upon the reasonable beliefs of the third-party provider are not a guarantee of future performance. Actual results may differ materially from those anticipated in forward-looking or past performance statements. IC Markets makes no representation or warranty and assumes no liability as to the accuracy or completeness of the information provided, nor any loss arising from any investment based on a recommendation, forecast or any information supplied by any third-party.

Bullish rise?The Aussie (AUD/USD0 has bounced off the pivot which is an overlap support and could rise to the 1st resistance that lines up with the 127.2% Fibonacci extension.
Pivot: 0.6361
1st Support: 0.6290
1st Resistance: 0.6536
Risk Warning:
Trading Forex and CFDs carries a high level of risk to your capital and you should only trade with money you can afford to lose. Trading Forex and CFDs may not be suitable for all investors, so please ensure that you fully understand the risks involved and seek independent advice if necessary.
Disclaimer:
The above opinions given constitute general market commentary, and do not constitute the opinion or advice of IC Markets or any form of personal or investment advice.
Any opinions, news, research, analyses, prices, other information, or links to third-party sites contained on this website are provided on an "as-is" basis, are intended only to be informative, is not an advice nor a recommendation, nor research, or a record of our trading prices, or an offer of, or solicitation for a transaction in any financial instrument and thus should not be treated as such. The information provided does not involve any specific investment objectives, financial situation and needs of any specific person who may receive it. Please be aware, that past performance is not a reliable indicator of future performance and/or results. Past Performance or Forward-looking scenarios based upon the reasonable beliefs of the third-party provider are not a guarantee of future performance. Actual results may differ materially from those anticipated in forward-looking or past performance statements. IC Markets makes no representation or warranty and assumes no liability as to the accuracy or completeness of the information provided, nor any loss arising from any investment based on a recommendation, forecast or any information supplied by any third-party.

Bullish bounce?The Swissie (USD/CHF) has bounced off the pivot and could rise to the 1st resistance.
Pivot: 0.8211
1st Support: 0.8114
1st Resistance: 0.8372
Risk Warning:
Trading Forex and CFDs carries a high level of risk to your capital and you should only trade with money you can afford to lose. Trading Forex and CFDs may not be suitable for all investors, so please ensure that you fully understand the risks involved and seek independent advice if necessary.
Disclaimer:
The above opinions given constitute general market commentary, and do not constitute the opinion or advice of IC Markets or any form of personal or investment advice.
Any opinions, news, research, analyses, prices, other information, or links to third-party sites contained on this website are provided on an "as-is" basis, are intended only to be informative, is not an advice nor a recommendation, nor research, or a record of our trading prices, or an offer of, or solicitation for a transaction in any financial instrument and thus should not be treated as such. The information provided does not involve any specific investment objectives, financial situation and needs of any specific person who may receive it. Please be aware, that past performance is not a reliable indicator of future performance and/or results. Past Performance or Forward-looking scenarios based upon the reasonable beliefs of the third-party provider are not a guarantee of future performance. Actual results may differ materially from those anticipated in forward-looking or past performance statements. IC Markets makes no representation or warranty and assumes no liability as to the accuracy or completeness of the information provided, nor any loss arising from any investment based on a recommendation, forecast or any information supplied by any third-party.

Potential bearish drop?The Fiber (EUR/USD) is reacting off the pivot and could drop to the 1st support.
Pivot: 1.1425
1st Support: 1.1146
1st Resistance: 1.1569
Risk Warning:
Trading Forex and CFDs carries a high level of risk to your capital and you should only trade with money you can afford to lose. Trading Forex and CFDs may not be suitable for all investors, so please ensure that you fully understand the risks involved and seek independent advice if necessary.
Disclaimer:
The above opinions given constitute general market commentary, and do not constitute the opinion or advice of IC Markets or any form of personal or investment advice.
Any opinions, news, research, analyses, prices, other information, or links to third-party sites contained on this website are provided on an "as-is" basis, are intended only to be informative, is not an advice nor a recommendation, nor research, or a record of our trading prices, or an offer of, or solicitation for a transaction in any financial instrument and thus should not be treated as such. The information provided does not involve any specific investment objectives, financial situation and needs of any specific person who may receive it. Please be aware, that past performance is not a reliable indicator of future performance and/or results. Past Performance or Forward-looking scenarios based upon the reasonable beliefs of the third-party provider are not a guarantee of future performance. Actual results may differ materially from those anticipated in forward-looking or past performance statements. IC Markets makes no representation or warranty and assumes no liability as to the accuracy or completeness of the information provided, nor any loss arising from any investment based on a recommendation, forecast or any information supplied by any third-party.

gbpjpy sell signalIn this analysis, it has exited an ascending channel and entered a descending channel. According to the analysis, if that support floor is crossed and a pullback to that resistance level, that is, the price is 190.829, it is suitable for selling and the stop loss is at 191.87 with a risk to reward of 1 to 5.82.

XAU/USD Elliott Wave Count: Preparing for Final ImpulseXAU/USD appears to be in a textbook 5-wave impulsive structure on the 4H chart, with the market now completing Wave 4 as a classic ABC corrective flat/pennant.
The impulsive move from the Wave 2 low has formed clear internal substructures, with Wave 3 exhibiting extended price action, consistent with Elliott Wave guidelines.
Currently, price is consolidating in a contracting pattern labeled Wave 4 (A-B-C), which looks to be near completion. Based on wave symmetry and Fibonacci projections, a strong upside move is anticipated once Wave 4 concludes, leading into the final Wave 5 rally.
Entry Zone: 3286.875
Target: 3367.440– 3410.210
Stop Loss: Below 3260.190.
