EURUSD time for correctionMonthly
On the monthly timeframe, we came to the Premium zone and captured Monthly Fractal High, where previously there was predominance from the sell side.
Weekly
Price has formed a Weekly FVG, indicating strong dominance from the buy side. However, it is important to understand WHERE this has led us ? The current quotes are interesting for sellers. Hence, we should assume that the price may receive a counter offer from the sell side. It is logical to assume potential points A and B in this context.
Daily
Price has formed primary signs of change in the price delivery state:
- Bullish PD Array disrespecting
- BISI forming
- CISD forming
All this indicates a shift of initiative to the selling side, so it is logical to expect a continuation of the downward movement after interaction with the marked PD Array.
Also, I would like to draw your attention to the fact that the price is within the Inside Bar for the 3rd day already. This means that recently the price has been held within the same values, which indicates a balance of power between buyers and sellers at the current quotes. In such a situation, all we have to do is to find the optimal area to continue the downward price formation.
Forexsignals

AUDNZD - BEARISH MOVEHello Traders !
After a huge bearish move, The AUDNZD broke the support level (1.07312 - 1.07522).
This key level becomes new resistance!
So, I predict a bearish move📉
_______________
TARGET: 1.06100🎯

EURUSD below its 4H MA50 signals more selling.The EURUSD pair broke last Wednesday below its 4H MA50 for the first time since the start of April and is now consolidating under it. Within its 3-month Channel Up, this has always been a signal of more downtrend to come as it was technically halfway through the Bearish Legs of the pattern.
Given that the 4H MA200 (orange trend-line) is the medium-term Support, our Target is at 1.12500, just above the Internal Higher Lows trend-line. Check also the 4H RSI sequences between these 3 Bearish Legs. It is exactly ranging between the levels it did half-way through those Legs.
-------------------------------------------------------------------------------
** Please LIKE 👍, FOLLOW ✅, SHARE 🙌 and COMMENT ✍ if you enjoy this idea! Also share your ideas and charts in the comments section below! This is best way to keep it relevant, support us, keep the content here free and allow the idea to reach as many people as possible. **
-------------------------------------------------------------------------------
💸💸💸💸💸💸
👇 👇 👇 👇 👇 👇

EURNZD strong daily demand level at 1.89. Long biasSupply and demand imbalances are the driving forces behind price movements in the Forex market. By identifying these key zones or imbalances, traders can anticipate high-probability reversal or continuation setups. Today, we’ll analyze the EURNZD cross pair, which has recently formed a strong demand imbalance at $1.89—the most significant impulse in months.
The Power of Supply & Demand Imbalances
Supply and demand trading revolves around identifying areas where price has made a strong, impulsive move (demand or supply zone) and then waiting for a retracement into that zone for a potential reversal or continuation.
Key Characteristics of a Strong Imbalance:
✅ Extended Range Candles (ERC): Strong, wide-bodied candles indicate institutional buying/selling.
✅ Strong Imbalance: A clear shift in market structure after a strong rally or drop.
✅ Fresh Zone: The imbalance has not been tested yet or has only been tested once.

CADCHF: Still Bullish 🇨🇦🇨🇭
Last week, I shared a very bullish outlook for CADCHF
based on a breakout and a retest of a key daily structure.
I keep holding a long trade on the pair and still expect growth.
Goal - 0.602
❤️Please, support my work with like, thank you!❤️
I am part of Trade Nation's Influencer program and receive a monthly fee for using their TradingView charts in my analysis.

USOILOil shows price moving between a clear support level and a strong order block resistance above. Currently, price is trading inside a resistance zone around 63.25.
The chart indicates a potential bullish move, targeting the 64.22 level, where the order block resides.
Key Technical Points:
- Support Level: Strong demand area near 62.00.
- FVG (Fair Value Gap): Gap filled below current price.
- Resistance Zone: Price facing resistance around 63.00-63.50.
- Order Block: Major target area near 64.22.
Target Projection: $64.22
Outlook:
If buyers sustain momentum above the resistance zone, we could see a rally toward the 64.22 target at the order block. Confirmation of a breakout and retest would strengthen the bullish bias.
Would you like me to also create a quick short caption for social media posting?

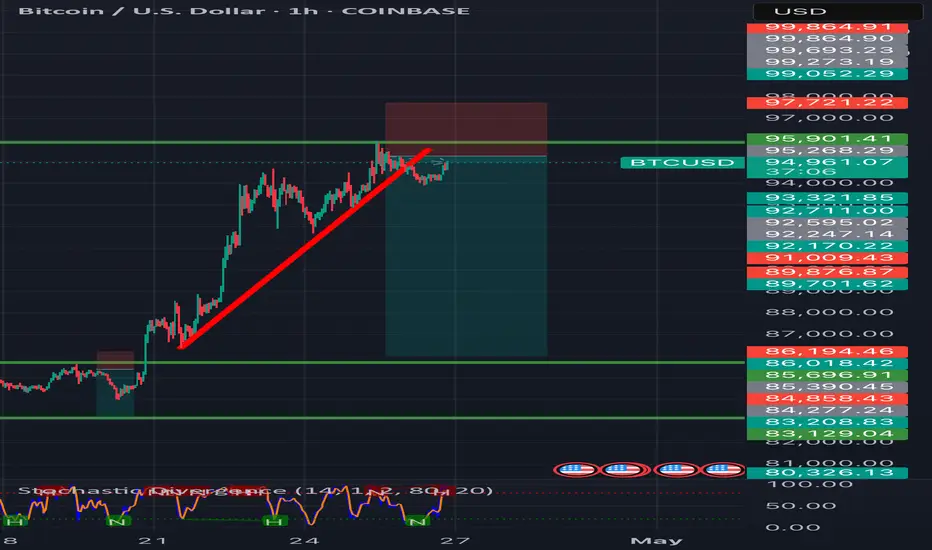
BTCUSD Bitcoin (BTC/USD) highlights price movement between a key resistance zone and a strong support level. Price has currently pushed back into the Fair Value Gap (FVG) zone near 94,600, setting up a potential short-term reversal.
The expectation shown on the chart is for price to react from the FVG/resistance area and move lower toward the support level, targeting around 92,947.
Key Technical Points:
- Resistance Zone: 95,500 -95,750
- FVG Area: Current price is testing imbalance at 94,600.
- Support Level: Strong demand zone near92,750.
- Target Projection: $92,947
Outlook: Price is likely to face selling pressure around the FVG and resistance zone, leading to a possible drop towards the support zone. Traders should monitor bearish confirmations for potential short opportunities.
Would you also like me to create a short caption for posting this chart on social media?

GOLD Gold (XAU/USD) shows price action ranging between a strong support level and a visible order block above. Price recently tested the support zone near 3,260.000, showing potential signs of a bullish reaction.
The chart highlights a possible upward move toward the Fair Value Gap (FVG) zone, targeting around 3325.626.
Key Technical Points:
- Support Level: Price bounced from the 3,260.000 zone.
- FVG Area: Gap available for price to fill up toward 3325.626.
- Order Block: Major resistance near the 3,440.000 region.
- Structure: A potential bullish short-term recovery setup.
Target Projection: $3325.626
If buyers maintain control around the current support, we could see a move into the FVG before facing major resistance at the order block above. Watch closely for bullish confirmations or possible rejections around the FVG area.

EURCHF: Pullback From Support 🇪🇺🇨🇭
There is a high chance that EURCHF will bounce
from a recently broken horizontal resistance.
After a breakout, it turned into support with a high probability.
As a confirmation signal, I see a tiny cup & handle pattern
on an hourly time frame and intraday bullish imbalance.
Goal - 0.9422
❤️Please, support my work with like, thank you!❤️
I am part of Trade Nation's Influencer program and receive a monthly fee for using their TradingView charts in my analysis.

euraud buy signalIn this signal, it has exited a descending channel and entered an ascending channel, and it has formed a powerful candle on the daily time frame, and the risk to reward is 1 to 5, and according to our analysis, it will see the target.

Bearish reversal off pullback resistance?The Swissie (USD/CHF) is rising towards the pivot and could reverse to the pullback support.
Pivot: 0.8400
1st Support: 0.8089
1st Resistance: 0.8604
Risk Warning:
Trading Forex and CFDs carries a high level of risk to your capital and you should only trade with money you can afford to lose. Trading Forex and CFDs may not be suitable for all investors, so please ensure that you fully understand the risks involved and seek independent advice if necessary.
Disclaimer:
The above opinions given constitute general market commentary, and do not constitute the opinion or advice of IC Markets or any form of personal or investment advice.
Any opinions, news, research, analyses, prices, other information, or links to third-party sites contained on this website are provided on an "as-is" basis, are intended only to be informative, is not an advice nor a recommendation, nor research, or a record of our trading prices, or an offer of, or solicitation for a transaction in any financial instrument and thus should not be treated as such. The information provided does not involve any specific investment objectives, financial situation and needs of any specific person who may receive it. Please be aware, that past performance is not a reliable indicator of future performance and/or results. Past Performance or Forward-looking scenarios based upon the reasonable beliefs of the third-party provider are not a guarantee of future performance. Actual results may differ materially from those anticipated in forward-looking or past performance statements. IC Markets makes no representation or warranty and assumes no liability as to the accuracy or completeness of the information provided, nor any loss arising from any investment based on a recommendation, forecast or any information supplied by any third-party.

Could the price reverse from here?USD/JPY is rising towards the pivot which is a pullback resitance that aligns with the 50% Fibonacci retracement and could reverse to the 1st support.
Pivot: 145.61
1st Support: 140.60
1st Resistance: 147.84
Risk Warning:
Trading Forex and CFDs carries a high level of risk to your capital and you should only trade with money you can afford to lose. Trading Forex and CFDs may not be suitable for all investors, so please ensure that you fully understand the risks involved and seek independent advice if necessary.
Disclaimer:
The above opinions given constitute general market commentary, and do not constitute the opinion or advice of IC Markets or any form of personal or investment advice.
Any opinions, news, research, analyses, prices, other information, or links to third-party sites contained on this website are provided on an "as-is" basis, are intended only to be informative, is not an advice nor a recommendation, nor research, or a record of our trading prices, or an offer of, or solicitation for a transaction in any financial instrument and thus should not be treated as such. The information provided does not involve any specific investment objectives, financial situation and needs of any specific person who may receive it. Please be aware, that past performance is not a reliable indicator of future performance and/or results. Past Performance or Forward-looking scenarios based upon the reasonable beliefs of the third-party provider are not a guarantee of future performance. Actual results may differ materially from those anticipated in forward-looking or past performance statements. IC Markets makes no representation or warranty and assumes no liability as to the accuracy or completeness of the information provided, nor any loss arising from any investment based on a recommendation, forecast or any information supplied by any third-party.

Bulllish continuation for the Cable?GBP/USD is fallling towards the pivot and could bounce to the pullback resistance.
Pivot: 1.3110
1st Support: 1.3005
1st Resistance: 1.3415
Risk Warning:
Trading Forex and CFDs carries a high level of risk to your capital and you should only trade with money you can afford to lose. Trading Forex and CFDs may not be suitable for all investors, so please ensure that you fully understand the risks involved and seek independent advice if necessary.
Disclaimer:
The above opinions given constitute general market commentary, and do not constitute the opinion or advice of IC Markets or any form of personal or investment advice.
Any opinions, news, research, analyses, prices, other information, or links to third-party sites contained on this website are provided on an "as-is" basis, are intended only to be informative, is not an advice nor a recommendation, nor research, or a record of our trading prices, or an offer of, or solicitation for a transaction in any financial instrument and thus should not be treated as such. The information provided does not involve any specific investment objectives, financial situation and needs of any specific person who may receive it. Please be aware, that past performance is not a reliable indicator of future performance and/or results. Past Performance or Forward-looking scenarios based upon the reasonable beliefs of the third-party provider are not a guarantee of future performance. Actual results may differ materially from those anticipated in forward-looking or past performance statements. IC Markets makes no representation or warranty and assumes no liability as to the accuracy or completeness of the information provided, nor any loss arising from any investment based on a recommendation, forecast or any information supplied by any third-party.

Falling towards pullback support?The Fiber (EUR/USD) is fallling towards the pivot which has been identified as a pullback support and could bounce to the 1st resistance which is a pullback resistance.
Pivot: 1.1192
1st Support: 1.1051
1st Resistance: 1.1512
Risk Warning:
Trading Forex and CFDs carries a high level of risk to your capital and you should only trade with money you can afford to lose. Trading Forex and CFDs may not be suitable for all investors, so please ensure that you fully understand the risks involved and seek independent advice if necessary.
Disclaimer:
The above opinions given constitute general market commentary, and do not constitute the opinion or advice of IC Markets or any form of personal or investment advice.
Any opinions, news, research, analyses, prices, other information, or links to third-party sites contained on this website are provided on an "as-is" basis, are intended only to be informative, is not an advice nor a recommendation, nor research, or a record of our trading prices, or an offer of, or solicitation for a transaction in any financial instrument and thus should not be treated as such. The information provided does not involve any specific investment objectives, financial situation and needs of any specific person who may receive it. Please be aware, that past performance is not a reliable indicator of future performance and/or results. Past Performance or Forward-looking scenarios based upon the reasonable beliefs of the third-party provider are not a guarantee of future performance. Actual results may differ materially from those anticipated in forward-looking or past performance statements. IC Markets makes no representation or warranty and assumes no liability as to the accuracy or completeness of the information provided, nor any loss arising from any investment based on a recommendation, forecast or any information supplied by any third-party.

Heading into pullback resistance?US Dollar Index (DXY) is rising towards the pivot which is a pullback resistance and could reverse to the 1st support which acts as a pullback support.
Pivot: 100.27
1st Support: 98.32
1st Resistance: 101.77
Risk Warning:
Trading Forex and CFDs carries a high level of risk to your capital and you should only trade with money you can afford to lose. Trading Forex and CFDs may not be suitable for all investors, so please ensure that you fully understand the risks involved and seek independent advice if necessary.
Disclaimer:
The above opinions given constitute general market commentary, and do not constitute the opinion or advice of IC Markets or any form of personal or investment advice.
Any opinions, news, research, analyses, prices, other information, or links to third-party sites contained on this website are provided on an "as-is" basis, are intended only to be informative, is not an advice nor a recommendation, nor research, or a record of our trading prices, or an offer of, or solicitation for a transaction in any financial instrument and thus should not be treated as such. The information provided does not involve any specific investment objectives, financial situation and needs of any specific person who may receive it. Please be aware, that past performance is not a reliable indicator of future performance and/or results. Past Performance or Forward-looking scenarios based upon the reasonable beliefs of the third-party provider are not a guarantee of future performance. Actual results may differ materially from those anticipated in forward-looking or past performance statements. IC Markets makes no representation or warranty and assumes no liability as to the accuracy or completeness of the information provided, nor any loss arising from any investment based on a recommendation, forecast or any information supplied by any third-party.

GOLD / XAUUSD | 15M | PENDING SELL ORDERHey there my dear friends;
SIGNAL ALERT
PENDING SELL ORDER - GOLD / XAUUSD > 3334,0
🟢TP1: 3328,0
🟢TP2: 3314,0
🟢TP3: 3296,0
🔴SL:3358,0
RR / 1,70
Dear friends, your likes are always my biggest source of motivation for me to share analysis. For this reason, I would like to ask each and every one of my followers; please do not miss your likes.
I sincerely thank everyone who supports me with their likes.

GBPUSD Rejected at Key Resistance – Bearish Outlook StaysLast week, in my GBPUSD analysis, I highlighted that the pair had reached a major resistance area – a level that has acted as both support and resistance over the past few years. I mentioned that a correction from this zone was very likely.
The market reacted perfectly: GBPUSD dropped from that resistance, and after the initial move, it entered into a consolidation phase.
The key question now: Is the correction finished or will the downside continue?
My outlook remains the same – I still expect further downside towards the 1.3000 level.
Here’s why I stay bearish:
- Strong historical resistance rejected the price.
- No real bullish momentum above 1.34 zone.
- Consolidation after the drop looks more like a pause, not a reversal.
Trading Plan:
I will look to sell rallies, staying bearish as long as the 1.3400 area (recent high) is not broken.
Disclosure: I am part of Trade Nation's Influencer program and receive a monthly fee for using their TradingView charts in my analyses and educational articles.

Heading into pullback resistance?GBP/JPY is rising towards the resistance level which is a pullback resistance that lines up with the 71% Fibonacci retracement and the 161.8% Fibonacci extension and could reverse from this level to our take profit.
Entry: 192.34
Why we like it:
There is a pullback resistance that lines up with the 161.8% Fibonacci extension and the 71% Fibonacci retracement.
Stop loss: 194.82
Why we like it:
There is a pullback resistance.
Take profit: 189.96
Why we like it:
There is a pullback support level that aligns with the 38.2% Fibonacci retracement.
Enjoying your TradingView experience? Review us!
Please be advised that the information presented on TradingView is provided to Vantage (‘Vantage Global Limited’, ‘we’) by a third-party provider (‘Everest Fortune Group’). Please be reminded that you are solely responsible for the trading decisions on your account. There is a very high degree of risk involved in trading. Any information and/or content is intended entirely for research, educational and informational purposes only and does not constitute investment or consultation advice or investment strategy. The information is not tailored to the investment needs of any specific person and therefore does not involve a consideration of any of the investment objectives, financial situation or needs of any viewer that may receive it. Kindly also note that past performance is not a reliable indicator of future results. Actual results may differ materially from those anticipated in forward-looking or past performance statements. We assume no liability as to the accuracy or completeness of any of the information and/or content provided herein and the Company cannot be held responsible for any omission, mistake nor for any loss or damage including without limitation to any loss of profit which may arise from reliance on any information supplied by Everest Fortune Group.

Bearish reversal?USD/JPY is rising towards the resistance level which is a pullback resistance that is slightly above the 50% Fibonacci retracement and also lines up with the 61.8% Fibonacci projection and could reverse to from this level to our take profit.
Entry: 144.37
Why we like it:
There is a pullback resistance level that lines up with the 61.8% Fibonacci projection and is also slightly above the 50% Fibonacci retracement.
Stop loss: 145.43
Why we like it:
There is a pullback resistance level that is slightly above the 61.8% Fibonacci retracement.
Take profit: 142.20
Why we like it:
There is a pullback support level.
Enjoying your TradingView experience? Review us!
Please be advised that the information presented on TradingView is provided to Vantage (‘Vantage Global Limited’, ‘we’) by a third-party provider (‘Everest Fortune Group’). Please be reminded that you are solely responsible for the trading decisions on your account. There is a very high degree of risk involved in trading. Any information and/or content is intended entirely for research, educational and informational purposes only and does not constitute investment or consultation advice or investment strategy. The information is not tailored to the investment needs of any specific person and therefore does not involve a consideration of any of the investment objectives, financial situation or needs of any viewer that may receive it. Kindly also note that past performance is not a reliable indicator of future results. Actual results may differ materially from those anticipated in forward-looking or past performance statements. We assume no liability as to the accuracy or completeness of any of the information and/or content provided herein and the Company cannot be held responsible for any omission, mistake nor for any loss or damage including without limitation to any loss of profit which may arise from reliance on any information supplied by Everest Fortune Group.

GOLD UPDATEHello friends✌
As you can see, after a sharp price drop, gold has entered a range that has formed a double top pattern that warns us of a continued price drop, so be careful🔊📈
*Trade safely with us*

EURUSDHello Traders! 👋
What are your thoughts on EURUSD?
EURUSD has pulled back after reaching the top of the ascending channel and encountering a resistance zone.
We expect the correction to continue at least toward the identified support level.
After completing the correction, a new bullish wave is expected to begin, potentially pushing the price toward higher levels.
Will EURUSD resume its uptrend after the pullback? Share your thoughts below!
Don’t forget to like and share your thoughts in the comments! ❤️

EURGBPEURGBP price is near the support zone 0.85263-0.84912. If the price can still stand above 0.84826, it is expected that the price will rebound. Consider buying the red zone.
🔥Trading futures, forex, CFDs and stocks carries a risk of loss.
Please consider carefully whether such trading is suitable for you.
>>GooD Luck 😊
❤️ Like and subscribe to never miss a new idea!

Bitcoin sell technical analysis Description:
Bitcoin is rejecting major resistance near $94,000 after forming a bearish engulfing candle on the 4H chart.
• Key Resistance: $94,000–$95,000 zone rejected with strong selling pressure.
• RSI Divergence: Bearish divergence between price and RSI confirms weakness.
• Break of Support: Price broke minor support at $92,800, shifting short-term structure bearish.
• Moving Averages: Trading below the 50 EMA on the 4H chart, signaling bearish momentum.
Sell Setup:
• Look for entries around $93,500–$94,000 (retest zone).
• Stop-loss above $95,000.
• TP1: $91,000
• TP2: $88,500
Bitcoin is showing clear signs of a pullback — sellers are currently in control.