NEXT MOVE Revised Bullish Setup Idea:
Buy Zone: Break and close above 1.3320.
Target: 1.3380–1.3410.
Invalidation: Below 1.3270 (recent minor support
Forexspecs

NEXT MOVE Bearish Disruption Analysis:
1. Support Breakdown Risk
The chart highlights the 145.000–145.200 area as a support zone.
If price breaks below this support with strong bearish momentum, it could invalidate the bullish reversal expectation.
A close below 144.800 would confirm weakness, suggesting a potential shift in sentiment

NEXT MOVE Alternative Trade Setup:
Buy Area: 1.1230–1.1245 (accumulation zone).
Target: 1.1305–1.1330.
Stop Loss: Below 1.1200 (to avoid stop hunts).

NEXT MOVE The price has already tested the support-turned-resistance zone (around $61.30–$61.50) and showed early signs of rejection with high selling volume.
This suggests buyers may be losing momentum near this level.

NEXT MOVEInvalidation of Bearish Setup:
If silver closes above $33.00 with strong momentum, the resistance will turn into support, invalidating the expected sell-off and opening room toward $33.50+ levels.

XAUUSD NEXT MOVE Price fails to break 3,340–3,360 resistance.
2. Rejection leads to another drop toward 3,280 support.
3. Weak bounce or no bounce from the support zone.
4. Breakdown and continuation to the downside.
XAUUSD NEXT MOVE FOR FOMC NEWS TRADE Instrument: Gold CFDs (XAU/USD)
• Timeframe: 4H
• Current Price: ~$3,385.83
• Key Annotations:
• Support Zone: Around 3,280–3,360
• Breakout Point: Just above current price (~3,390)
• Resistance Level: Near 3,500
• FOMC Note: “FOMC TRADE DON’T MISS

XAUUSD NEXT MOVE Over-Reliance on Double Top Projection
• The chart assumes a price move straight up to form a “double top” around 3,540–3,550 without acknowledging possible market hesitation or intervening resistance zones.
• A double top pattern requires a confirmation of rejection at the same level; assuming it prematurely can be misleading.
2. Support Zone Might Not Be Strong Enough
• The “Strong Support and Bullish Area” is drawn around 3,200–3,230, but the bounce shown in the chart is still not well-established. A break below this would invalidate the bullish thesis.
• There is no confirmation of higher lows, which is critical for a trend reversal.
3. Overlooked Bearish Pressure
• The previous high (around 3,540) led to a sharp selloff, indicating strong supply. This area could be a distribution zone rather than just resistance.
• Market sentiment might still be bearish unless a higher high is confirmed.
4. Resistance Area Is Vague
• The “Resistance” zone between 3,340–3,360 is too narrow and lacks confluence with indicators like moving averages or volume spikes.
• A pullback from this zone is plausible, and it should be treated as a decision area, not just a step before price rallies.
5. Economic Events Are Ignored
• There is an icon showing a U.S. economic event, but the chart doesn’t factor in fundamental catalysts, which could disrupt technical patterns significantly.

EURUSD NEXT MOVE. BIG FALL SOON Overreliance on Double Top Resistance
Disruption: The “Double Top Resistance” at around 1.13600 may not be reliable unless confirmed by volume or reversal patterns. It’s only touched twice and could also be part of a broader consolidation range.
Counterpoint: If buyers are still showing strength near resistance (as seen in volume spikes), this might signal an eventual breakout rather than a strong rejection.
2. Support Zones Too Close
Disruption: The “Support” and “Strong Support” levels are relatively close (about 30-40 pips apart). This could reduce the predictive value of the support levels, especially in a volatile market like forex Alternative: A single, broader support zone with a midpoint could provide a more flexible analysis. Downtrend Line Interpretation Disruption: The downward trendline assumes continued bearish pressure. However, the price has been forming higher lows, suggesting a possible trend shift Alternative Perspective: If price breaks above the descending trendline with strong volume, it could invalidate the bearish bias
4. Volume Ignored in Prediction Path Disruption: The prediction path in light blue doesn’t incorporate volume behavior. Without volume confirmation, price movement patterns can be misleading Improvement: Use volume at key resistance/support areas to validate breakouts or rejections
5. Lack of Fundamental Context
• Disruption: The chart is entirely technical. Upcoming economic data (like ECB or Fed announcements) could drastically change market behavior, rendering technical patterns ineffective.

TARGET SUCCESSFULLYThis chart highlights a textbook liquidity sweep and reversal pattern in Gold (XAU/USD).
Key Levels:
- Resistance Zone: Clearly defined above 3,360, with multiple rejection points.
- Support Level: Around 3,250, acting as a strong demand area.
- Liquidity Zone: Price dipped below the support to trigger stop-losses and trap sellers before reversing upward.
Price Action Insights:
- After grabbing liquidity below the support zone, the price rallied back, confirming a reversal setup.
- The move reached the target zone at 3251.225, fulfilling the projected bullish objective.
Outcome:
The trade idea played out successfully with the target marked as complete. Now, price is hovering at the former support-turned-resistance zone.
Next Steps:
Traders should monitor for:
- A potential breakout above this zone for continuation.
- Or rejection signals for a short-term pullback.

GOLD UPWARD COMING SOON Gold (XAU/USD) shows the price currently trading within a defined range between the support level at 3272.581 and the resistance zone around 3367.926.
Technical Highlights:
- Support Level: Strong demand seen around 3272.581 where price has previously rebounded.
- Resistance Zone: 3367.926 marks a key supply area that has held several past tests.
- Current Structure: A bullish corrective move appears underway with the potential to test the target area at 3338.838, aligning with a minor resistance zone.
- Price Behavior: Recent rejection from the support zone indicates bullish pressure; if momentum holds, price is likely to challenge the next resistance.
Next Target: 3338.838
Outlook: If gold sustains above the mid-range support, bullish continuation toward 3338.838 is favored. However, price must break minor resistance cleanly for further upside confirmation.
Would you like a social media caption or short signal text for this as well?

USOILThis chart for WTI Crude Oil presents a bullish continuation setup following a rebound from the support level around 61.50. After breaking above a minor consolidation range, price is now retracing slightly before potentially continuing its upward movement.
The chart highlights a target at63.95, just below the upper resistance zone, which previously acted as a strong supply area.
Technical Breakdown:
- Support Level: Firm bounce near 61.50, confirming demand.
- Minor Breakout: Price broke above local structure and retesting for continuation.
- Resistance Zone: Located near64.00, target aligns with historical supply.
- Next Target: 63.95
Volume spikes during the bounce suggest strong buyer interest. A clean break and hold above 63.00 could open the path toward the $63.95 target. Traders may look for bullish price action confirmation for entry.

euraud sell signal. Don't forget about stop-loss.
Write in the comments all your questions and instruments analysis of which you want to see.
Friends, push the like button, write a comment, and share with your mates - that would be the best THANK YOU.
P.S. I personally will open entry if the price will show it according to my strategy.
Always make your analysis before a trade

GOLD NEXT MOVESpelling Mistakes: "SOPPRT" should be "SUPPORT."
Lack of Bearish Scenario: The chart assumes an upward movement, but what happens if price fails to hold the support zones?
Volume Analysis Missing: Volume is shown, but its role in confirming trends is unclear. A breakout with high volume would be more reliable.
2. Alternative Perspective
Possible Fakeout: The price may not break resistance and could retrace.
Stronger Rejection?: The price might struggle at the resistance zone rather than pushing through easily.

GOLD NEXT MOVE Bullish Breakout Potential:
Alternative Scenario: Instead of the bearish move toward the lower targets, the price might break through the strong resistance (highlighted at the "double top" area).
Trigger: A strong bullish volume surge could invalidate the resistance zone, leading to an upward breakout toward a potential new high, around 3,050–3,070.
2. Support Holding Strong:
Alternative Outlook: The "Target Breakout" support level may serve as a key reversal zone, forming a higher low. If buyers defend this level aggressively, it could lead to a trend reversal back to the top of the range.
Trigger: Bullish momentum around the support could push the price back toward 3,040 and invalidate the bearish arrow projection.
3. Sideways Consolidation:
Alternative Setup: The price might remain range-bound between 3,020 and 3,040 for some time due to market indecision, as traders assess macroeconomic factors (e.g., inflation, central bank moves).
Trigger: Lack of clear bullish or bearish momentum could lead to whipsaw action, trapping both buyers and sellers.

all tiem high gold target 3080Double Top Resistance May Hold – The chart assumes a breakout above the double top resistance, but double tops often indicate a reversal rather than a continuation. A strong rejection from this level could lead to a bearish move instead of the projected bullish scenario.
Volume Divergence – The recent price action does not seem to show strong bullish volume compared to the previous rally. If buyers are weaker at this level, a fake breakout could trap longs before reversing downward.
Support Might Break Instead of Holding – The analysis assumes that the support zones will hold, but if price retests the nearest support and breaks below it, the entire bullish scenario could be invalidated.
Bearish Scenario Missing – The chart focuses heavily on an upward move but lacks a strong bearish alternative. If sellers step in near resistance, a drop toward lower supports (like $3,020 or lower) becomes a valid possibility.

GBPUSD STRONG ANALYSIS 1. Over-Reliance on the Ascending Channel
The chart assumes price will stay within the current rising channel, but price action often breaks such structures. A bearish breakdown could invalidate this projection.
If 1.26070 support fails, we may see a larger downtrend rather than a bounce.
2. Resistance Might Be Stronger Than Expected
The 1.8060 resistance is plotted far from the current price (1.28773). Assuming such a long-term rally without testing lower levels could be overly optimistic.
Sellers may push price down near 1.2700 or lower before any meaningful bullish move.
3. Volume and Momentum Are Missing from the Analysis
There's no clear volume confirmation supporting the bullish move. If buying volume weakens, the price may consolidate instead of rallying.
RSI/MACD divergence could indicate exhaustion, leading to a bearish reversal.
4. Macro Factors Could Invalidate This Setup
The British Pound is highly sensitive to economic data (inflation, interest rates, etc.).
If upcoming news favors the USD, the GBP/USD pair could break below support levels rather than respecting the predicted bounce zones.
Possible Alternative Scenario
A false breakout above recent highs could lead to a reversal, with price targeting 1.26070 or even lower levels before finding real bullish strength

XAUUSD buy now 1. Support Adjustment:
The current support area is around 2,900, but if you want more distance, you might consider a lower range, around 2,880–2,895 for a stronger support base.
2. Resistance Adjustment:
The resistance is currently around 2,940. You could extend it further upwards, possibly in the 2,950–2,960 range, to create more distance between support and resistance.

Gold confirm buy opportunity read the caption Gold’s price (XAU/USD) is set to revisit the high in the Asian session near $2,876 at the time of writing after a steady positive Monday thus far. Tariffs are still set to hit on Tuesday for Mexico and Canada and additional tariffs on China, they are really triggering another flight into Gold. Traders will need to look

Btcusd strong sell 1. Resistance and Selling Zone:
The chart assumes that the marked resistance level will cause a strong rejection and lead to a downward movement. However, resistance levels can break if buying pressure is strong, leading to a breakout instead of a drop.
The selling zone marked might not be as strong as assumed, especially if there is high bullish momentum.
2. Bearish Projection Bias:
The analysis is heavily biased toward a bearish outcome, predicting a strong move down. However, Bitcoin is known for its volatility, and market sentiment can shift quickly.
The projection doesn’t account for potential bullish catalysts such as news, institutional buying, or unexpected support from higher time frames.
3. Support Level Stability:
While the support level is marked, there is no confirmation that it will hold. If too many traders expect it, it could be invalidated by a deeper move down.
It also lacks reference to volume analysis, which is crucial for confirming strong support or resistance.
4. Short Time Frame Limitations:
The chart is based on a 15-minute time frame, which can be misleading due to short-term noise.
A higher time frame analysis (1-hour or 4-hour) should be considered to confirm major trends.
5. Missing Confirmation Factors:
No indicators like RSI, MACD, or volume analysis are included to support the downtrend thesis.
Lack of candlestick pattern confirmation—just touching resistance doesn’t always mean reversal.
Alternative View:
Instead of expecting a direct rejection, a potential breakout scenario should be considered.
A fakeout above resistance could trap early sellers before a real move occurs.

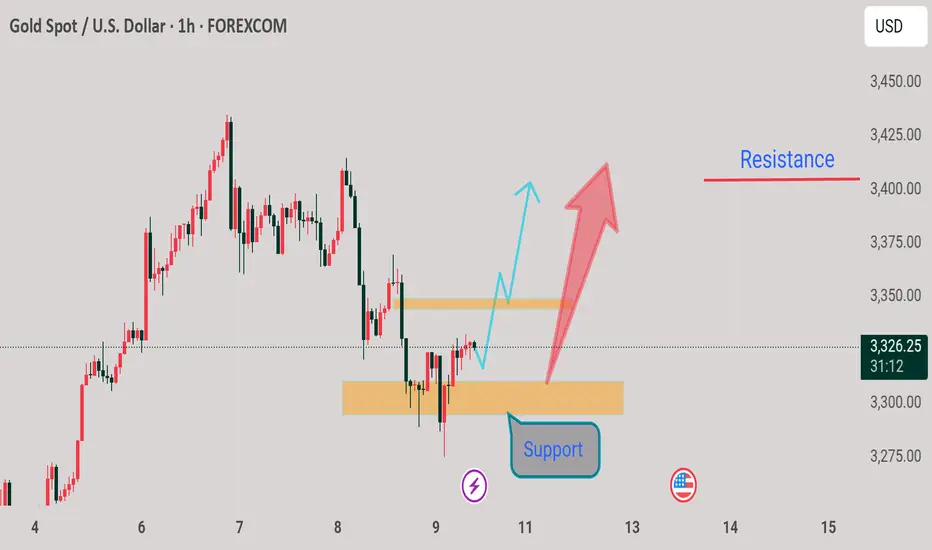
XAUUSD strong bullish soon opportunity again all time high This chart shows a technical analysis of Gold (XAUUSD) on the 1-hour timeframe. The main elements include:
Support Area: Marked in green below the current price level, indicating a zone where buying interest may emerge.
Resistance Area: Marked in green above, representing a potential supply zone where selling pressure might increase.
Price Action Projection: The pink arrow suggests a bullish move from the support zone towards the resistance area.
Disruptions or Alternative Perspectives:
1. False Breakout Possibility:
Price might break below the support area before reversing, creating a stop-hunt scenario.
Watch for a strong rejection before confirming the bullish bias.
2. Resistance Strength:
The resistance zone (around 2,961) has been tested multiple times. If price reaches it again, sellers might dominate.
A clean breakout above resistance with strong volume is needed for further upside.
3. Alternative Scenario - Bearish Case:
If price struggles to hold the support zone, it could break lower, leading to further downside.
Invalidation of bullish bias occurs if price closes below the support zone with high volume.
4. Macroeconomic & Fundamental Factors:
Gold is highly sensitive to economic data, interest rate decisions, and geopolitical events.
A sudden change in fundamentals could override technical analysis

GBPUSD SELLING MODE OPPORTUNITY FULL OF FALL ASLEEP 1. Resistance May Not Hold
The analysis assumes the resistance zone is strong and will lead to a reversal. However, if bullish momentum continues, there could be a breakout above resistance instead of rejection. A breakout above 1.2680 could invalidate the bearish outlook.
2. Trendline Breakout Is Not Always Reliable
While the breakout from the support area led to a strong uptrend, it doesn't guarantee a reversal at resistance. Sometimes, price consolidates and continues higher rather than reversing sharply.
3. Liquidity Grab Possibility
The price could fake a drop below support, trapping sellers, before reversing higher. The marked "selling zone" might be a liquidity area where big players accumulate positions before a breakout.
4. Fundamental Factors Can Change Direction
News events, interest rate decisions, or economic reports can disrupt technical patterns. A major announcement favoring GBP could push the price higher instead of following the predicted bearish move.
Alternative Outlook
If GBP/USD breaks above 1.2680, it could invalidate the bearish setup and target 1.2720+ instead of dropping.
Instead of expecting a hard rejection at resistance, traders should watch for signs of consolidation or a fake breakout before making a decision.

XAUUSD strong bullish mode opportunity all time high market (gold big flying soon)
1. Resistance Area May Not Hold
The marked resistance area could be weak if bullish momentum continues strongly, especially with a breakout above recent highs.
If price consolidates near resistance without strong rejection, it may indicate accumulation rather than reversal
2. Support Areas Could Fail
The support zones might not hold if there's a strong bearish catalyst, like economic news or a shift in market sentiment.
A breakdown below the strong bullish support area could signal a deeper pullback.
3. Alternative Scenarios
Instead of bouncing from the lower support, the price might consolidate and range before a clear breakout direction.
A false breakout above resistance could trigger a liquidity grab, leading to a sharp drop instead of an upward move.
4. Indicators & Confirmation Needed
The chart does not include indicators like RSI, MACD, or moving averages, which could provide additional confirmation
