BITCOIN → Correction to the risk zone. Rise or fall?BINANCE:BTCUSDT has updated its local maximum to 97,900, the market structure is quite positive, but still depends on the fundamental background and the behavior of the S&P 500.
The fundamental reasons that influenced the growth are the improvement in the tariff situation in the US and relations with China. Bitcoin's growth strengthened as the SP500 index rose, with which it has a fairly high correlation. In the second half of this week, the price broke out of the two-week consolidation, breaking through the resistance level of 95,500 and updating the local maximum. A correction is forming within the local upward channel.
95,000 is the liquidity and risk zone. That is, if the bulls hold their defense above 95K during the retest, Bitcoin will continue to grow in the short and medium term. Otherwise, a break of 95K could trigger a drop to 92K-88K.
Resistance levels: 97,425, 99,475
Support levels: 95,500, 92,000
All eyes are on the 95.5K support level, below which a huge liquidity pool has formed. Growth may be influenced by a retest (false breakout of support) and an imbalance of forces in the market. But we need to be careful, as the market will react to economic data. BUT! A return of prices to the selling zone (below 95000 - 95500) and the inability to continue growth could trigger a correction and liquidation.
Best regards, R. Linda!
Fundamental Analysis

#USDCHF: Will USD Breakthrough The Strong Bearish Downtrend? The USDCHF currency pair has experienced significant volatility due to the ongoing trade dispute between the United States and China, which has led to a substantial decline in the DXY index. Consequently, CHF and JPY have emerged as the most stable currencies in the market.
Despite the USDCHF currency pair reversing its bullish trend, we anticipate a potential reversal back to a bearish position. We believe this reversal may be a temporary trap, and the currency pair is likely to regain its bullish position in the future.
There are two potential areas where the USDCHF currency pair could reverse from its current trend. The first area is relatively early, and if the USDCHF currency pair crosses a specific region, we may have a second safe option that could provide greater stability.
We extend our best wishes and best of luck in your trading endeavours. Your unwavering support is greatly appreciated.
If you wish to contribute, here are several ways you can assist us:
- Like our ideas
- Comment on our ideas
- Share our ideas
Team Setupsfx_🚀❤️

GOLD → Gold not ready to fall? What's going on?FX:XAUUSD is forming a local bottom and is not ready to continue falling. The price is breaking through the downward resistance amid a weakening dollar and a complicated fundamental backdrop.
At the beginning of the week, the price of gold stabilized above $3,250 as investors returned to defensive assets due to ongoing uncertainty surrounding US trade agreements with China and Japan, as well as growing geopolitical tensions in the Middle East and Ukraine.
The weakness of the dollar ahead of the Fed meeting and declining expectations of a rate cut are also supporting demand for gold. The focus remains on US trade news and the possible hawkish tone of the Fed this week.
Technically, the price is testing the bottom of the range as resistance. If there is no reaction to the false breakout and the price continues to storm 3268, then a breakout and consolidation above the level will allow it to strengthen to 3292-3314.
Resistance levels: 3269, 3294, 3314
Support levels: 3243, 3222, 3204
The price is forming a second retest of 3269 since the session opened. Buyers are testing resistance for a breakout. If the bulls break 3269 and consolidate above 3270, the chances for growth will be good. I do not rule out the possibility of a retest of the liquidity zone at 3243 before growth.
Best regards, R. Linda!

CHFJPY: Potential Bearish Move?CHFJPY at a Key Resistance – Potential Bearish Move?
CHFJPY tested a strong daily resistance zone. This is an area that has been challenged multiple times in the past, often triggering significant bearish moves.
There’s a good chance CHFJPY could start another major decline from this zone.
Key support levels where traders may take profits include 171.40, 168.50, and 166.50.
You may find more details in the chart!
Thank you and Good Luck!
❤️PS: Please support with a like or comment if you find this analysis useful for your trading day❤️
Disclosure: I am part of Trade Nation's Influencer program and receive a monthly fee for using their TradingView charts in my analysis.

AI Prediction SOL/USD Trading Plan 24 hours!💰 May 4, 2025 8:52 pm. SOL/USD Trading Plan
Long Scenario
- Entry: Breakout above 148.50 (volume >8,000).
- Stop-Loss (SL): 145.50 (below support).
- Take-Profit (TP): 149.50 (below resistance).
- Trailing Stop: 1.5x ATR ($0.77).
- Confirmation: Supertrend (long), MACD bullish crossover, RSI >50.
Short Scenario
- Entry: Breakdown below 146.50 (volume >12,000).
- SL: 147.50 (above resistance).
- TP: 145.50 (above support).
- Trailing Stop: 1x ATR ($0.51).
- Confirmation: Supertrend flips short, MACD bearish, CMF <0.

AI ETH Prediction for Next 6–24 Hours!May 4, 2025 4:21 pm. ETH/USD Trading Strategy
Timeframe: Short-Term (Next 6–24 Hours)
Long Scenario
- Entry: Break above 1833.50 (confirmed bullish momentum).
- Confirmation: MACD bullish crossover + RSI > 50.
- Stop-Loss (SL): 1818.00 (below support zone 1820–1825).
- Take-Profit (TP): 1838.00 (below resistance 1840).
- Trailing Stop: Activate at 1835.00, trail by 0.5%.
Short Scenario
- Entry : Drop below 1825.00 (bearish breakdown).
- Confirmation: Supertrend remains short + Stochastic RSI reversal.
- Stop-Loss (SL): 1836.00 (above resistance 1833.50).
- Take-Profit (TP): 1815.00 (above support 1815).
- Trailing Stop: Activate at 1820.00, trail by 0.5%.

GBPNZD: Potential Bearish Wave AheadGBPNZD: Potential Bearish Wave Ahead
GBPNZD is forming a Head and Shoulders pattern at the top of its bullish trend, signaling a possible downward move.
Since this is a large pattern, the bearish wave may unfold gradually.
However, if the price consolidates in the current zone and shows sell signals, the downtrend could resume in the coming days or weeks.
Key Support Levels: 2.2000, 2.1870, 2.1730, and 2.1500.
You may find more details in the chart!
Thank you and Good Luck!
❤️PS: Please support with a like or comment if you find this analysis useful for your trading day❤️
Disclosure: I am part of Trade Nation's Influencer program and receive a monthly fee for using their TradingView charts in my analysis.

SPY: Where to next? These are just my thoughts and opinions, not advice.
I forgot to mention in the video, Monday has a bearish forecast. If you pay attention to the Weekly forecast I share in the video, this is more similar to the bullish path (selling into Monday). :-O.
Bit of a longer video because lots to talk about.
Safe trades everyone!

XRP: Critical Levels AheadXRP: Critical Levels Ahead
XRP is nearing confirmation of a bearish pattern on the 4-hour time frame. If the price moves below the neckline, the likelihood of a further decline increases.
The first major target zone is 2.040, which presents a key challenge. A break below this level is crucial for further downside movement; otherwise, the price may take a different path.
If XRP falls through 2.040, selling pressure could strengthen, increasing the chances of a deeper decline towards 1.930 and 1.780, as indicated on the chart.
You may find more details in the chart!
Thank you and Good Luck!
❤️PS: Please support with a like or comment if you find this analysis useful for your trading day❤️

Where will EURUSD go next? 4hr1. Technical Analysis
• Bearish Structure Break
After a strong bullish impulse in March and early April, price formed a rising wedge pattern—typically a bearish continuation structure when it follows an uptrend. Price has now broken below the wedge support and is retesting the underside of the structure.
• Key Supply Zone (1.1377–1.1444)
Price failed to break through this resistance twice, forming a double top with strong wicks and rejection candles. That zone remains a key institutional supply area, reinforcing downside bias.
• Break and Retest Confirmation
The break of the ascending trendline and horizontal support near 1.1287 confirms a change in structure. Price is now retesting the area as resistance—textbook bearish price action.
• Target Zones
• TP1: 1.1204 – minor demand and previous support
• TP2: 1.1090 – high-probability demand zone and fib confluence
• TP3: 1.0938 – extended move to fill imbalance and hit key structure low
• Stop Loss
Place stop above 1.1377—the recent high and above wedge resistance—to maintain a good risk-to-reward ratio.
2. Fundamental Analysis
• ECB–Fed Divergence
Recent comments from the ECB suggest a potential rate cut in the near term as inflation cools across the Eurozone, while the Fed remains relatively hawkish due to persistent U.S. core inflation. This divergence supports USD strength.
• Weak Eurozone Data
Recent German and French PMI data came in under expectations, pointing to slowing growth. Meanwhile, the U.S. economy continues to show resilience—especially in labor and retail sales—boosting USD demand.
• Risk Sentiment
As global markets flirt with risk-off sentiment due to geopolitical tensions and slower growth forecasts, safe-haven demand increases—typically favoring the U.S. dollar over the euro.
Conclusion
EUR/USD is showing strong signs of a bearish reversal after rejecting a major supply zone and breaking below wedge and trendline support. With structure, momentum, and fundamentals aligned, a short setup targeting 1.1204 down to 1.0938 makes sense. Wait for continued rejection or bearish confirmation before entering.

US Stocks Pare Back All Tariff-Fueled Losses. Are We So Back?Remember “Liberation Day”? The one that felt more like Liquidation Day ? When markets tanked, tickers turned red, and you were afraid to check the markets on the next day? Well, turns out the rumors of the market’s demise were — once again — greatly exaggerated.
If the average recession 10 years ago lasted two years, this year’s recession was approximately 37 minutes (more or less, depending on the day).
Just a month ago, the S&P 500 SP:SPX started crumbling to the point it entered into correction territory (and then got out of correction territory ).
Long story short, it took the punches, went down 15%, stood back up, and is now throwing jabs with a nine-day winning streak — its longest since 2004, when iPods were still a thing and Facebook was just for Harvard students.
So… are we back? Like, really back? Let’s dig in.
💰 Trillions Lost, Trillions Found
On April 2, President Donald Trump dropped the hammer — or rather, the online post — unveiling his “reciprocal tariffs,” which, in true Trumpian fashion, sounded equal parts policy and promo PR.
Markets didn’t take it well. Global stocks collectively threw a tantrum. The S&P 500 dropped like it had a brick in its pocket . Financials cratered, energy took a gut punch, and tech? See for yourself — we don't want to talk about it .
But now? The dip buyers are shopping up, scooping up, snapping up everything from banks to oil stocks to beleaguered megacaps. Suddenly, all those stock discounts look like missed opportunities, and the cash-on-the-sidelines traders are jumping in.
👌 Jobs Data: Not Too Hot, Not Too Cold
Friday was a good day. Why? Because April’s nonfarm payrolls ECONOMICS:USNFP report came in at 177,000 jobs — not too strong to trigger Fed-tightening fears, not too weak to imply economic decay. It was the goldilocks print.
The number was a drop from March’s revised 185,000, but what mattered was the beat: economists had pencilled in just 135,000. Markets took that as permission to throw a party.
The S&P 500 jumped 1.5%, reclaiming the level it had before Trump’s tariff tirade and putting an emphatic end to the selloff. Nine green days in a row? That’s a bull flex Wall Street hasn’t seen in two decades.
💥 Truth Social Posts That Move Markets
Not to be left out of the celebration, Trump hopped onto Truth Social with his usual caps lock enthusiasm:
“THE FED SHOULD LOWER ITS RATE!!!”
Sounds familiar?
Still, even without a rate cut (for now), the market got what it wanted: signs that the US labor market isn’t collapsing, trade talks might be back on the table, and the economy hasn’t lost its way.
😌 A Global Sigh of Relief
While the US led the rally, global markets also joined the rebound chorus. China’s commerce ministry chimed in Friday, saying Washington had expressed a “desire to engage in discussions.” In market-speak, that translates to: "Everyone calm down — we might not blow this up after all."
It doesn’t take much to change sentiment. A tweet here, a headline there, a hint of diplomatic progress — suddenly risk appetite returns and everyone forgets they were panic-selling just three weeks ago.
But don’t go lining up the espresso martinis just yet — not everything is fully recovered. The US dollar, for example, remains nearly 4% below its pre-tariff-announcement level.
🤔 We Are So… Back?
So are we officially back? Short answer — “put the word out there that we back up” for now . Markets are up, volatility is down, and everyone’s pretending they didn’t sell the dip at the worst possible time.
But — and you knew there’d be a “but” — caution still applies. Trade tensions aren’t over. The next Trump post could shake things again. The Fed hasn’t made its next move (that’s coming this Wednesday). And geopolitics remains a powder keg.
Still, what this rebound tells us is clear: the market has resilience. Maybe not logic. Maybe not grace. But resilience? Yes.
It also reminds us that trying to time news-driven selloffs is a dangerous game. Often, the best trades happen when fear peaks and everyone else is running for the hills.
👉 Final Thoughts: Watch the Calendar, Not the Chaos
The key takeaway from this tariff-to-rally rollercoaster? Markets can move fast — but they can also recover faster. If you panicked, you probably sold low. If you stayed focused, checked the earnings calendar , and remembered that market narratives shift like wind direction, you're probably doing well right now.
We’re so back — for now. But stay sharp. This market may have nine lives, but it also has the attention span of a toddler.
Your move : Did you ride the dip? Buy the bounce? Or just mute the chaos and sip your coffee? Drop your best “Liberation Day to Redemption Rally” trade below.

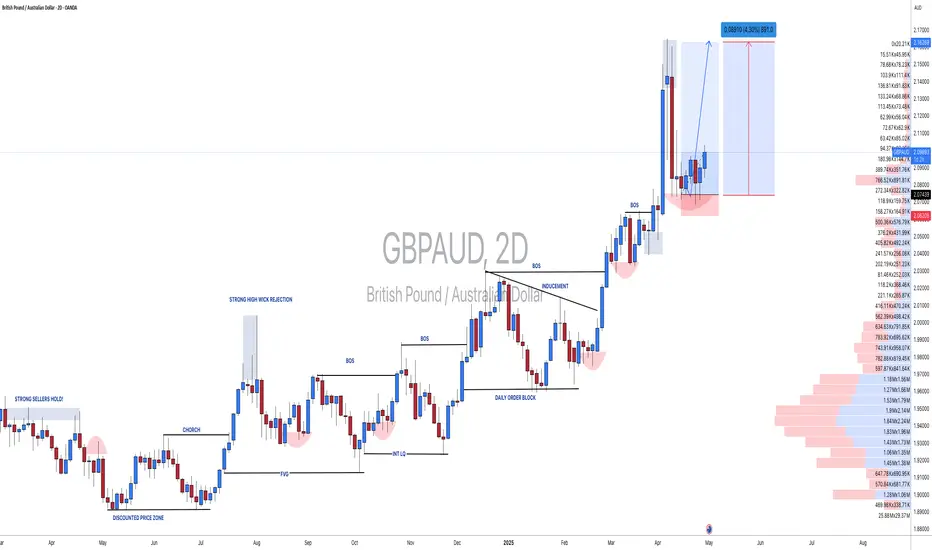
#GBPAUD: +245 From Previous Analysis, 880+ Total Pips TargetIn our previous analysis, we clearly indicated our entry point, and the price followed suit, reversing straight and currently up 245+ in positive. Going forward, we expect a straight, clean move of 800+ points. If you missed this entry, there will be a correction within the next 4 hours. Just analyse the pinpoint and enter accordingly with proper risk management.
Good luck and trade safely!
Thank you for your unwavering support! 😊
If you’d like to contribute, here are a few ways you can help us:
- Like our ideas
- Comment on our ideas
- Share our ideas
Team Setupsfx_
❤️🚀
USDCAD → Storming the support level to break throughFX:USDCAD continues to storm support within the trading range amid a global downtrend
The currency pair is within the range, but the battle for support continues. The reaction to false breakouts is weakening and the price continues to attack the 1.378 level, which only increases the chances of a further decline
The dollar is rebounding from resistance and beginning to fall, which is having a corresponding effect on USDCAD. If the currency pair breaks 1.378 and consolidates below the level, this could trigger a continuation of the trend after consolidation...
Resistance levels: 1.381, 1.383
Support levels: 1.378, 1.374
Focus on the lower boundary of the trading range at 1.378. The role of the range is consolidation against the backdrop of a downtrend. Thus, a breakout of support will activate the distribution phase
Best regards, R. Linda!

Eurusd scenario 05/05/2025English : According to our analysis, we anticipate a bearish scenario.
Morocan Darija : kanchofo d'apres l'analyse dyalna antsanaw hboot
ATENTION : I only share my ideas, not signals

SUIETH bull 3-6 monthsSUIETH bull 3-6 months bull signal based on fundamentals and cyclicality of refinancing debt in the world

EUR/AUD Bearish Channel with Key Support Ahead📉 Market Structure Analysis (Bearish Bias)
Current Trend:
The pair is trading within a well-defined descending channel, indicating a bearish trend. Price action is forming lower highs and lower lows, adhering to the channel boundaries.
Moving Averages (EMA):
EMA 50 (Red) at 1.77491 is above the price, acting as dynamic resistance.
EMA 200 (Blue) at 1.73338 is close to current price, likely to act as a support area in the short term.
The bearish crossover between the 50 EMA and current price supports the continuation of downward momentum.
🔍 Key Zones:
Weak Resistance Zone:
Located around 1.7740 – 1.8000, previously a support area, now acting as resistance.
Price rejection from this zone multiple times indicates sellers' strength.
Support Zone:
Located around 1.6950 – 1.7100, where demand may return.
This zone coincides with the lower boundary of the descending channel, making it a likely reaction zone.
📊 Forecast / Expectation:
The chart projects a bear flag / corrective pullback before another leg downward toward the support zone.
If price breaks and sustains below the EMA 200, it will likely accelerate bearish pressure.
The descending channel suggests potential continuation to the downside unless price breaks out of the upper boundary with momentum.
✅ Trade Implications:
Bearish Setup:
Look for short opportunities on intraday pullbacks near the resistance or EMA 50.
Bullish Invalidations:
A breakout above the descending channel and sustained move above 1.7800 would invalidate the bearish outlook.
Conclusion:
This chart presents a technically clean bearish setup. The confluence of a descending channel, EMA rejection, and defined resistance/support zones suggests the EUR/AUD may continue lower, especially if it loses the 1.7300 level decisively.

XAU/USD Market Outlook – Key Levels & Scenarios (May 2025)📊 Market Overview
Asset: XAU/USD (Gold vs. USD) – likely
Timeframe: 🕒 4H or Daily
EMAs:
🔴 50 EMA = 3,281 (short-term trend)
🔵 200 EMA = 3,179 (long-term trend)
🧱 Key Zones
🔺 Main Resistance Zone (🚫 Supply Area)
📍 ~3,320–3,400
🔍 Observation: Strong rejection zone with multiple failed attempts. 🚧 Price struggles to break and hold above here.
⚖️ Mid Support & Resistance Zone
📍 ~3,200–3,250
🧭 Current Action: Price is consolidating here. This is a key decision zone. A bounce or breakdown will likely decide the next big move. 🤔
🟦 Main Support Zone
📍 ~2,980–3,030
🛑 Observation: Major demand zone. If price falls here, it might attract buyers 👥 for a potential rebound.
📉 EMA Analysis
🔴 50 EMA is above 🔵 200 EMA → Trend still technically bullish ✅
🟡 BUT: Price is currently below 50 EMA, showing short-term weakness ⚠️
⚡️ 200 EMA is nearby (~3,179): Acting as dynamic support — a critical bounce zone! 🛡️
🔮 Scenarios
🐂 Bullish Path
✅ If price bounces from 3,200 support zone and reclaims 🔴 50 EMA:
🎯 Target: Retest of 3,320–3,400 🔺 zone
📈 Confirmation: Strong candle closing above 3,281 🔴 EMA
🐻 Bearish Path
🚨 If price breaks below 3,200 & 200 EMA:
🕳️ Expect drop towards 2,980–3,030 🟦 zone
📉 Confirmation: Candle closes below 3,179 with weak retest
✅ Conclusion
📍 Key Level to Watch: 3,200
⚖️ Market Sentiment: Neutral → Bearish bias unless price reclaims 50 EMA
🔒 Risk Tip: Avoid longs until price confirms bullish structure again 🔐

Cold shower for bitcoinAs I mentioned earlier — when gold cools down, Bitcoin tends to rise. And when gold climbs, Bitcoin usually takes a breather. Don’t forget this dynamic.

EURUSD Bulls Reloading — Big Week Ahead? FOMCEURUSD has been riding the uptrend for a while now, but we’ve finally hit a bit of a pause. Recently, the pair posted one of its biggest up-days since 2009 — a huge bullish signal — and momentum carried it even higher! 🔥
Now, price has pulled back slightly from the highs, with last week showing a modest dip as the dollar regained some strength. I do expect we could see a little more pullback in the short term… but overall, my bias remains bullish. I believe the uptrend is still intact, and we could see EURUSD push higher again this week! 📈
What’s your view? Are you buying the dip or expecting a deeper correction?
Drop your thoughts below — and if you found this analysis useful, a boost or follow is always appreciated! 🙌

Ratio Charts in TradingView and IAAbove you can see the Bitcoin to Ethereum ratio chart. Ratio analysis between two or more symbols is a critical method for comparing the strength and weakness of assets relative to each other. TradingView offers basic capabilities for this task, but with the help of artificial intelligence (AI) and custom scripts, much more advanced and creative analyses can be conducted.
Here are some practical ideas:
1. Creating Conditional Ratio Scripts
2. Comparing Relative Averages and Issuing Smart Signals
3. Calculating Composite Ratios of Multiple Assets
4. Smart Alerts Based on Price Pattern Breakouts
For more information, search Google for "How to Use Ratio Charts in TradingView: A Hidden Gem for Traders."

USDJPY Analysis Today: Technical and Order Flow !In this video I will be sharing my USDJPY analysis today, by providing my complete technical and order flow analysis, so you can watch it to possibly improve your forex trading skillset. The video is structured in 3 parts, first I will be performing my complete technical analysis, then I will be moving to the COT data analysis, so how the big payers in market are moving their orders, and to do this I will be using my customized proprietary software and then I will be putting together these two different types of analysis.

"Bitcoin Analysis" (Update)Here's what I can gather from the chart right now:
The Minor Resistance zone has been strongly broken to the upside; we haven't seen good pullbacks to this level yet.
On the other hand, below the broken zone, there's a price gap toward the FVG, as indicated by the arrow.
Also, the pullback to the breakout level at 0.382 has not been completed, and no patterns have formed in that area!
So? When we analyze all the breakout factors, we see a very high chance of a correction.
Now, this correction could start from the confirmation level at 96,364, or with an overextension, it could happen from the 98k zone.
Stay Awesome , CobraVanguard

"...I'm tired, I'm leaving..."Well, that’s it — Bitcoin is tired of resisting the bears. As long as there was enough buy volume, the bears were offloading quietly. But now, we’re heading down.
Happy May holidays, everyone. I’ll post a more detailed update tomorrow — stay tuned!
