GBP/JPY Bullish Flag (29.04.2025)The GBP/JPY pair on the M30 timeframe presents a Potential Buying Opportunity due to a recent Formation of a Breakout Pattern. This suggests a shift in momentum towards the upside and a higher likelihood of further advances in the coming hours.
Possible Long Trade:
Entry: Consider Entering A Long Position around Trendline Of The Pattern.
Target Levels:
1st Resistance – 192.18
2nd Resistance – 192.70
🎁 Please hit the like button and
🎁 Leave a comment to support for My Post !
Your likes and comments are incredibly motivating and will encourage me to share more analysis with you.
Best Regards, KABHI_TA_TRADING
Thank you.
Fundamental-analysis

Fundamental Market Analysis for April 29, 2025 EURUSDEUR/USD is down to 1.14150 in the early Asian session on Tuesday. The euro (EUR) is weakening against the US dollar (USD) amid rising bets for further rate cuts by the European Central Bank (ECB) in June. Investors expect further US trade policy developments ahead of the release of the much-anticipated US Non-Farm Payrolls (NFP) data on Friday.
US President Donald Trump said progress is being made and he has spoken to Chinese President Xi Jinping, although Beijing denies that trade talks are underway. U.S. Treasury Secretary Scott Bessent said he spoke with Chinese authorities last week but did not mention tariffs.
On Monday, Bessent said the U.S. government is in contact with China, but it is up to Beijing to take the first step to de-escalate the tariff fight with the U.S. over the trade imbalance between the two countries. Investors will be keeping a close eye on the US-China relationship. Trump's chaotic trade policies have undermined faith in US assets and the common currency has become an alternative destination for investors' cash. Any signs of an escalating trade war between the US and China could have a negative impact on the US dollar and serve as a tailwind for EUR/USD.
On Saturday, Reuters reported that ECB policymakers are increasingly confident of cutting interest rates in June as inflation continues to fall. On Monday, ECB chief Olli Rehn said the central bank may cut interest rates below the neutral level that keeps the economy in balance.
Trading recommendation: SELL 1.13800, SL 1.14000 , TP 1.13000

Bitcoin surpasses Google: Why BTC rallied to $94,000In April 2025, Bitcoin once again captured the spotlight by breaking above $94,000, reaching a market capitalization of $1.86 trillion. This surge pushed BTC ahead of Alphabet (Google’s parent company), making it the fifth-largest asset in the world.
The impressive rally in Bitcoin this year has been fueled by a combination of macroeconomic factors and developments within the crypto space itself. New financial instruments, political shifts, and technological advancements have made Bitcoin more appealing and accessible to a wide range of investors.
5 key drivers behind Bitcoin’s growth in 2025:
1. Approval of spot Bitcoin ETFs in the U.S.: For the first time, the SEC greenlit spot Bitcoin ETFs, allowing major institutional players to gain exposure through regulated investment products. This triggered a significant inflow of capital into the crypto market.
2. Weakening dollar and stock market declines: As global economic growth slowed and the U.S. dollar lost ground, Bitcoin emerged as a hedge asset — often compared to gold — with investors seeking safer alternatives to traditional markets.
3. Pro-crypto political climate in the U.S.: The new U.S. administration has adopted a supportive stance on crypto, easing regulations and even announcing plans to build national crypto reserves. This strengthened investor confidence across the market.
4. Bitcoin’s growing role as ‘Digital Gold’: The perception of Bitcoin as a long-term store of value continues to rise. More large investors and corporations are now including BTC in their asset diversification strategies.
5. Technological advancements: The rollout of second-layer solutions like the Lightning Network has made Bitcoin transactions faster and cheaper. This has improved real-world usability and expanded the global user base.
In 2025, Bitcoin continues to gain momentum, breaking new records and cementing its role as one of the world’s most important financial assets. The combination of spot ETF approvals, political backing, macroeconomic shifts, and ongoing tech innovation has created fertile ground for its growth. With each passing day, BTC becomes increasingly attractive to both institutional and retail investors — setting the stage for further gains in the coming years.
Still, Bitcoin’s future will depend on how crypto regulations evolve, the pace of technological breakthroughs, and global economic conditions.

[TechnoFunda]IDFC FIRST BANK – DEEP DIVE INTO MULTI-YEAR SUPPORTTECHNICAL ANALYSIS:
Ascending broadening channel structure
– Since the Aug-20 low (~₹15) price has traced a steady up-sloping trendline, touching in Mar-21, Feb-22 and now Apr-25
– Parallel resistance capped rallies in Feb-18 and Sep-23, defining a ~₹80–100 supply zone
– Channel slope averages ~30% annualized gains from support to resistance
EMA confluence and momentum
– April formed a bullish engulfing candle that closed above the 50 EMA (₹63.8), signalling renewed buyer conviction
Elliott-style wave count
– Wave 1: Aug-20 to Feb-23 advance into channel top (₹100)
– Wave 2: Feb-23 to Apr-25 retrace back to support/200 EMA (₹55)
– Wave 3 (projected): expected to carry price toward channel top again, targeting ₹95–100
Measured-move & targets
– Channel height (~₹85–15 = ₹70) added to support gives a potential target near ₹125 – bullish scenario only on a clean break above channel resistance
– Shorter-term target zone: ₹75 (minor swing highs) → ₹85 (channel midline)
Risk management
– Invalidation: monthly close below ₹55 erodes the uptrend and negates wave-count
– Use a stop 1.5× ATR below the Apr-25 low (₹50) for defined risk
FUNDAMENTAL ANALYSIS:
Revenue & earnings trajectory
– Quarterly revenue up from ~₹40 B in 2020 to ₹113 B in Q1 ’25, reflecting strong loan book growth and fee income diversification
– Net income swung from losses in 2018–19 to a peak of ~₹12 B in 2023, and stays positive at ₹3 B in the latest quarter
Asset-quality improvement
– GNPA ratio down from ~2.2% in 2020 to ~1.3% in Q1 ’25; PCR steadily rising above 75%
– Slippages have trended lower quarter-on-quarter, supporting margin stability
Margin & capital metrics
– Net interest margin at ~4.2%, above industry average, driven by retail and SME lending
– CET-1 ratio comfortably above 13% with Tier-1 capital buffer, enabling healthy credit growth
Valuation & catalysts
– Trades at ~0.4× book value and 10× trailing P/E vs sector averages of 1.5× and 15× respectively
– Potential rerating catalysts: continued NIM expansion, sustained reduction in credit cost, digital customer growth
MACRO & SENTIMENT CONTEXT:
- RBI rate cycle poised for cuts in H2 ’25, which could support credit demand
- Bank Nifty outperforming broader markets; institutional flows have rotated into midcap banks
- Relative strength vs Nifty: RSI on a monthly sits near 50, rising from oversold – room to run before overbought
TRADING PLAN:
- Enter partial long near current price (₹66–70)
- Add on break above ₹75 with conviction
- Targets: ₹75 → ₹85 → ₹95–100 (channel top)
- Stop-loss: ₹50–55 zone (monthly close basis)
- Trail stops above each new swing low to lock in profits as price advances

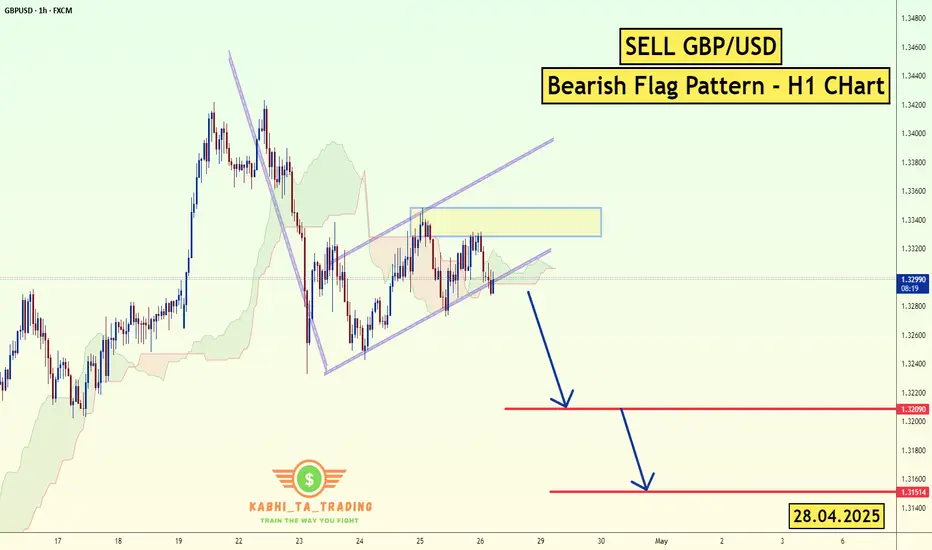
GBP/USD - H1 - Bearish Flag (28.04.2025)FX:GBPUSD The GBP/USD Pair on the H1 timeframe presents a Potential Selling Opportunity due to a recent Formation of a Bearish Flag Pattern. This suggests a shift in momentum towards the downside in the coming hours.
Possible Short Trade:
Entry: Consider Entering A Short Position around Trendline Of The Pattern.
Target Levels:
1st Support – 1.3209
2nd Support – 1.3151
🎁 Please hit the like button and
🎁 Leave a comment to support for My Post !
Your likes and comments are incredibly motivating and will encourage me to share more analysis with you.
Best Regards, KABHI_TA_TRADING
Thank you.
Fundamental Update :
on Monday as the trade tensions between the U.S. and China provided some relief to investors, while a stronger dollar further weighed on prices.
The U.S. dollar TVC:DXY rose 0.2% against a basket of currencies, making bullion more expensive for overseas buyers. TVC:DJI SP:SPX NASDAQ:IXIC also rising .
Range Tightens on Gold – Breakout or Breakdown Ahead?📌 Trading Plan for April 28, 2025: Gold (XAU/USD) Strategy 🧠📈
📊 Technical Analysis
Following the sharp drop in previous sessions, gold is now consolidating around the 3260–3270 support zone.
Price is moving within a tight triangle formation on the M15 timeframe, indicating compression ahead of a breakout.
The MA 13 – 34 – 200 still suggests a short-term bearish bias, but selling momentum has noticeably slowed down.
Expectation: gold may retest the 3299–3313 resistance zone before a stronger directional move.
🎯 Key Price Levels for Today
Immediate Resistance: 3299 – 3313
Major Support: 3260 – 3258 – 3239
🧩 Updated Trade Setup
🔵 BUY ZONE:
Entry: 3260 – 3258
Stop Loss (SL): 3254
Take Profit (TP): 3264 → 3268 → 3272 → 3276 → 3280
🔴 SELL ZONE: (after price retests resistance)
Entry: 3299 – 3301
Stop Loss (SL): 3306
Take Profit (TP): 3295 → 3290 → 3286 → 3282 → 3275
📢 Important Notes
Expected daily range: 60–80 pips.
No major economic news today, but stay alert for unexpected political headlines (especially from the US, China, India-Pakistan tensions).
Strictly follow TP/SL levels to protect your capital — avoid FOMO chasing after sharp intraday moves.
✅ Conclusion
Gold remains in a sensitive consolidation phase.
The best strategy today is buying at support and selling at resistance, only scaling in after clear confirmations!
💬 How are you planning to trade gold today? Share your views and setups below! 👇👇👇

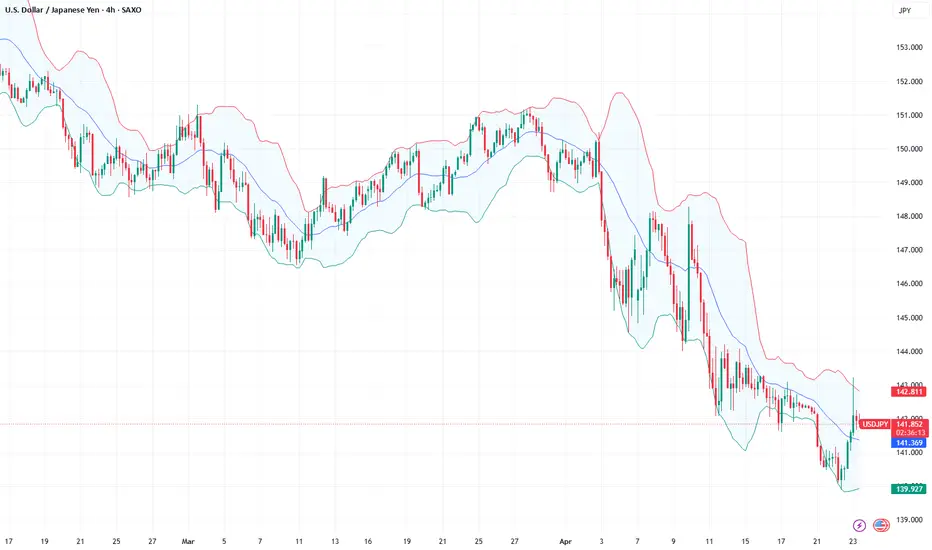
Fundamental Market Analysis for April 28, 2025 USDJPYUSDJPY:
The Japanese yen (JPY) fluctuated in a narrow range in Monday's Asian session and paused its recent pullback from a multi-month high reached last week against its U.S. counterpart. U.S. Treasury Secretary Scott Bessent did not support President Donald Trump's statement that tariff talks with China are underway. That tempered optimism about a quick resolution to trade tensions between the world's two largest economies and provided some support for the safe-haven yen.
Meanwhile, traders pushed back expectations of an immediate interest rate hike by the Bank of Japan (BoJ) due to rising economic risks from US tariffs. However, signs of rising inflation in Japan leave the door open for further BoJ rate hikes this year, which is a big divergence from bets on more aggressive Federal Reserve (Fed) policy easing. This keeps USD bulls on the defensive and also serves as a tailwind for the low-yielding Yen.
Trading recommendation: SELL 143.20, SL 143.60, TP 142.50

Peace Headlines Are Here — But Markets Have Already Moved OnA Russia-Ukraine peace deal making headlines right now is historic news — politically and emotionally.
But for the forex and commodities markets?
The real money already left this story behind months ago.
🧠 Smart Money Knows: Markets Price in the Future, Not the Past
Two years ago, the war sent shockwaves through oil, gas, wheat, and risk currencies.
By late 2023, price action had already normalized — the "war premium" faded out quietly.
Commodities stabilized. Forex volatility shifted. Safe havens lost their edge.
Traders adapted, recalibrated, and moved on to new battlegrounds.
Bottom Line:
The market already priced in a future where this conflict would eventually fade — peace or no peace.
📊 What Actually Drives Forex Now
While peace headlines grab attention, the real macro drivers today are:
🔥 Tariff escalation and global trade wars
🔥 Sticky inflation battles (core services inflation still high)
🔥 Central bank pivot games (Fed, ECB, BoJ)
🔥 Global growth fears (China slowdown, EU stagnation)
This is where new money is flowing.
Not into a two-year-old headline finally catching up.
🛡️ "Buy the Rumor, Sell the Fact" in Action
For two years, markets have priced in an eventual end (or fade) to the Ukraine conflict.
A peace agreement now?
→ It confirms expectations, not shocks them.
→ It may trigger a short-lived risk-on pop (EUR, AUD, NZD up, gold down) —
→ But unless it unleashes massive new money flows (unlikely), that pop gets sold.
🔥 Final Thought:
If you're still trading the last war, you're already late.
The next major moves won't come from peace headlines — they'll come from tariff escalations, inflation battles, and central bank pivots.
Focus forward.
That's where opportunity lives.
💬 Question for Serious Traders:
Which macro theme are you really watching into summer 2025?
Peace headlines... or the new fires already burning?
Drop your insights below. 👇

TradeCityPro | Deep Search: In-Depth Of ONDO👋 Welcome to TradeCity Pro!
In this analysis, I want to fully review the ONDO project for you. First, I’ll go over the project’s information, and then we'll move on to its technical analysis.
🔹Introduction to Ondo Finance (ONDO)
Ondo Finance is an open and decentralized investment bank designed to bridge the gap between traditional finance and decentralized finance (DeFi). Founded in 2022 and based in the Cayman Islands, Ondo's mission is to democratize access to institutional-grade financial services. Its ecosystem is built to serve a wide range of stakeholders including DAOs, institutional players, and retail investors. Ondo's key innovation lies in tokenizing real-world assets, thereby making them accessible to a broader audience via blockchain technology.
🔹ONDO Token and Governance
The ONDO token plays a central role in the governance of the Ondo decentralized autonomous organization (DAO). Token holders have specific rights within the DAO, particularly over the governance of Flux Finance, which is one of the main platforms in the Ondo ecosystem. ONDO holders are empowered to propose and vote on changes, allocate funds for projects, and influence the platform’s direction, ensuring community-driven governance. The ONDO token sale occurred in mid-2022 and was purchased by over 18,000 individuals.
🔹Technology and Infrastructure
Ondo leverages blockchain technology to offer decentralized financial services. It operates on a secure and transparent distributed ledger system, which ensures that transactions are immutable and resistant to tampering. The platform uses Proof-of-Stake (PoS) as its consensus mechanism to validate transactions, offering both security and energy efficiency. Ondo is also integrated with various DeFi protocols and utilizes techniques from traditional finance to repackage DeFi exposures into institutional-grade risk-return profiles. Strategic partnerships with firms like BlackRock, Morgan Stanley, and Coinbase enhance its interoperability and credibility.
🔹Real-World Use Cases
Ondo's primary application is in the tokenization of real-world assets such as real estate or treasuries. This allows users to invest in fractionalized assets, lowering the barrier to entry for institutional-quality financial products. The platform is used for intellectual property management through blockchain-based records, enabling secure and transparent tracking. Ondo also engages in community events and educational initiatives to raise awareness about blockchain technology. Furthermore, it offers technical and business development services such as smart contract deployment and treasury management to startups and institutions.
🔹Key Developments and Milestones
In 2022, the Ondo DAO was officially launched, providing a decentralized governance framework. Following that, the foundation introduced Flux Finance, a major protocol under Ondo DAO governance. The Ondo Foundation has formed several partnerships to expand its ecosystem and drive innovation. One of the important initiatives includes Ondo USDY LLC, which issues the USDY stablecoin. Ondo has also focused on education, contract deployment, and treasury management, solidifying its operational backbone and long-term strategic vision.
🔹Team and Founders
Ondo Finance was founded by Nathan Allman and a team of former Goldman Sachs digital asset professionals. Nathan Allman brings a strong background in engineering and financial operations, serving as a key driver of the project’s vision. The founding team’s experience in traditional finance has been instrumental in shaping Ondo’s hybrid model, which integrates DeFi tools with institutional-grade strategies.
🔹Fundraising and Token Sale
Ondo Finance has conducted multiple fundraising rounds. An initial coin offering (ICO) took place on CoinList on May 12, 2022, raising $22 million. The token was priced at $0.055, with a minimum purchase of $100 and a maximum of $20,000. Another funding round was the IEO on Gate.io Startup, conducted from January 17 to January 18, 2024, which raised $40,000.
In total, Ondo has raised $46.04 million, including $22.04 million from public sales and $24 million from private and institutional funding rounds.
🔹Tokenomics
The ONDO token has a maximum supply of 10 billion tokens. Distribution is divided as follows: 52.1 percent for ecosystem growth, 33 percent for protocol development, 12.9 percent for private sales, and 2 percent for community access sales. As of now, 33.9 percent of the total supply is unlocked, with another 19.4 percent scheduled for future unlocks. Approximately 46.7 percent remains locked.
🔹Vesting Schedule
The vesting of ONDO tokens is structured into distinct categories. Ecosystem growth tokens are released linearly over five years, with 24 percent unlocked as of January 2024 and 39.2 percent expected to unlock gradually. Protocol development tokens have a one-year cliff, followed by a three-year linear unlock, with 25 percent becoming available in April 2025. Private sales follow the same schedule as protocol development, while community access sales were 90 percent unlocked from the beginning with full linear unlock over one year.
—
Certik: 87.50✅
🔹Top Ondo Wallets
Trust Wallet
imToken
MetaMask
Torus
Coinbase
TokenPocket
iToken Wallet
Binance web3 wallet
🔹Liquidity Pools
Uniswap
Balancer
🔹Top Holders
0x677fd4ed8ae623f2f625deb2d64f2070e46ca1a1
0x460ae5a6666fcb9635ba99b541b31279e59665370x
524083970c7a1e62fbaa61d38781f87a4f191fd0
0xa63eace47618b9677261b09b32e3ca2b5c0a0182
0xd2e6e930e25456ffcd4df0124563cc334f3284f4
🔹Significant TVL Growth in Ondo Despite Sharp Liquidity Decline
Since mid-January 2025, the total value locked (TVL) in Ondo has increased from 157,000 ETH to 631,000 ETH, reflecting significant growth in its TVL. However, in terms of liquidity, Ondo has experienced a sharp decline since late March, with a drop of nearly 50% compared to the previous month.
🔹On-Chain Analysis of ONDO
Looking at ONDO’s on-chain data, the $0.833 level stands out as a key support zone based on the concentration of tokens currently in profit. On the flip side, the $0.856 area acts as a resistance level, with approximately 124 million ONDO tokens currently held at a loss. However, the volume of tokens in profit remains higher overall, which can be interpreted positively — these zones represent value and may attract increased demand.
From a network activity perspective, there has been a noticeable decline, particularly in the number of new addresses being created.
Analyzing supply and demand, approximately 75% of ONDO tokens are held by whales, indicating strong whale dominance. Address-level data shows that wallets holding between 10 and 100 million tokens have shown minor demand, while older holders are contributing meaningful inflows. Additionally, wallets identified as "investor" addresses have also demonstrated renewed buying interest.
👀 Now that we’ve reviewed the project's details, let’s dive into ONDO’s technical analysis.
📅 Weekly Timeframe
In the weekly timeframe, as you can see, there aren't many candles yet, so we can’t perform a complete analysis on this timeframe.
✔️ However, you can observe that after the project launched in January 2024, there was an upward movement up to the 1.3927 area, followed by a correction down to 0.5871.
💥 After this correction, the next bullish leg continued up to the 2.0565 area.
📈 During this bullish cycle, there’s also an ascending trendline that the price has reacted to multiple times, and now it has touched it again.
⚡️ The main support on this timeframe is at 0.5871, and the main resistance is at 2.0565. So, if you already hold ONDO and are considering setting a stop-loss, breaking 0.5871 could be a good point to activate it.
🔽 This level can also be used as a trigger for a short position. Breaking 0.5871 could create a downtrend in ONDO.
🛒 For spot buying, the main trigger is breaking 2.0565, and if this level is broken, the price could register a new ATH.
📅 Daily Timeframe
In the daily timeframe, as you can see, the price has been supported by the trendline and has shown a very quick reaction, with bullish momentum pushing it above the 0.9253 resistance.
📊 Currently, the price has reached the SMA99 and reacted to it. The volume of the candles reacting to the SMA99 has increased, and if the price stabilizes above the SMA99, the main bullish leg could begin.
💫 The next resistance the price faces is at 1.1933, and if the SMA99 is broken, I believe the price can easily rise to this level.
☘️ Moreover, if this level is also broken, the price could climb up to 2.0565.
📉 For ONDO to turn bearish on this timeframe, the first trigger would be a fake breakout above 0.9253.The main bearish trigger would be breaking both the trendline and the 0.7122 level.
📝 Final Thoughts
This analysis reflects our opinions and is not financial advice.
Share your thoughts in the comments, and don’t forget to share this analysis with your friends! ❤️

Gold Retreats After Trump Confirms China Talks 📌 Gold Retreats After Trump Confirms China Talks – Political Noise Drives Volatility 🧨📉
Gold (XAU/USD) saw a sharp intraday drop following comments from President Trump, who confirmed that trade talks with China are “ongoing” — despite China denying any official negotiations had taken place. The market interpreted this as a signal of de-escalation, prompting a short-term price correction.
Gold had previously rallied past $3,500/oz, supported by a weaker USD and strong demand from bargain hunters after last week’s sharp decline. However, the current political contradictions and tariff headlines are creating erratic moves across all asset classes.
🌍 Fundamental Context
The USD weakened, stocks lost momentum, and risk sentiment shifted after a confusing round of statements from the US and China.
Meanwhile, US jobless claims rose slightly, reflecting a resilient labour market amid tariff-related headwinds.
Today’s Core Retail Sales data in the US could add more volatility heading into the weekly candle close.
It’s Friday — expect possible liquidity sweeps and aggressive price spikes as the market prepares for weekend risk-off moves.
📊 Trading Outlook – 26 April
We're seeing signs of a tactical pullback, but long setups should be delayed until political headlines stabilise. Focus on intraday reaction zones — not aggressive positioning.
🔻 SELL ZONES
3384 – 3386
• SL: 3390
• TP: 3380 → 3376 → 3372 → 3368 → 3364 → 3360 → ???
3406 – 3408
• SL: 3412
• TP: 3400 → 3396 → 3392 → 3388 → 3384 → 3380 → 3370 → 3360
🟢 BUY ZONES
3288 – 3286
• SL: 3282
• TP: 3292 → 3296 → 3300 → 3304 → 3310
3270 – 3268
• SL: 3264
• TP: 3274 → 3278 → 3282 → 3286 → 3290
🛡️ Final Notes & Strategy
Avoid rushing BUY entries — allow Price to complete its corrective phase and wait for structure and confirmation.
Today’s Core Retail Sales (US) could trigger a fresh wave of volatility.
It’s also weekly close Friday, so prepare for potential false breaks and stop hunts.
✅ Stick to your TP/SL. Protect your capital first — clarity will come when the dust settles.
💬 Are you watching for a short-term bounce or planning to fade strength near resistance? Let us know in the comments below! 👇👇👇

9 Simple Ratios Every Great Investor Uses - Buffett Included!Forget the hype, headlines, or hope. These 9 financial ratios are what real investors actually use to pick winners, but...
P/E? ROE? EPS? 🧐
- What are they, or better yet, WHO are they? 🤯
- How high is “too high”?
- Is a low number always good, or just a trap?
- Do all industries follow the same rules… or is that another myth?
Buffett. Greenblatt. Graham. Lynch.
They didn’t rely on vibes — they trusted fundamentals
After years of relying on charts, I built a 9-point fundamentals checklist to filter stocks faster and smarter. Now I’m sharing it with real-life examples and key insights to help you spot what really makes a stock worth owning:
Easy enough for new investors diving into fundamentals
Sharp enough to level up seasoned pros
Real enough to avoid hype
…but the truth is: these numbers did flag companies like Amazon, Apple, and Nvidia before the market gave them credit.
-----------------------------------------------------
✅ Quick Reference Table
Scan the table, then dive into the stories…
First Pro Tip: Bookmark this. You’ll check these before every stock pick.
-----------------------------------------------------
📊 1. P/E Ratio | Price-to-Earnings
What it tells you: How much you pay for each dollar of a company’s profit.
Short Example: A P/E of 20 means you pay $20 for $1 of profit. High P/E? Expect big growth or risk overpaying.
Strong: Between 15 and 25
Caution: Above 30 (unless fast growth)
Industry Averages:
- Tech: 25–40
- Utilities: 10–15
- Consumer Staples: 15–20
- Energy: 10–20
- Healthcare: 20–30
Story: In early 2023, NVIDIA’s P/E ratio hovered around 25, near the low end for tech stocks. Investors who saw this as a steal amid the AI boom were rewarded—NVIDIA’s stock made 4x by the end of 2024 as AI chip demand soared.
Contrast that with Tesla in Q1 2025, when its P/E spiked above 40 with slowing sales and Tesla’s stock dropped 50% in weeks.
Pro tip: A low P/E is not always good. If growth is weak or falling, it's often a trap.
Example: A utility company with a P/E of 30 is probably overpriced. A tech stock with 35 might still be fair — if growth justifies it.
-----------------------------------------------------
🧠 2. PEG Ratio | Price-to-Earnings-to-Growth
What it tells you: If a high P/E is worth it based on future profit growth. Whether the earnings growth justifies the price.
Short Example: A PEG below 1 means you’re getting growth at a fair price. High PEG? You’re overpaying.
Strong: Below 1
Caution: Above 2
Industry Averages:
- Software: below 1.5 is solid
- Consumer Goods: Below 2 is more realistic
- Tech: Below 1
- Consumer Staples: Below 1.5
- Healthcare: Below 1.2
- Financials: Below 1.5
- Energy: Below 1.3
Story: In mid-2022, Salesforce’s PEG was 0.8 (P/E 35, forward EPS growth 45%) as cloud demand surged. Investors who spotted this steal saw the stock climb 130% by the end of 2024. Meanwhile, Peloton in 2023 had a P/E of 20 but near-zero growth (PEG above 3). Its stock cratered -50% as fitness trends faded.
Story: NVIDIA’s PEG hit 0.9 in Q3 2023 (P/E 30, growth 35%) during AI hype, a steal for tech (average PEG below 1.2).
PEG filters hype. A stock can look expensive until you factor in growth.
-----------------------------------------------------
🧱 3. P/B Ratio | Price-to-Book
What it tells you: How much you pay compared to what the company owns (like buildings or cash).
Short Example: A P/B below 1.5 means you’re paying close to the company’s asset value. High P/B? Expect strong profits or risk.
Strong: Below 1.5
Caution: Below 1 + poor earnings = value trap
Industry Averages:
- Banks: Below 1.5
- Insurance: Below 1.3
- REITs: Use NAV (aim below 1.2)
- Tech: Often ignored
- Energy: Below 2
Story: In 2024, JPMorgan Chase’s P/B was 1.4, solid for banks (average below 1.5). Investors who bought enjoyed 100% gains.
n 2023, Bed Bath & Beyond’s P/B fell below 1 with collapsing earnings. It looked cheap but filed for bankruptcy that year.
Tip: Only use this in asset-heavy sectors like banking or real estate.
-----------------------------------------------------
⚙️ 4. ROE | Return on Equity
What it tells you: How well a company turns investor money into profits.
Short Example: An ROE above 15% means the company makes good money from your investment. Low ROE? Weak returns.
Strong: Above 15%
Caution: Below 10% unless in slow-growth industries
Industry Averages:
- Tech: 20–30%
- Consumer Staples: 15–25%
- Utilities: 8–12%
- Financials: 10–15%
- Healthcare: 15–20%
Story: Coca-Cola (KO) has kept ROE above 35% for years, a sign of brand power and pricing strength.
Eli Lilly’s (LLY) ROE stayed above 25% from 2022–2024, a healthcare leader (average 15–20%). Its weight-loss drug Mounjaro drove consistent profits, lifting the stock 150%+ in two years. Checking ROE trends helped investors spot this winner.
Tip: If ROE is high but D/E is also high, be careful, it might just be leverage.
-----------------------------------------------------
💰 5. Net Margin | Profitability
What it tells you: How much profit a company keeps from its sales or what % of revenue ends up as pure profit.
Short Example: A 10% margin means $10 profit per $100 in sales. Low margin? Tough business or high costs.
Strong: Above 10-15%+
Caution: Below 5%
Industry Averages:
- Software: 20–30%
- Retail: 2–5%
- Manufacturing: 8–12%
- Consumer Staples: 10–15%
- Energy: 5–10%
- Healthcare: 8–15%
Story: Walmart’s (WMT) 2% net margin looks tiny — but it’s expected in retail.
A software firm with 5%? That’s a warning — high costs or weak pricing.
In 2023, Zoom’s (ZM) net margin fell to 5% (down from 25% in 2021), well below software’s 20–30% average. Pricing pressure and competition crushed its stock quite a lot. Meanwhile, Apple’s 25% margin in 2024 (tech average 20%) remained a cash cow.
Tip: Margins show whether the company owns its pricing or competes on price.
-----------------------------------------------------
💣 6. D/E Ratio | Debt-to-Equity
What it tells you: How much debt a company uses compared to investor money.
Short Example: A D/E below 1 means more investor cash than debt. High D/E? Risky if profits dip.
Strong: Below 1
Caution: Above 2 (except REITs or utilities)
Industry Averages:
- Tech: 0–0.5
- Industrials: 0.5–1.5
- REITs: 1.5–2.5 (manageable due to structure)
- Utilities: 1–2
- Energy: 0.5–1.5
Story: In 2024, Tesla’s D/E dropped below 0.3 (tech average 0–0.5) as it paid down debt, signaling strength despite sales dips - a massive rally afterward.
Tip: Rising debt + falling profits = a storm coming. Always check both.
-----------------------------------------------------
💵 7. Free Cash Flow (FCF)
What it tells you: Cash left after paying for operations and growth investments.
Short Example: Apple’s $100 billion cash pile in 2024 funded stock buybacks, boosting shares. Low cash? Trouble looms.
Strong: Positive and growing
Caution: Negative for multiple years
Sector notes:
- Tech: Lots of cash (think billions)
- Industrials: Up and down, check trends
- REITs: Look at FFO (cash from properties), aim high
- Energy: Has cash, but swings with oil prices
- Healthcare: Steady cash, not too high
Story: Netflix had negative FCF while scaling content. Once costs stabilized, FCF turned positive and stock re-rated sharply.
Pro tip: Profits don’t mean much without real cash. FCF is often more honest.
Cash is king: Companies need cash to pay bills, reduce debt, or fund growth. If FCF is falling, they might be burning through cash reserves or borrowing, which isn’t sustainable.
Potential issues : This mismatch could signal problems like poor cash collection, heavy spending, or even accounting tricks to inflate profits.
-----------------------------------------------------
🚀 8. EPS Growth | Earnings Power
What it tells you: How fast a company’s profits per share are growing.
Short Example: EPS up 10% yearly means more profit per share, lifting stock prices. Flat EPS? No growth, no gains.
Strong: Above 10%
Caution: Below 5%, flat/negative for 3+ years
Industry Averages:
- Tech: 15–30%
- Staples: 5–10%
- REITs: 3–6% (via FFO growth)
- Healthcare: 10–15%
- Financials: 5–10%
- Energy: 5–15% (cyclical)
Story: In Q1 2024, NVIDIA’s forward EPS growth of 30% (tech average 20%+) fueled a rally as AI chips dominated. Checking forward estimates helped investors avoid traps like Intel, with flat EPS and a drop.
Pro tip: A stock with flat EPS and no dividend? There’s no reason to own it.
-----------------------------------------------------
💵 9. Dividend Yield | Passive Income
What it tells you: How much cash you get yearly from dividends per dollar invested.
Short Example: A 3% yield means $3 per $100 invested. High yield? Check if it’s sustainable.
Good: ~3–4%
Red Flag: Above 6% with a payout ratio above 80-90%
Industry Averages:
- Utilities: 3–5%
- REITs: 3–6%
- Consumer Staples: 2–4%
- Tech: 0–2%
- Energy: 2–5%
-----------------------------------------------------
💡 Final Thought: How to Use All of This
Top investors don’t use just one metric. They look at the whole picture:
Good growth? Check PEG.
Good profits? Confirm with ROE and margin.
Safe balance sheet? Look at D/E and cash flow.
Fair valuation? P/E + FCF Yield + P/B.
Real power = Combining metrics.
A company with P/E 15, PEG 0.8, ROE 20%, low debt, and positive FCF? That’s your winner.
A stock with P/E 8, but no growth, high debt, and negative cash flow? That’s a trap.
-----------------------------------------------------
Real-World Combos
🎯Winners:
Tech Gem: P/E 20, PEG 0.8, ROE 25%, D/E 0.4, growing FCF, EPS 20%+ (e.g., NVIDIA 2023: AI-driven growth, stock soared).
Energy Steal: P/E 15, P/B 1.5, FCF positive, Dividend Yield 3.5% (e.g., Chevron 2023: Cash flow king).
⚠️Traps:
Value Trap: P/E 8, flat EPS, D/E 2.5, negative FCF (e.g., Peloton 2023).
Overhyped Tech: P/E 50, PEG 3, Net Margin 5%, D/E 1.5 (e.g., Rivian 2024).
-----------------------------------------------------
🚀 Share your own combos!
What do you personally look for when picking a stock?
If you spotted something off in the numbers, or have a valuable insight to add — please, drop it in the comments.👇
💡 Let’s turn this into a thread that’s not just good but superb and genuinely helpful for everyone.
-----------------------------------------------------
Final Thought
“Buy great companies at fair prices, not fair companies at great prices.” – Warren Buffett
This guide gives you the map.
Charts, tell you when.
These numbers tell you what, and why.
And this post?
It’s just the beginning!
These 9 metrics are part one of a bigger series I’m building — where we’ll go even deeper, with more advanced ratios, smarter combos, and real case studies.
If this guide helped you see financial numbers a little clearer, there’s a good chance it’ll help your investor friend too, especially if they’re just starting their journey...🤝Share it with them!
I built this as much for myself as for anyone else who wants to get better.👊
If you made it this far — thank you! 🙏
...and super thankful if you hit "The Boost" on this post 🚀
Cheers,
Vaido

GBP Rebounds on Retail Sales – But USD Still in Control📌 GBP Bounces on Strong Retail Sales, But USD Strength Keeps Pressure On 💷📉
The British Pound (GBP) rebounded on Friday after UK Retail Sales data surprised to the upside. According to the Office for National Statistics (ONS), retail sales rose by 0.4% in March, beating expectations of a -0.4% decline. On a yearly basis, growth accelerated to 2.6%, outpacing the forecast of 1.8%.
However, despite the positive data, traders remain confident the Bank of England (BoE) may still cut interest rates by 25 bps to 4.25% in the May meeting, due to persistent global uncertainties and softer inflation expectations.
Meanwhile, the US Dollar (USD) gained ground across the board as trade tensions between the US and China appeared to ease. Durable Goods Orders in the US jumped by 9.2% in March — a clear sign of business confidence and policy impact.
📊 Technical Outlook – GBP/USD
GBP/USD briefly recovered from an intraday low of 1.3280 but remains under pressure near key resistance.
On the upside, the psychological barrier at 1.3500 remains a major hurdle.
To the downside, the April 3rd high around 1.3200 now acts as strong support.
💼 Trading Plan
🟢 BUY ZONE:
Entry: 1.32500
SL: 1.32000
TP: 1.33300
🔴 SELL ZONE:
Entry: 1.34180
SL: 1.34700
TP: 1.33500
📌 Stay alert ahead of key BoE guidance and further US-China headlines — volatility may increase as we head into May.

AUDNZD BULLISH OR BEARISH DETAILED ANALYSISAUDNZD has finally broken out of a well-formed falling wedge pattern on the 12H timeframe, signaling a potential bullish reversal. After a sustained downtrend, price consolidated within the wedge, indicating decreasing bearish momentum. The recent breakout confirms buyer strength and opens the door for a fresh upside swing. The current price sits around 1.072, and based on technical structure and projected pattern targets, we could be heading towards the 1.105 zone.
From a fundamental standpoint, the Australian Dollar is gaining support due to rising commodity demand and hawkish tones from the RBA, hinting at a possibility of sustained higher interest rates. On the other hand, the New Zealand Dollar has been under pressure due to softer-than-expected CPI data and growing speculation that the RBNZ might be done with its tightening cycle. This divergence in central bank stance adds fuel to the AUDNZD bullish narrative. Today’s macro releases show stable Australian employment data and a dip in New Zealand’s retail figures, which further supports the bullish view.
This setup offers a solid risk-to-reward ratio, especially with a clean invalidation below 1.062. If the momentum sustains, price may accelerate quickly toward the 1.105 target. Market participants should also keep an eye on DXY (US Dollar Index) correlations and global risk sentiment, which could amplify volatility across AUD and NZD pairs.
As a professional trader, I’ll be monitoring price action closely near lower timeframes for confirmation entries and managing the trade with dynamic stop-loss adjustments. This breakout is technically clean, fundamentally supported, and strategically aligned with the current macro backdrop – making it a high-probability swing setup worth sharing.

Fundamental Market Analysis for April 25, 2025 GBPUSDAn event to watch out for today:
11:00 EET. CHF - The head of the SNB Martin Schlegel will deliver a speech
GBPUSD:
The GBP/USD pair is pulling back from its recent gains, hovering around 1.3290 during the Asian session on Friday. The pullback comes amid a strengthening US Dollar (USD), helped by a Bloomberg report that China may suspend a 125% tariff on some US imports, including medical equipment, ethane and aircraft leasing.
Sources familiar with the matter said officials are particularly scrutinising the possibility of removing tariffs on aircraft leasing. China's Ministry of Finance and General Administration of Customs have not yet commented. Further support for the dollar comes from optimism around trade talks with the US. Reuters reports progress in preliminary talks with key Asian allies, including South Korea and Japan.
The US Dollar Index (DXY), which tracks the dollar against six major currencies, is recovering previous losses and is trading near 99.80. However, the dollar faced headwinds after mixed labour market data. The US Department of Labour reported that initial jobless claims rose to 222,000 for the week ended April 19, slightly above expectations, while jobless claims fell 37,000 to 1.841 million for the week ended April 12.
In the United Kingdom (UK), the GfK consumer confidence index fell to -23 in April - its lowest level since November 2023 - amid rising living costs and growing concerns about global trade, missing forecasts of -22. Traders now await UK retail sales data and a final reading of the US consumer sentiment index from Michigan later in the North American session.
Trading recommendation: SELL 1.3270, SL 1.3300, TP 1.3170

XAUUSD Price Outlook – Bearish Setup in Play ??Asset Overview
The chart represents a price action analysis with support and resistance zones, along with EMA indicators (50 and 200), likely on a 4H or 1H timeframe.
Key Technical Levels
Resistance Zone: ~3,400 to 3,450
First Support Zone: ~3,230 to 3,250
Second Support Zone: ~3,090 to 3,130
Indicators
EMA 50 (Red): Currently around 3,340, acting as dynamic resistance.
EMA 200 (Blue): Positioned near 3,232, reinforcing the first support zone.
Price Action Insight
Price had a strong uptrend, peaking above 3,440 before pulling back.
A lower high may be forming, suggesting possible trend exhaustion.
The current bounce appears to be a retracement back toward resistance or EMA 50.
Projected Move (As Illustrated on Chart)
Short-term bullish move into the resistance zone (~3,400–3,450).
Failure to break above resistance leads to sharp rejection.
Price retraces to first support zone (aligned with EMA 200).
If support fails, deeper drop expected toward the lower support zone (~3,100).
Strategic Notes
📉 Bearish Bias if price fails to break above resistance.
🔍 Watch for bearish candlestick patterns or divergences near resistance.
🛡️ First support aligns with EMA 200, making it a critical level for bulls to defend.
🔻 Breakdown below 3,230 opens room for larger correction to 3,100–3,090.
Conclusion
Currently, the chart suggests a potential short opportunity if price confirms rejection at resistance. The EMA cross structure remains bullish long-term, but momentum is weakening, and failure to reclaim highs could shift sentiment bearish in the short to mid-term.

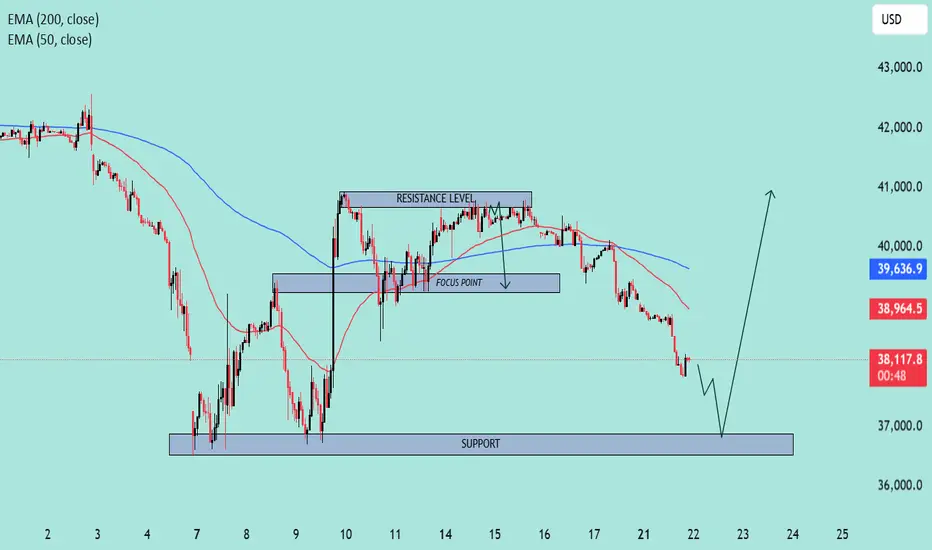
US30 Approaching Key Support Zone – Potential Reversal Ahead?📊 Chart Overview:
Timeframe: Looks like an intraday (maybe 1H or 2H).
Indicators:
EMA 50 (Red): 38,964.7
EMA 200 (Blue): 39,637.0
🔍 Key Levels & Structure:
🔵 Support Zone (Highlighted):
Around 36,800 – 37,200 range.
This is a well-tested support level where price previously bounced.
Current price action is approaching this zone again, which increases the chance of a potential bullish reaction.
🟣 Resistance Level:
Defined around 40,500 area.
Price has rejected multiple times from this zone.
Previously served as a consolidation/decision area.
📍 Focus Point (Previous Support Turned Resistance):
Near 38,700 – 39,000.
This level may act as a reaction point on the way back up.
📉 Current Price Action:
Strong downward momentum heading into the support zone.
Price is under both EMAs, suggesting short-term bearish trend.
However, the drawn arrow suggests a potential reversal bounce from the support.
🧠 Interpretation & Scenario Plan:
🅰️ Bullish Scenario:
Price touches or sweeps the support zone.
Bullish structure or reversal candle forms (e.g., hammer, bullish engulfing).
Break back above EMA 50 & Focus Point could confirm the shift.
Target: Revisit Resistance Zone (above 40,000).
🅱️ Bearish Scenario:
Support fails to hold.
Clean break below 36,800 with volume could lead to accelerated sell-off.
Watch for breakdown retests of support turned resistance.
🔔 Takeaway:
⚠️ Current move is bearish, but price is approaching a key demand zone. Bulls might step in if the zone holds. Confirmation is key before going long. Reclaiming EMAs would strengthen bullish bias.
AT&T I Tipping Point : Short Opportunity with Head & ShouldersHey traders after a previous trade trade on the hood hitting targets of 16.4%. Today I bring you NYSE:T
Technical + Fundamental View
Pro Tip
- Breakdown below the Entry Line will be considered at Trade Initiation. (Risky Traders)
R:R= 5.4
- Rest can follow entry at day close post breakdown SL above Entry Candle.
- The Breakdown Below the Entry Line will confirm the head and shoulder pattern
Entry Line - 26.93
Stoploss - 27.53
Target 1 - 25.59 (Neckline of head and shoulder)
Target 2 - 24.74
Target 3 - 23.68
Technical View
- Head And Shoulder on Daily Time frame
- On the hourly timeframe, the chart looks weak, showing a potential double top pattern where the second peak is lower than the first, indicating growing investor fear.
Fundamental View
- High Debt: Over $140 billion in debt limits investment capacity and consumes significant cash flow.
- Network Issues: Poor service quality and outages risk losing customers to competitors.
- Strong Competition : T-Mobile and Verizon offer better plans, making customer retention harder.
- Market Saturation: The U.S. wireless market is nearly saturated, limiting new customer growth.
- Execution Risks: Growth and debt reduction depend on flawless asset sales and network upgrades; delays could harm finances and stock performance.
Additional Considerations
- AT&T’s valuation is higher than some peers, potentially capping upside.
- Telecom market competitiveness means growth hinges on successful 5G and fiber rollouts.
- Dividend yield (~3.9%) is attractive but lower than some rivals, which may impact income investors.

Gold – Watching Key Resistance for Intraday Sell Plays📌 Gold Surges $80 off Support – Watching Key Resistance for Intraday Sell Plays 📉📈
Gold (XAU/USD) bounced sharply today — surging over 80 points from the support zone near $3,260, swept during the late U.S. session. This strong rebound came as buyers stepped in aggressively after a 250+ point crash earlier in the week.
Now, the market is pulling back from the 0.382 Fibonacci retracement zone, showing early signs of sell-side reaction. If this momentum continues, Asian and London sessions could push price lower to fill liquidity in the untested FVG region near 3,288.
🔁 Intraday Structure & Key Zones
After sweeping both sides of the range (80 up / 40 down), gold is now consolidating between 3,328 – 3,320. With intraday volatility ranging from 80–100 points, today’s focus will be on high-probability reaction zones.
🔴 SELL Bias for Today
Primary Resistance: 3,376 – 3,378
→ This zone is expected to act as the first defense for sellers.
If broken, watch the final resistance at 3,410 — a key structural level.
→ A clean breakout above 3,410 may invalidate the sell setup and shift the bias back to BUY.
🔍 News to Watch
⚠️ Unemployment Claims (U.S.) will be released during the New York session.
→ Given current market sensitivity, expect volatility to spike around this release.
🧭 Today’s Trading Zones
🟢 BUY ZONE
Entry: 3,230 – 3,228
SL: 3,224
TP Targets: 3,234 → 3,238 → 3,242 → 3,246 → 3,250 → 3,254 → 3,260
🔻 SELL ZONE #1
Entry: 3,376 – 3,378
SL: 3,382
TP Targets: 3,372 → 3,368 → 3,364 → 3,360 → 3,355 → 3,350
🔻 SELL ZONE #2
Entry: 3,408 – 3,410
SL: 3,414
TP Targets: 3,402 → 3,398 → 3,394 → 3,390 → 3,386 → 3,382 → 3,375 → 3,370
🛡️ Risk Management Note
The market remains extremely volatile and headline-driven. Stick to your trading plan and always respect TP/SL levels to protect your capital — especially during high-impact news releases.
💬 Are you planning to sell into resistance or wait for a deeper pullback to buy? Share your setups and ideas below! 👇👇👇

Fundamental Market Analysis for April 24, 2025 EURUSDEvent to watch out for today:
15:30 EET. USD - Number of Initial Jobless Claims in the U.S.
EURUSD:
EUR/USD rises towards the 1.1335 level during the early Asian session on Thursday. Easing concerns over potential tariff threats from US President Donald Trump are putting some pressure on the US Dollar (USD).
According to the Federal Reserve's (Fed) Beige Book report released on Wednesday, businesses facing the early stages of Trump's tariffs are looking for ways to pass on rising costs to consumers. Companies have reported receiving warnings from suppliers about price increases and are looking for ways not to absorb those increases, noting uncertainty about whether they can pass them on to customers.
Earlier this month, Trump imposed a basic import tax of 10 per cent or more on dozens of countries, but then unexpectedly suspended the taxes for 90 days to give countries a chance to negotiate lower rates. Nevertheless, trade policy uncertainty and concerns over slowing economic growth in the US could drive the dollar lower and create a tailwind for EUR/USD.
Last week, the European Central Bank (ECB) cut its main interest rate by a quarter of a percentage point to 2.25% at its April meeting. During a press conference, ECB President Christine Lagarde said that the US tariffs on EU goods, which have increased from an average of 3% to 13%, are already hurting the prospects of the European economy.
Trading recommendation: BUY 1.1350, SL 1.1320, TP 1.1430

Gold Drops $200 in Hours – Panic or Opportunity? 📌 Gold Plunges $200 – Volatility Surges Amid Fed Signals and Market Panic 🔥📉
📰 What Just Happened?
Yesterday, gold (XAU/USD) experienced one of its sharpest intraday drops in recent months, tumbling from the all-time high around $3,500 to as low as $3,318, losing nearly $200 in just a few hours.
This marked a significant correction following an extended bullish trend.
🔍 Key Drivers Behind the Crash
Fed-related commentary spurred aggressive profit-taking across the market.
The USD staged a technical rebound, exerting downward pressure on gold.
Rapid sentiment shifts triggered panic selling and liquidation flows.
🧭 What’s Next for Gold?
The $3,300–3,320 zone is now a crucial support — if this level holds, a technical recovery could unfold.
However, a break below $3,300 may expose gold to deeper downside targets near $3,250.
⚠️ Strategic Considerations
This is a high-volatility environment — flexibility and strict risk management are key.
Current sentiment is fragile. Unpredictable political headlines and mixed Fed signals are adding to the uncertainty.
In the latest development, Trump clarified he has no intention to fire the Fed Chair and hinted that China’s tariffs could be eased slightly — but not eliminated. These mixed messages continue to create sharp swings in price.
📊 Trade Plan
🔻 SELL ZONE #1:
Entry: 3,378 – 3,380
Stop Loss: 3,384
Take Profits: 3,374 → 3,370 → 3,366 → 3,362 → 3,358 → 3,350
🔻 SELL ZONE #2:
Entry: 3,408 – 3,410
Stop Loss: 3,414
Take Profits: 3,404 → 3,400 → 3,396 → 3,392 → 3,386 → 3,380
🟢 BUY ZONE:
Entry: 3,292 – 3,290
Stop Loss: 3,286
Take Profits: 3,296 → 3,300 → 3,304 → 3,308 → 3,312 → 3,316 → 3,320
The priority remains to sell into rallies near resistance while the downtrend unfolds. All trades should be protected with tight stop-losses, given the current unpredictability.
🧠 Key Takeaways
This is not a market for guessing — wait for price confirmation at key zones.
Focus on reaction zones, not forecasts.
Stay light, stay nimble, and manage risk carefully — news-driven volatility is at its peak.
💬 How are you positioning in this volatile gold market? Waiting for the bounce or selling the rallies? Let us know below! 👇👇👇

Fundamental Market Analysis for April 23, 2025 USDJPYThe Japanese yen (JPY) declined against its US counterpart for a second straight day on Wednesday and retreated further from the multi-month peak reached the previous day. The Trump administration officials' comforting comments on US-China trade talks triggered a sharp rebound in global risk sentiment, which in turn had a strong impact on traditional safe-haven assets, including the yen. Moreover, a slight recovery in the US dollar (USD) from multi-year lows, supported by easing concerns over Federal Reserve (Fed) independence, pushed the USD/JPY pair to a one-week high, a level above 143.000 during the Asian session.
Growing optimism that the US and Japan are moving closer to a temporary trade agreement is helping the yen, which reacted weakly to unimpressive domestic PMIs, to pause its intraday decline. In addition, strengthening expectations that the Bank of Japan (BoJ) will continue to raise interest rates in 2025 is keeping JPY bears from betting aggressively. Meanwhile, investors are losing confidence in the US economy amid Trump's rapidly shifting stance on trade policy. This, as well as bets that the Fed will soon resume its rate-cutting cycle, is holding back the dollar and taking the USD/JPY pair below 142.000 in the last hour.
Trading recommendation: SELL 141.700, SL 142.100, TP 140.500
BEARISH ON THE EUROI've taken a short position on EG, prior to PMI data being released over the next few hours.
Yesterday, I managed to get nice sells on this with the technicals provided, to the "weak low" as you see on the chart. Looking this morning, I expect this trend to continue and dont see a bullish angle on this pair yet until we see a deeper retracement - which is what Im involved in currently.
Fundamentally, Services PMIs tend to matter more for the UK, which is heavily services driven (80% of GDP), with manufacturing PMIs mattering more for Germany, the EU’s engine.
BoE - Slower to commit to cuts due to persistant wage growth and services inflation.
ECB - They are much more dovish in recent statements. Core inflation has been easing, and rate cuts are on the table as early as Q2/Q3.

XAU/USD Target Achieved – $3,500 Successfully Hit 🔥 XAU/USD Target Smashed – $3,500 HIT! 🎯💰
Gold has officially reached $3,500, perfectly hitting our projected buy target!
This move confirms the strength of the bullish momentum and technical breakout setup.
🔹 Entry: Above $3,430
🔹 Final Target: ✅ $3,500 – Hit
🔹 Result: High-conviction setup delivered with precision
🔹 Trend: Remains bullish, but profit-taking expected at round number resistance
👏 Massive congrats to all who followed the plan — another clean win on XAU/USD!
