Tao BiasBearish Sentiment
across the 2-hour, 1-hour, and 30-minute timeframes indicates a bearish trend. A significant observation is the price action within a confluence zone, identified as an Optimal Trade Entry (OTE) on the 30-minute chart, which also aligns with an area of imbalance (Fair Value Gap) on the 1-hour timeframe.
favoring short positions may be considered. Potential entry points could be sought on minor retracements, with prudent stop-loss placement above the identified OTE zone or recent swing highs. The primary objective would be to target the identified sell-side liquidity.
Fundamental Analysis

[LONG] ETHUSDT | ETG Going Up Follow BTC?Welcome,
- Status: 📈 Long
- TP & SL On Chart
Keep wait..
Lets see..


BTC Outlook May 2025CRYPTO:BTCUSD
Bitcoin Nears Major Resistance – What Comes Next?
As of this writing, Bitcoin is trading around $96,000, climbing steadily as it approaches what I believe is a critical resistance zone between $98,000 and $102,000. This area has the potential to act as a major turning point.
If Bitcoin can break through and hold above the $102,000 level, I believe there's a strong chance we see continued momentum pushing the price toward $120,000 or even higher. However, if Bitcoin is rejected at this resistance zone, it could mark the beginning of a retracement, with the next major support area appearing around the $71,000 level.
This zone of resistance is, in my view, one of the most important to watch in the current cycle. Whether Bitcoin can establish new support above it—or get turned away—could shape the trajectory for the rest of the year.
Previous Bitcoin Outlook
Disclaimer: The views expressed in this article are my personal opinions and should not be considered financial or investment advice. Trading cryptocurrencies involves significant risk, and you should always do your own research and consult with a financial advisor before making investment decisions.

BNB/USDT 1D chart Hello everyone, let's look at the 1D BNB chart to USDT, in this situation we can see how the price moves in a triangle where there is still space to keep the currently ongoing side trend. Going further, let's check the places of potential target for the price:
T1 = $ 599
T2 = $ 617
Т3 = $ 644
Let's go to Stop-Loss now in case of further declines on the market:
SL1 = $ 580
SL2 = $ 559
SL3 = $ 542
SL4 = 521 $
Looking at the MacD indicator, you can see an attempt to return to the upward trend, but here we do not have clear confirmation, which is why it is worth being careful.

GBPUSD Analysis Today: Technical and Order Flow !In this video I will be sharing my GBPUSD analysis today, by providing my complete technical and order flow analysis, so you can watch it to possibly improve your forex trading skillset. The video is structured in 3 parts, first I will be performing my complete technical analysis, then I will be moving to the COT data analysis, so how the big payers in market are moving their orders, and to do this I will be using my customized proprietary software and then I will be putting together these two different types of analysis.

WHY WILL IT GO HIGH?Reasons indicating strong potential:
- Large and active community on social media
- High scammer activity
- Trap for inexperienced users: selling on DEX at 3x lower price than on CEX due to low DEX liquidity
Let me know if you'd like it even more formal or formatted for a report.

BUY EURUSDFollowing the market structure of EU, it keeps pushing above.
.
Now, as it is seen, the price is pulling back to untested zone in a daily TF.
..
We can risk by pushing down the price? , because the trend is bullish, so it is better we wait to complete correction and if it will enter the fresh zone, we will drop to lower time frame to find the confirmation for buy.
.
Trend is your friend

Eth looking promising for a bull runHi guys, I do these charts often as I'm interested and it's a nice challenge to read.
If you like my content please give it a boost it helps so much.
Eth is looking very bullish, its an important change of direction with a double upward take as you can see, its jumped 10% in the past month. That's significant.
If you are wondering if it's too late, it's not, its still 50% than beginning of year. Ethereum is becoming more and more popular with gaming, and viable transanctions. Much more than bitcoin. You have to be in the industry to understand it. It's the best P2P ever built. It's not gonig anywhere, it's here to stay. In my opinion its a solid investment.

BTC Dominance will rise above 70-72%BTC.D.% W has established range, I would expect it to get to 70-72%. I dont think we will see altcoin season soon. World is discovering bitcoin on the level of countries, banks, billionaires, investment funds. Ask a question, if you were the bank, or government would you hold 65% in BTC and the rest in alts? What would be your counties portfolio, would you be a president? I bet, you would say at least 95% in BTC. I think 70-72% of dominance can be broken up to 80% easy, when another $10T get into crypto.
IMO for the next couple of years this trend will steady go up only.

Nu Holdings (NU, 1D) — Technical AnalysisNu Holdings (NU, 1D) — Technical Analysis: Trendline Breakout, EMA/MA Confirmation, Recovery Toward Key Levels
On the daily chart, Nu Holdings has broken out of a descending trendline, signaling a potential structural reversal. The breakout was confirmed by a close above key exponential and simple moving averages (EMA 50/100/200), with the EMAs beginning to align in a bullish sequence. The price has held above the critical Fibonacci retracement level at $11.73 (0.618), which now serves as a key demand zone. Volume shows signs of increasing during upward impulses, suggesting accumulation interest. The current recovery structure indicates potential targets at $12.58 (0.5 Fibonacci), followed by $13.42 (0.382) and $14.46 (0.236). A more extended move could lead toward the previous supply zone near $16.15 if momentum persists.
From a fundamental standpoint, Nu Holdings continues to attract investor attention within the fintech sector, especially amid broader rotation back into growth and tech-driven financial platforms. The company's expanding market presence and improving financial metrics may support the current technical setup. As long as the price holds above the broken trendline and maintains strength above the key $11.73 level, the bullish scenario remains in focus with targets pointing toward the $13.42–$14.46 range and potentially higher in the medium term.

ETHUSD analysisAs we can see in M15 chart after IDM (X) taken out price fails to make BOS (Break of structure) . So, we can say swing high become stronger than the swing low. Therefore there is a high probability to break the low. Hence we can create short position after taken out the inducement.

XAGUSD (Silver/US Dollar) trading idea for Monday, May 5, 2025 Trading Plan (Scenario-Based):
📌 Plan A: Bullish Breakout Play
Entry: Buy on breakout above $26.70 with strong volume confirmation.
SL: $26.20
TP1: $27.10
TP2: $27.50
RRR: ~2.5:1
📌 Plan B: Range Bounce
Entry: Buy near $25.80–26.00 support zone if price retraces.
SL: $25.50
TP1: $26.50
TP2: $26.90

AI Predicts the Next Big Move for BTC/USD - Trading Plan InsideI'm using AI to make daily crypto price predictions — and the next day, I fully analyze the forecast results! 📊
The goal? To build a consistently profitable intraday trading strategy, month after month. 📈
Follow along to see real data, honest results, and how AI can transform short-term crypto trading! 🚀
📈 BTC/USD Trading Plan
Date: Apr 28, 2025
Current Price: 94,855.11
✅ Long Scenario
Entry:
Bullish Breakout: Enter long at 95,050
(Confirmation: close above 95,000 with rising volume)
Stop-Loss:
Set at 94,500 (below recent support at 94,575)
Take-Profits:
First Target: 95,450 (below resistance at 95,500)
Partial Target: 96,800
Trailing Stop:
Activate above 95,500 with a 375-point trailing buffer (≈1.5× ATR)
✅ Short Scenario
Entry:
Bearish Rejection: Enter short at 94,350
(Confirmation: close below 94,400 with CMF < -0.05)
Stop-Loss:
Set at 94,900 (above resistance at 94,800)
Take-Profits:
First Target: 93,550 (above support at 93,000)
Partial Target: 92,000
Trailing Stop:
Activate below 93,000 with a 375-point trailing buffer
🔄 Re-Evaluate Forecast If:
Price closes above 95,500 (bullish invalidation) or below 93,000 (bearish invalidation).
CMF (Chaikin Money Flow) reverses:
CMF > +0.05 (bullish shift)
CMF < -0.1 (bearish shift)
RSI breaches:
Above 60 (overbought)
Below 40 (oversold)
Sudden volume spike (>150 units) without price follow-through.
⚠️ Risk Management
Adjust stops and targets by 0.2–0.5% from key support/resistance levels to avoid liquidity traps.
❗ Disclaimer
This is not financial advice.
Crypto markets are highly volatile and speculative. Always do your own research (DYOR) and consult a qualified financial advisor before investing.
You could lose your entire investment.

SOL/USD AI Prediction!Apr 29, 2025 SOL/USD Trading Strategy
I use an AI-powered prediction tool to make daily crypto price forecasts — and I fully analyze the results! 📊
My goal? To develop a consistently profitable intraday trading strategy, month after month. 📈
Follow along to see real data, honest results, and how AI can transform short-term crypto trading! 🚀
Long Scenario
- Entry: 147.50 (confirmed if price holds above Supertrend 147.04 + MACD bullish).
- Stop-Loss: 146.50 (below Supertrend support).
- Take-Profit: 149.80 (near 150 resistance) & 152.50 (below 153 peak).
- Trailing Stop: 1.5x ATR (1.15 points) after breaching 149.
Short Scenario
- Entry: 146.50 (confirmed if price breaks Supertrend 147.04 + MACD bearish crossover).
- Stop-Loss: 147.50 (above Supertrend flip level).
- Take-Profit: 145.30 (below 145.45 panic low) & 139.80 (near 140 target).
- Trailing Stop: 1.5x ATR (1.15 points) after breaking 145.
Re-Evaluate Forecast If:
1. Price closes above 150 (bullish invalidation) or below 145 (bearish acceleration).
2. RSI crosses 70 (overbought) or drops below 40 (bearish momentum).
3. Supertrend flips direction or volume exceeds 20,000.
Confirmation Tools: Supertrend, MACD crossover, RSI trend.
Risk Note: Avoid overbought/oversold traps; adjust stops away from S/R. Disclaimer: This is not financial advice. Crypto markets are highly volatile and speculative. Always do your own research and consult a qualified financial advisor before investing. You could lose your entire investment.

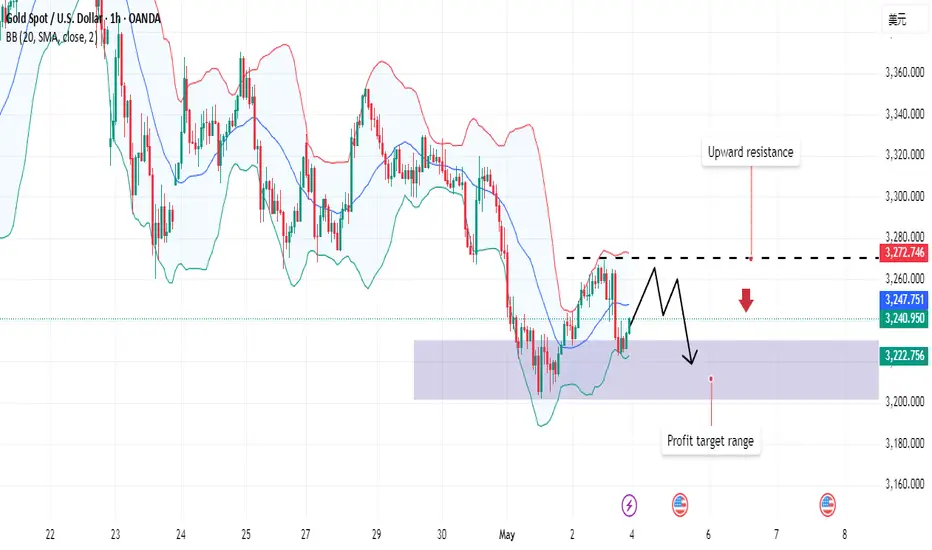
Gold fell as expected. What will happen next week?Gold fell within the range expected by Quid. Although it rebounded slightly, the final result did not change. Will the direction of gold change next week?
Quid's analysis:
Gold's 1-hour moving average is downward, and there is a trend of continuous downward development; gold is currently under pressure from the 3270 line, so 3270 will still be the key turning point for gold bears next week. Although gold has rebounded slightly, the magnitude of the decline is not large; if the upward resistance level of 3270 fails to break through next week, it may be in a sideways fluctuation.
The downward trend will not reverse for the time being, unless major news is released on the weekend, which directly affects the gold market.
Quid believes that the ups and downs of the market are normal. Gold has fallen by about $300 from its high point, and the overall trend in the near future is still downward; it continues to fall after a small rebound, which means that the strength of gold bears is still there.
Quide believes that it is always easy to follow its trend; violating its rules always makes oneself exhausted; the market is always right, and standing on the opposite side of the market will always be taught a lesson by the market. In the face of the overall trend, traders should not be lucky, and the market will not forgive your mistakes again and again.
Operation strategy:
Short around 3270, stop loss at 3280, take profit around 3220;
BTC - Liquidity Mapping to Predict MovementAs a part II to my previous post on “Bull Market OR Bearish Retest?” - Here is a 2 day liquidity map on BTC’s chart.
I’m anticipating a sharp drop to 7,000 - why is this number significant?
There is a mass amount of liquidity in the chart down towards 7,000-10,000.
This liquidity is in the form of long stop loss orders.
In layman’s terms - the sell orders required to take price to this extreme low are already within the chart. It is a pre-set consequence to traders decisions in a market dominated by leveraged buys and sells.
If we consider what the “floor” price of BTC is (IE all long term secured holders) - we first have to seperate out the leveraging liquidity used in the futures market.
How much of the BTC market cap is injected liquidity from futures / derivatives? In my view, anything above 7,000.
This liquidity can flow in and out, and the business and function behind it isn’t affected. This liquidity is extremely fluid. It can drop 90,000 and rise 90,000 shortly after without any affect on the fundamental value of Bitcoin.
Sure there is a psychological consequence with perceived value and market stability - but the fact is, leveraged liquidity can enter the market and leave the market with no impact at all on the wallets of market makers.
Food for thought - happy trading.

The latest gold strategy analysis and operation guidance📌Fundamentals:
This week, the US economic data was released intensively, and ADP employment, unemployment benefits, GDP and PCE price index were all bullish, but some data showed signs of weakness after Trump's tariff policy. The unemployment rate remained the same as the previous value of 4.2%, while the expected new employment of 130,000 was significantly lower than the previous value of 228,000. The market's concerns about the cooling of the economy provided support for the gold price.
📊Technical side:
Although the 1-hour moving average is still in a dead cross short arrangement, there are signs of turning around. At the same time, after the rebound, gold began to consolidate at a high level instead of continuing to fall, so the momentum of the bears was weakened. So today's closing is critical. Today, gold fell back to around 3230 under pressure from 3270. In the short term, this is a balance range. You can see the shock in this range at night. If gold finally closes above 3270, then gold will most likely continue to rise next week. If it closes below 3240, then gold bears still have a great chance. If you want to operate in the short term, then don't chase it for the time being. Since it is a shock, you can go short first at a high level. If it breaks through 3270, then wait until next week. On the whole, today's short-term operation of gold suggests that the rebound is mainly short, and the callback is supplemented by long. The top short-term focus is on the first-line resistance of 3265-3270, and the bottom short-term focus is on the first-line support of 3200-3197.
🎯Practical strategies:
Strategy 1: Go short when gold rebounds around 3263-3266, with a target around 3230-3210.
Strategy 2: Go long when gold pulls back around 3197-3200, with a target around 3220-3230.

BTC - “Bull Market” OR Bearish Retest on HTF? Bitcoins excessive rise for the previous two years brings concern for the mechanics of this market. Moving only up for so long leaves much liquidity in the form of long position stop losses below the current price.
These stop loss orders, or leveraged sell orders, are an explosive chain reaction ready to set off.
Observe these two trendlines and copy them to your charts. These two bearish trendlines (in my view) are why bitcoin has truly been rising so freely.
Moves up in the form of bearish retests are fast and fluid, only after the rejection does price fall aggressively.
I anticipate two scenarios here in the realm of bearish ideas:
Possibility 1 - 30% Probability
96,700 to 34,500
34,500 retrace to 68,500
68,500 to 7,000
Possibility 2 - 70% Probability
96,700 to 43,000
43,000 retrace to 60,000
60,000 to 7,000
Note that both of these possibilities end with 7,000. I’m mapping out two routes that take us there, using confluences with trendlines, volume profiles, liquidity mapping, and common sense.
Be mindful of this possibility. And protect yourself accordingly.

$BTC at the start of the next parabolic run!Bitcoin's parabolic run in 2017 continued on MA11 and with the breaking of the middle band of the mass index indicator, the second parabolic run continued and now we are at the same stage.

When nobody knows where #Bitcoin is heading, #quantumalgo see thI took a long on BTC / USDT on the 15-minute chart when my Quantum Algo flagged an oversold condition—both the CRL oscillator and price printed green dots at a fresh swing low—signaling momentum exhaustion and support confluence around 96 000 USDT. I entered near 96 020 with a tight stop just below the low, and set my profit target near the next major resistance at about 98 900, yielding an attractive risk-reward. Overall, the signal combined clear momentum reversal, structural support, and disciplined risk management to ride the anticipated next leg up.

The Bitcoin Illusion: Why $300K or $1M Is a Pipe DreamBitcoin enthusiasts love throwing around wild price predictions—$300K, $1M, even $5M per BTC—as if these numbers are inevitable. But let’s break down the math and expose the delusion behind these claims:
Bitcoin at $300K or $1M? Let’s Do the Math
- $300,000 is a number pulled out of thin air by Michael Saylor and Robert Kiyosaki, either deliberately misleading or financially illiterate. They fail to grasp that this would require a market cap of $6 trillion.
- $1 million, as Cathy Wood foolishly claims, would require Bitcoin’s market cap to exceed $20 trillion—more than the entire GDP of the United States.
- The idea that Bitcoin will magically absorb trillions in global wealth is pure delusion.
Now, let’s put this into perspective:
- Bitcoin reaching $100K was relatively easy because it required a market cap of just $2 trillion—a fraction of global liquidity.
- But pushing Bitcoin to $300K or beyond requires trillions more, which is mathematically impossible without a massive influx of new capital—capital that simply does not exist.
Your $100K to $1M Fantasy—Let’s Run the Numbers
- Some Bitcoin holders believe their sub-$100K investment will make them multimillionaires.
That's a lie and delusional:
- If you bought 100k worth of Bitcoin at 83K per BTC, it would need to hit $830K per coin for you to even reach $1M.
- That’s not financial genius—it’s blind faith in an impossible scenario.
You’re Living in "The Matrix" of Crypto Lies
- You’re not stacking wealth—you’re stacking HOPIUM.
State Adoption Won’t Skyrocket the Price
- Even if six U.S. states were considering Bitcoin treasuries, those purchases would be OTC (over-the-counter)—meaning they wouldn’t significantly impact market price.
- Governments negotiate deals strategically; they don’t flood markets like retail investors hoping for price surges.
The End of Bitcoin’s Accumulation Phase
Bitcoin’s early adopters—the billionaires who pumped it up—have already made their money. The accumulation phase is over.
- To push Bitcoin higher, these whales would need to inject substantial amounts of new capital—but they are overleveraged and drowning in debt.
- Borrowed money must be repaid, and we're already past Bitcoin’s peak mainstream adoption which means there are no new waves of buyers to sustain the illusion.
- Bitcoin is now entering a distribution phase, where early holders cash out, leaving retail investors holding the bag.
The Rise of ETFs and Real Investments
The world is moving on. Investors are waking up to the fact that:
- ETFs offer real projects with actual purpose, unlike Bitcoin.
- ETFs pay dividends, generate revenue, and contribute to real economic growth.
- Newer crypto projects—like Stamps, art collections, gaming tokens, and smart contracts—are gaining traction and pulling capital away from Bitcoin.
Bitcoiners will get left behind, holding worthless, declining bags of old-school crypto, while the future thrives in better technologies.
The Harsh Reality: Bitcoin’s Future Is Bleeding Out
Bitcoin isn’t the future—it’s a fading illusion.
- The crypto cartel thrives on believers, feeding them fantasy while they cash out.
- The idea that Bitcoin will replace fiat, become the global payment rail, and make every holder rich is a marketing illusion designed to keep people holding bags.
- The longer people ignore reality, the harder the crash will be for them.
Many think they’re ahead of the curve, but they’re just loyal believers in an unsustainable illusion. When this unravels, it won’t be Bitcoin’s future collapsing—it will be theirs.

Gold Will Fall DownXAU/USD Analysis (4H)
Observations:
- Current price nearing a Bearish Fair Value Gap (FVG) zone
Trade Idea:
- Expecting a downward push from the FVG zone
- Sell opportunity in Gold
Target:
- 3150
This setup suggests a potential sell signal, with the FVG zone acting as a resistance level. Let's see how the market reacts.
