US DOLLAR INDEX TO RISE TO 100.90Dear traders, based on the chart, the falling trend-line is clearly broken and retested and the price is supported by a rising trend-line as well. This implies a big possibility of further rise towards 100.90. Let's See!
Fundamental Analysis

USDJPY is Sellinghaving given a CHoCH, it is temporally retracing to the up side to take out liquidity before giving us an official downtrend on the 1hour time frame. sell 1 and sell 2 are the two possible areas it could touch prior to the expected movement. stop loss should be 50 pips above sell 2 and also manage your risk.

The Golden Grain: Trading Corn in Global Markets🟡 1. Introduction
Corn isn’t just something you eat off the cob at a summer barbecue — it’s one of the most widely traded agricultural commodities in the world. Behind every kernel lies a powerful story of food security, global trade, biofuels, and speculative capital.
Whether you’re a farmer managing risk, a trader chasing macro trends, or simply curious about how weather affects global prices, corn futures sit at the crossroads of agriculture and finance. In this article, we’ll explore what makes corn a global economic driver, how it behaves as a futures product, and what traders need to know to approach the corn market intelligently.
🌎 2. Where Corn Grows: Global Powerhouses
Corn is cultivated on every continent except Antarctica, but a handful of countries dominate production and exports.
United States – By far the largest producer and exporter. The “Corn Belt” — spanning Iowa, Illinois, Indiana, Nebraska, and parts of Ohio and Missouri — produces the majority of U.S. corn. U.S. exports also set global benchmarks for pricing.
Brazil & Argentina – These two South American powerhouses are crucial to the global corn supply, especially during the Northern Hemisphere’s off-season.
China – Though a top producer, China consumes most of its own supply and has become a key importer during deficit years.
Corn is typically planted in the U.S. between late April and early June and harvested from September through November. In Brazil, two crops per year are common — including the important safrinha (second crop), harvested mid-year.
Understanding where and when corn is grown is vital. Weather disruptions in any of these regions can ripple through the futures market within hours — or even minutes.
💹 3. Corn as a Futures Market Power Player
Corn is one of the most liquid agricultural futures markets in the world, traded primarily on the CME Group’s CBOT (Chicago Board of Trade). It attracts a diverse set of participants:
Producers and Commercials: Farmers, ethanol refiners, and food manufacturers use corn futures to hedge price risk.
Speculators and Funds: Hedge funds and retail traders speculate on corn price direction, volatility, and seasonal patterns.
Arbitrageurs and Spreads: Traders bet on relative price differences between contracts (e.g., old crop vs. new crop spreads).
The deep liquidity and relatively low tick size make corn accessible, but its price is highly sensitive to weather, government reports (like WASDE), and international trade policies.
🏗️ 4. CME Group Corn Futures: What You Can Trade
The CME Group offers both standard and micro-sized contracts for corn. Here’s a quick overview:
o Standard Corn
Ticker: ZC
Size = 5,000 bushels
Tick = 0.0025 = $12.50
Margin = ~$1,050
o Micro Corn
Ticker: XC
Size = 1,000 bushels
Tick = 0.0050 = $2.50
Margin = ~$105
⚠️ Always confirm margin requirements with your broker. They change with market volatility and exchange updates.
The availability of micro corn contracts has opened the door for smaller traders to manage risk or test strategies without over-leveraging.
📊 5. Historical Price Behavior & Seasonality
Corn is deeply seasonal — and so is its price action.
During planting season (April–May), traders watch weekly USDA crop progress reports and early weather forecasts like hawks. A wet spring can delay planting, leading to tighter supply expectations and early price spikes.
Then comes pollination (July) — the most critical stage. This is when heatwaves or drought can do serious damage to yield potential. If temperatures are unusually high or rainfall is scarce during this window, markets often react with urgency, bidding up futures prices in anticipation of reduced output.
By harvest (September–November), prices often stabilize — especially if production matches expectations. But early frost, wind storms, or excessive rain during harvest can still trigger sharp volatility.
Many experienced traders overlay weather models, soil moisture maps, and historical USDA data to anticipate season-driven price shifts.
Even international factors play a role. For example, when Brazil’s safrinha crop suffers a drought, global corn supply tightens — impacting CME prices even though the crop is thousands of miles away.
🧠 6. What Every New Trader Should Know
If you’re new to corn trading, here are some key principles:
Watch the Weather: It’s not optional. Daily forecasts, drought monitors, and precipitation anomalies can move markets. NOAA, Open-Meteo, and private ag weather services are your friends.
Know the Reports: The WASDE report (World Agricultural Supply and Demand Estimates), USDA Crop Progress, and Prospective Plantings reports can shake up pricing more than you might expect — even if changes seem small.
Mind the Time of Year: Seasonality affects liquidity, volatility, and trader behavior. March–August tends to be the most active period.
Understand Global Demand: The U.S. exports a huge portion of its crop — with China, Mexico, and Japan as major buyers. A tariff tweak or surprise Chinese cancellation can cause wild price swings.
🛠️ Good corn trading is 50% strategy, 50% meteorology.
🧭 This article is part of a broader educational series exploring the relationship between agricultural commodities and weather patterns. In the upcoming pieces, we’ll dive deeper into how temperature and precipitation affect corn, wheat, and soybeans — with real data, charts, and trading insights.
📅 Watch for the next release: “Breadbasket Basics: Trading Wheat Futures.”
When charting futures, the data provided could be delayed. Traders working with the ticker symbols discussed in this idea may prefer to use CME Group real-time data plan on TradingView: www.tradingview.com - This consideration is particularly important for shorter-term traders, whereas it may be less critical for those focused on longer-term trading strategies.
General Disclaimer:
The trade ideas presented herein are solely for illustrative purposes forming a part of a case study intended to demonstrate key principles in risk management within the context of the specific market scenarios discussed. These ideas are not to be interpreted as investment recommendations or financial advice. They do not endorse or promote any specific trading strategies, financial products, or services. The information provided is based on data believed to be reliable; however, its accuracy or completeness cannot be guaranteed. Trading in financial markets involves risks, including the potential loss of principal. Each individual should conduct their own research and consult with professional financial advisors before making any investment decisions. The author or publisher of this content bears no responsibility for any actions taken based on the information provided or for any resultant financial or other losses.

TMG Holding Fundamental and Chart AnalysisTMG Holding trend has recently taken an upward trend between the support line 46.873 and the resistance line 54.511, up by 0.78%. It is expected to keep rising till breaking the 1st resistance line at 54.115 and then the 2nd one at 54.423 points because of positive fundamental analysis. On one hand, the CBE's decision about cutting the interest rate by 2.25% would lead to positive impact on corporates because of the current reasons behind the economic activity, decreasing interest rate will lead to a decrease in the cost of borrowing, which will decrease the cost of production and will increase the corporates' profit and their monetary value. Accordingly, this will lower the products' price and individuals will have a higher will to diversify their investments and increase their purchasing power. On the other hand, besides the current annual advertisements about SouthMed and the summer getting closer, there is news on Reuters about an advanced stage of negotiations for a new large-scale mixed-use project in Iraq. This project is estimated to generate total sales vicinity of $17 Billion and annual recurring income exceeding $1.5 Billion.

Shiba Inu Eyes 20% Surge, Targeting 0.000016 Breakout SoonHello and greetings to all the crypto enthusiasts, ✌
All previous targets were nailed ✅! Now, let’s dive into a full analysis of the upcoming price potential for Shiba Inu 🔍📈.
Shiba Inu has recently seen an extraordinary surge in trading volume, suggesting imminent large-scale activity likely driven by whales. The asset is currently trading within a parallel channel, indicating a period of consolidation. In the short term, I anticipate a potential price increase of at least 20%, targeting the key level of 0.000016.📚🙌
🧨 Our team's main opinion is: 🧨
Shiba Inu's massive recent volume hints at big whale moves ahead, and with price in a parallel channel, I’m eyeing a 20% jump toward 0.000016 soon.📚🎇
Give me some energy !!
✨We invest hours crafting valuable ideas, and your support means everything—feel free to ask questions in the comments! 😊💬
Cheers, Mad Whale. 🐋

BTC HAVE A HIGH PROBABILITY TO FALL DOWN!!!The BTC starts looking weak and it's perfect time to long for a short. We are almost at the top of this run from last weeks and we can see that BTC made a perfect divergence pattern. My indicator shows me also that we are entering a mid-term bearish trend and there is a high chance that we are gonna fall much deeper than in last weeks. My target is clear and I'm holding my strategy so I wait for the price to hit my SMA line like it was in the last days but now I wait for the price to hit the SMA line at 4H chart because we didn't hit it since 2 weeks so in this moment we can see even in a few candles that the price is gonna touch it. I am actually in the short and waiting for the price to go for my target, we also have a weekend so the price will be probably slow but everything can happen. In my opinion next week are gonna be red and the price should touch my target. I recommend to watch a 1H and 2H chart and looking when price will hit the SMA line on these timeframes because my target is set in a 4H chart but we can book profits even when the price will hit the SMA at 1H and at 2H chart. Be careful and stay focused.
Bitcoin Range-Bound in Heavy Resistance – CME Gap Still Open!Bitcoin ( BINANCE:BTCUSDT ), like Gold , has been moving in a Range for the past 5-6 days and is currently in a Heavy Resistance zone($95,950-$88,500) , as it has been in the past few days .
In terms of Elliott Wave theory , Bitcoin appears to be completing a main wave 4 . The main wave 4 structure can take two forms: Double Three Correction(WXY)_Expanding Flat(3-3-5) .
I label this analysis " Short " for the following reasons:
Due to Bitcoin's higher correlation with the S&P 500 Index ( SP:SPX ) these days, I am short on the S&P 500 Index.
China’s president Xi Jinping says Trump lied about them having a phone call ; it is NOT good news for the S&P 500 Index and Bitcoin .
CME Gap($92,525-$91,415) has NOT filled yet, and I think Bitcoin will NOT start the next bullish rally before filling the CME Gap.
I expect Bitcoin to drop to at least $92,830 and then decline to the Support zone($92,000-$91,400) if the Support lines are broken.
Cumulative Short Liquidation Leverage: $96,741-$95,520
Note: If Bitcoin can touch $97,000, we should expect more pumping.
Note: If Bitcoin goes below the 100_SMA(Daily), we should expect a fall.
Please respect each other's ideas and express them politely if you agree or disagree.
Bitcoin Analyze (BTCUSDT), 1-hour time frame.
Be sure to follow the updated ideas.
Do not forget to put a Stop loss for your positions (For every position you want to open).
Please follow your strategy and updates; this is just my Idea, and I will gladly see your ideas in this post.
Please do not forget the ✅' like '✅ button 🙏😊 & Share it with your friends; thanks, and Trade safe.

Gold's Symmetrical Triangle Near Break – Support Test Imminent!Gold ( OANDA:XAUUSD ) moved as I expected in my previous post and attacked the Support zone($3,282-$3,245) and Support lines for the second time . The question is, can Gold break the Support zone($3,282-$3,245) and Support lines or not!?
Please stay with me .
Gold is moving between Support zone($3,282-$3,245) and Resistance zone($3,386-$3,357) again . In fact, it can be said that Gold has been moving in a range for the past 5-6 days .
From a Classical Technical Analysis perspective, Gold appears to be forming a Symmetrical Triangle Pattern. A break of either line could indicate the next direction for Gold, but since the Symmetrical Triangle Pattern is a Continuation Pattern , the lower line is more likely to break .
In terms of Elliott Wave Theory analysis , it seems that we still have to wait for the next five downwaves .
------------------------------------------
Today, important U.S. data — JOLTS Job Openings and CB Consumer Confidence — will be released.
Let’s quickly review their potential impact on Gold:
JOLTS Job Openings :
If the number comes lower than expected , it signals a weakening labor market, increasing the chances of a dovish Fed → Bullish for Gold .
If the number is stronger than expected , it indicates a robust labor market, pushing the Fed to stay hawkish → Bearish for Gold .
CB Consumer Confidence :
A drop in consumer confidence reflects economic worries , driving demand for safe-haven assets like Gold → Bullish .
A rise in consumer confidence shows economic strength, reducing the appeal of Gold → Bearish .
Historical Impact :
Both indices have caused strong intraday moves in Gold recently, especially if the figures surprise the market.
Summary :
Weak JOLTS and low Confidence → Gold bullish
Strong JOLTS and high Confidence → Gold bearish
Be prepared for high volatility during the releases. Always manage your risk carefully!
------------------------------------------
I expect Gold to attack the Support zone($3,282-$3,245) and Support lines for at least the third time , and if it breaks, the next target could be $3,223 .
Note: If Gold can move above $3,393, we can expect more pumps and maybe make a new All-Time High(ATH).
Gold Analyze ( XAUUSD ), 1-hour time frame.
Be sure to follow the updated ideas.
Do not forget to put a Stop loss for your positions (For every position you want to open).
Please follow your strategy; this is just my idea, and I will gladly see your ideas in this post.
Please do not forget the ✅' like '✅ button 🙏😊 & Share it with your friends; thanks, and Trade safe.

Weekend Trading Note - 3 May 2025A couple of interesting dynamics in the market over the latter half of the week:
- Minimal reaction to economic data suggests that traders are weighing the pull between deflation and tariffs, which are undoubtedly putting the fed in a bind. Can they raise rates at a time of uncertainty when it comes to tariff-induced inflation. Recent data suggests deflation and a strong economy. Nothing is clear.
- The temporary uncoupling of BTC and the Nasdaq100 is interesting, but such narrative-led decoupling has happened on a short-term basis before. Perhaps this time the anti-dollar trade will continue a while longer, until calm is restored.
- Businesses seem to be reacting to the Trump uncertainty by slowing down their trading activity and hesitating to invest or grow until more clarity is available. The loss of confidence and reassurance of clear direction may be damaging in the longer-term, elevating the potential for a technical recession as business enter more defensive posturing.
- Theres still some potential for good news around a deal between the US and China leading to a return to a risk-on regime in the near-term. The question on whether this will be enough to propel US equities to new all time highs will depend on the pre-existing structural issues with the macroeconomy
Enough macro. Here’s what I’m looking at in markets:
- SPX has retraced back up to the 0.618 fib of the recent downside move. This coincides with the POC on the anchored volume profile (anchored from the ATH). If the SPX is going to retest the lows, I’d expect it this begin in the next 5-10 days. A complete breakdown below its current lows is unlikely at this stage, but a wick slightly below current lows marking the bottom is definitely on the cards.
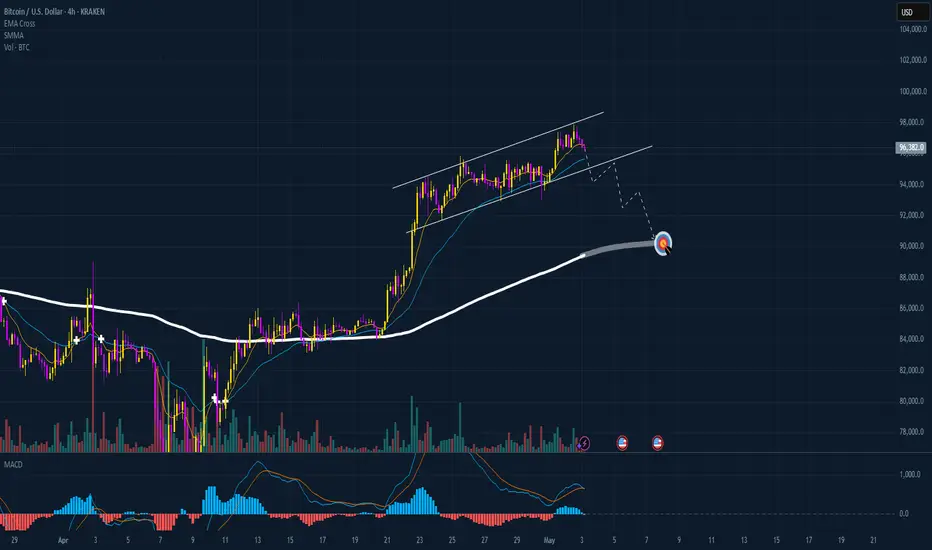
- BTC’s relative strength is encouraging. A retest of the $88700 level would offer a good entry for a trade back up to the current high at around $109K and perhaps more.

Apple to retest 224$ soon!Dear traders. After a bullish week on most of the giants in tech market, Apple lingered! However, based on technicals, after a clear breakout of the trendline and a retest, now the potential of a new upward leg is high. It could retest 224$ as the first target. Let's See!

MSFT is about to rise appreciably!Dear traders, after painful weeks in stock markets, now we could see the shadow of hope. Based on the chart, MSFT has broken an important trend line, in which, favors for more rise during next weeks. Besides, the monthly performance is about to become green, and thus, this confirms our bullish view. Let's see!

$EUIRYY -Europe CPI (April/2025)ECONOMICS:EUIRYY
April/2025
source: EUROSTAT
- Consumer price inflation in the Euro Area remained steady at 2.2% in April 2025, slightly exceeding market expectations of 2.1% and hovering just above the European Central Bank’s 2.0% target midpoint, according to a preliminary estimate.
A sharper drop in energy prices (-3.5% vs. -1.0% in March) was offset by faster inflation in services (3.9% vs. 3.5%) and food, alcohol, and tobacco (3.0% vs. 2.9%). Prices for non-energy industrial goods rose by 0.6%, unchanged from March.
Meanwhile, core inflation, which excludes food and energy, climbed to 2.7%, up from March’s three-year low of 2.4% and above the forecast of 2.5%.
On a monthly basis, consumer prices increased by 0.6% in April, matching March’s rise.

Is going as it shouldEverything is going according to plan. We are just waiting for the moment of a sharp upward leap...

Elite Validity Check | EUR/JPY
🔖 Header
Current Price & Spread** | **162.176 / 162.20
| **Timestamp (EST)** | 2025-04-29 01:20 |
| **Risk-Level Tag** | **Medium-High** – trading near yearly highs ahead of key EUR data |
| **Bias Checklist** | HTF trend ✅ | confluence ✅ | fundamentals ⚠️ |
| **Confidence Label** | **Technical High / Event-Risk Medium → Overall High** |
---
### 1️⃣ Technical Outlook
* **Multi-TF Trend (W1/D1/H4)** – **Bullish** (higher highs since Nov-24). Price pressing the 2025 top-of-range. ( [EUR JPY Chart – Euro Yen Rate -
* **Structure & Liquidity** –
* **Support**: 161.60-161.30 (H4 OB + prior swing).
* **Resistance**: 162.80 (Feb-25 high) → next liquidity **163.70-164.00** (2024 peak) (
* **Momentum Scan** – Weekly RSI 68 (near overbought); Daily MACD positive but histogram flattening (momentum pause). (
* **Volume** – Monday’s EU session candle closed 22 % above its 20-day avg tick volume (breakout confirmation).
( [EUR/JPY slips below 163.00 as trade-related uncertainties benefit
---
### 2️⃣ Primary Alert Zones
| Zone | Price | Type | Setup Idea 📝 |
|---|---|---|---|
| **Pullback Demand** | **161.60-161.30** | H4 OB + 50 DMA | M15 bullish engulf + > 20 % vol |
| **Breakout Supply** | **162.80-163.00** | Feb swing-high | Scale-out / watch false-break |
---
### 3️⃣ Indicators Snapshot
| Metric | Value | Read-out |
|---|---|---|
| RSI (H4) | 64 | bullish but near hot zone |
| MACD (D1) | >0, hist ↓ | waning momentum |
| ATR 14 (1 h) | **≈ 21 pips** (7-day avg)
| IG Sentiment | **~62 % short** (contrarian bullish)
---
### 4️⃣ Fundamental & Sentiment Radar
* **Tue 02:00** – German CPI flash (EUR).
* **Tue 05:00** – EZ flash GDP & HICP.
* **Thu Japan** – Tokyo CPI (early BoJ inflation gauge).
* **BoJ Outlook** – Next policy mtg ≙ Jun 13; officials jawboning JPY strength → risk of verbal intervention.
* **COT (22 Apr)** – Funds **net-long EUR / net-short JPY** → structural tail-wind. (

EUR/USD - Channel Breakout (02.05.2025) FX:EURUSD The EUR/USD pair on the M30 timeframe presents a Potential Buying Opportunity due to a recent Formation of a Breakout Pattern. This suggests a shift in momentum towards the upside and a higher likelihood of further advances in the coming hours.
Possible Long Trade:
Entry: Consider Entering A Long Position around Trendline Of The Pattern.
Target Levels:
1st Resistance – 1.1387
2nd Resistance – 1.1430
🎁 Please hit the like button and
🎁 Leave a comment to support for My Post !
Your likes and comments are incredibly motivating and will encourage me to share more analysis with you.
TVC:DXY
Best Regards, KABHI_TA_TRADING
Thank you.


Celestica looking like it could repeat the same pattern shown inCelestica looking like it could repeat the same pattern shown in

Chainlink Market View - on 03/May/2025Price need to retest on FVG1 or FVG2 , before it break OB and visit the Equal High (17$).
#chainlink

This AI-Backed IPO Is Just Warming Up — Next Stop: 86% Gains?CoreWeave is showing classic IPO 'honeymoon phase' price action, with early liquidity swept and bullish structure forming.
🔍 Price swept the daily sell-side liquidity at $35.70
📈 Now pushing higher — next major buyside targets at $55.04 and $65.22
🤖 Backed by NVIDIA, adding serious momentum and credibility
🧠 Expecting strong continuation as institutions begin to build exposure
If price maintains structure, this could be one of the strongest IPO moves of 2025.

MASTERCARD PICKS XRP AS BRIDGE PAYMENT! ⚡ Hey hey, hope all is well, been a few days since our last post, we got a cool development and I figured I'd give a quick update and follow up with things on that note!
⚡ To start off, Mastercard has now taken on and recognized XRP as a bridge currency for international payments making sure to denote XRP's significance as a token which can process expedited and low cost international payments offering a low-cost solution for traditional international payment methods. One of these traditional payment methods notably is the Society for Worldwide Interbank Financial Telecommunication or as it's better known and referred to as: SWIFT.
⚡SWIFT itself is basically a messaging network that helps banks all around the world process international money transfers averaging about 50 million messages a day or close to roughly $5 trillion per day and even including the 250 business days per year, close to $150 trillion a year. So basically we've got Mastercard picking XRP's fast and cheap expeditated transactions and network as a replacement to SWIFT's traditional message system.
⚡ May not seem too significant but considering just how much XRP is doing, it's slowly taking a bite out of the SWIFT system more and more as more companies and business pick XRP as their form of doing digital transactions replacing a system which has long been overdue for a change citing significant intermediary and middleman cost with traditional international payments as oppose to the sleek and efficient system that Ripple has created and is working towards on a daily basis.
🔥 So yeah, this is a great development for us, it's another step in the right direction and another step towards the Future and change that the company Ripple is seeking to bring about no doubt. Below I'll add a reference link to the Mastercard document which mentions XRP as a bridge currency as well as an article that speaks more on the subject for anyone who would like to check that out.
x.com
www.livebitcoinnews.com
🔥 I've you've made it this far, I appreciate it, we'll take a quick look at our TA and wrap things up.
🔥 In our last idea we noted the main thing was just to watch that ascending channel and see if we could keep within it and we indeed have, we did have a 200 EMA crossover on the 3 hour but bulls managed to pull back up and into the channel so we're definitely in some wavy waters here. We're really testing that channel support as bears try to break it but bulls keep firm. Main thing right now is to watch if we can keep within the channel and potentially make another leg up to $2.4 and break $2.3 which is proving to be a strong horizontal resistance level.
🔥 So basically watch the ascending channel and the horizontal channel, if we do fall out of the ascending channel, next up will be the horizontal channel for a test of support so keep noted with that. Technical aside though we still do have the chance of the SEC approving an XRP Spot ETF soon which if done soon, would more than likely have us seeing a significant breakout and shift in sentiment on behalf of retail and institutional investors so definitely keep your eyes peeled.
🔥 I've got to run but I appreciate the time and and support as always, you already know I'm more than happy to keep you guys updated with me as we continue on with this long but well worth journey. Thanks so much as always and till next, keep posted and have a great day!
Best regards,
~Rock'

BTCUSDT 4H – Correction Before Breakout | Targeting $98KI'm seeing a potential bullish continuation pattern forming on the BTC/USDT 4H chart. After a strong upward trend, price is currently in a consolidation zone with a likely correction toward the $95,600–$96,000 area, which aligns with both pivot support and the rising trendline.
Key points from my analysis:
Support zone: $95,600–$96,000 (confluence of pivot point and ascending trendline)
Resistance targets:
R1: $97,272
R2: $98,050
R3: $99,308
Momentum: Stochastic RSI near overbought → suggests short-term pullback, then potential continuation.
Volume: No major distribution, bullish momentum remains intact.
📈 I expect a minor dip followed by continuation to R2 or R3, provided the $95,600 support holds.
Stop-loss idea: Below $94,756 (S1)
Take-profit zones: Partial at GETTEX:98K , rest near $99.3K
------------ManOf87_Pro Indicator--------------------
A powerful trading tool combining ATR-based trend detection, Fibonacci pivots, Fair Value Gaps (FVG), engulfing patterns, and multi-factor confirmations (MA, RSI, Bollinger Bands, volume, Z-Score, ROC).
*Buy Signal: Triggers when the trend shifts bullish (price exceeds ATR-based short stop), with strong buy signals requiring additional trend, momentum, and volume confirmation.
*Sell Signal: Triggers when the trend turns bearish (price falls below ATR-based long stop), with strong sell signals needing similar confirmations.
-Ideal for trend-following and breakout strategies, customizable for various markets and timeframes.

MKR/USDT 4h chart ReviewHello everyone, let's look at the 4H MKR chart to USDT, in this situation we can see how the price moves on the created upward trend line. Going further, let's check the places of potential target for the price:
T1 = $ 1576
T2 = 1657 $
Т3 = 1714 $
Let's go to Stop-Loss now in case of further declines on the market:
SL1 = $ 1529
SL2 = $ 1499
SL3 = $ 1450
SL4 = 1372 $
Looking at the RSI indicator, we see
How slight relaxations give space for further increases by living in the upward trend of price.

A confident close but...A confident close in the S&P 500 daily chart on Friday was an indicator that buyers are willing to hold positions through the weekend. But the next challenge will be to carry through of this momentum on Monday starting with the Asia session Sunday night 5 o'clock Chicago time. The upside objective for Monday would be 5750.
