$EUIRYY -Europe CPI (April/2025)ECONOMICS:EUIRYY
April/2025
source: EUROSTAT
- Consumer price inflation in the Euro Area remained steady at 2.2% in April 2025, slightly exceeding market expectations of 2.1% and hovering just above the European Central Bank’s 2.0% target midpoint, according to a preliminary estimate.
A sharper drop in energy prices (-3.5% vs. -1.0% in March) was offset by faster inflation in services (3.9% vs. 3.5%) and food, alcohol, and tobacco (3.0% vs. 2.9%). Prices for non-energy industrial goods rose by 0.6%, unchanged from March.
Meanwhile, core inflation, which excludes food and energy, climbed to 2.7%, up from March’s three-year low of 2.4% and above the forecast of 2.5%.
On a monthly basis, consumer prices increased by 0.6% in April, matching March’s rise.
Fundamental Analysis

Is going as it shouldEverything is going according to plan. We are just waiting for the moment of a sharp upward leap...

Elite Validity Check | EUR/JPY
🔖 Header
Current Price & Spread** | **162.176 / 162.20
| **Timestamp (EST)** | 2025-04-29 01:20 |
| **Risk-Level Tag** | **Medium-High** – trading near yearly highs ahead of key EUR data |
| **Bias Checklist** | HTF trend ✅ | confluence ✅ | fundamentals ⚠️ |
| **Confidence Label** | **Technical High / Event-Risk Medium → Overall High** |
---
### 1️⃣ Technical Outlook
* **Multi-TF Trend (W1/D1/H4)** – **Bullish** (higher highs since Nov-24). Price pressing the 2025 top-of-range. ( [EUR JPY Chart – Euro Yen Rate -
* **Structure & Liquidity** –
* **Support**: 161.60-161.30 (H4 OB + prior swing).
* **Resistance**: 162.80 (Feb-25 high) → next liquidity **163.70-164.00** (2024 peak) (
* **Momentum Scan** – Weekly RSI 68 (near overbought); Daily MACD positive but histogram flattening (momentum pause). (
* **Volume** – Monday’s EU session candle closed 22 % above its 20-day avg tick volume (breakout confirmation).
( [EUR/JPY slips below 163.00 as trade-related uncertainties benefit
---
### 2️⃣ Primary Alert Zones
| Zone | Price | Type | Setup Idea 📝 |
|---|---|---|---|
| **Pullback Demand** | **161.60-161.30** | H4 OB + 50 DMA | M15 bullish engulf + > 20 % vol |
| **Breakout Supply** | **162.80-163.00** | Feb swing-high | Scale-out / watch false-break |
---
### 3️⃣ Indicators Snapshot
| Metric | Value | Read-out |
|---|---|---|
| RSI (H4) | 64 | bullish but near hot zone |
| MACD (D1) | >0, hist ↓ | waning momentum |
| ATR 14 (1 h) | **≈ 21 pips** (7-day avg)
| IG Sentiment | **~62 % short** (contrarian bullish)
---
### 4️⃣ Fundamental & Sentiment Radar
* **Tue 02:00** – German CPI flash (EUR).
* **Tue 05:00** – EZ flash GDP & HICP.
* **Thu Japan** – Tokyo CPI (early BoJ inflation gauge).
* **BoJ Outlook** – Next policy mtg ≙ Jun 13; officials jawboning JPY strength → risk of verbal intervention.
* **COT (22 Apr)** – Funds **net-long EUR / net-short JPY** → structural tail-wind. (

EUR/USD - Channel Breakout (02.05.2025) FX:EURUSD The EUR/USD pair on the M30 timeframe presents a Potential Buying Opportunity due to a recent Formation of a Breakout Pattern. This suggests a shift in momentum towards the upside and a higher likelihood of further advances in the coming hours.
Possible Long Trade:
Entry: Consider Entering A Long Position around Trendline Of The Pattern.
Target Levels:
1st Resistance – 1.1387
2nd Resistance – 1.1430
🎁 Please hit the like button and
🎁 Leave a comment to support for My Post !
Your likes and comments are incredibly motivating and will encourage me to share more analysis with you.
TVC:DXY
Best Regards, KABHI_TA_TRADING
Thank you.


Celestica looking like it could repeat the same pattern shown inCelestica looking like it could repeat the same pattern shown in

Chainlink Market View - on 03/May/2025Price need to retest on FVG1 or FVG2 , before it break OB and visit the Equal High (17$).
#chainlink

This AI-Backed IPO Is Just Warming Up — Next Stop: 86% Gains?CoreWeave is showing classic IPO 'honeymoon phase' price action, with early liquidity swept and bullish structure forming.
🔍 Price swept the daily sell-side liquidity at $35.70
📈 Now pushing higher — next major buyside targets at $55.04 and $65.22
🤖 Backed by NVIDIA, adding serious momentum and credibility
🧠 Expecting strong continuation as institutions begin to build exposure
If price maintains structure, this could be one of the strongest IPO moves of 2025.

MASTERCARD PICKS XRP AS BRIDGE PAYMENT! ⚡ Hey hey, hope all is well, been a few days since our last post, we got a cool development and I figured I'd give a quick update and follow up with things on that note!
⚡ To start off, Mastercard has now taken on and recognized XRP as a bridge currency for international payments making sure to denote XRP's significance as a token which can process expedited and low cost international payments offering a low-cost solution for traditional international payment methods. One of these traditional payment methods notably is the Society for Worldwide Interbank Financial Telecommunication or as it's better known and referred to as: SWIFT.
⚡SWIFT itself is basically a messaging network that helps banks all around the world process international money transfers averaging about 50 million messages a day or close to roughly $5 trillion per day and even including the 250 business days per year, close to $150 trillion a year. So basically we've got Mastercard picking XRP's fast and cheap expeditated transactions and network as a replacement to SWIFT's traditional message system.
⚡ May not seem too significant but considering just how much XRP is doing, it's slowly taking a bite out of the SWIFT system more and more as more companies and business pick XRP as their form of doing digital transactions replacing a system which has long been overdue for a change citing significant intermediary and middleman cost with traditional international payments as oppose to the sleek and efficient system that Ripple has created and is working towards on a daily basis.
🔥 So yeah, this is a great development for us, it's another step in the right direction and another step towards the Future and change that the company Ripple is seeking to bring about no doubt. Below I'll add a reference link to the Mastercard document which mentions XRP as a bridge currency as well as an article that speaks more on the subject for anyone who would like to check that out.
x.com
www.livebitcoinnews.com
🔥 I've you've made it this far, I appreciate it, we'll take a quick look at our TA and wrap things up.
🔥 In our last idea we noted the main thing was just to watch that ascending channel and see if we could keep within it and we indeed have, we did have a 200 EMA crossover on the 3 hour but bulls managed to pull back up and into the channel so we're definitely in some wavy waters here. We're really testing that channel support as bears try to break it but bulls keep firm. Main thing right now is to watch if we can keep within the channel and potentially make another leg up to $2.4 and break $2.3 which is proving to be a strong horizontal resistance level.
🔥 So basically watch the ascending channel and the horizontal channel, if we do fall out of the ascending channel, next up will be the horizontal channel for a test of support so keep noted with that. Technical aside though we still do have the chance of the SEC approving an XRP Spot ETF soon which if done soon, would more than likely have us seeing a significant breakout and shift in sentiment on behalf of retail and institutional investors so definitely keep your eyes peeled.
🔥 I've got to run but I appreciate the time and and support as always, you already know I'm more than happy to keep you guys updated with me as we continue on with this long but well worth journey. Thanks so much as always and till next, keep posted and have a great day!
Best regards,
~Rock'

BTCUSDT 4H – Correction Before Breakout | Targeting $98KI'm seeing a potential bullish continuation pattern forming on the BTC/USDT 4H chart. After a strong upward trend, price is currently in a consolidation zone with a likely correction toward the $95,600–$96,000 area, which aligns with both pivot support and the rising trendline.
Key points from my analysis:
Support zone: $95,600–$96,000 (confluence of pivot point and ascending trendline)
Resistance targets:
R1: $97,272
R2: $98,050
R3: $99,308
Momentum: Stochastic RSI near overbought → suggests short-term pullback, then potential continuation.
Volume: No major distribution, bullish momentum remains intact.
📈 I expect a minor dip followed by continuation to R2 or R3, provided the $95,600 support holds.
Stop-loss idea: Below $94,756 (S1)
Take-profit zones: Partial at GETTEX:98K , rest near $99.3K
------------ManOf87_Pro Indicator--------------------
A powerful trading tool combining ATR-based trend detection, Fibonacci pivots, Fair Value Gaps (FVG), engulfing patterns, and multi-factor confirmations (MA, RSI, Bollinger Bands, volume, Z-Score, ROC).
*Buy Signal: Triggers when the trend shifts bullish (price exceeds ATR-based short stop), with strong buy signals requiring additional trend, momentum, and volume confirmation.
*Sell Signal: Triggers when the trend turns bearish (price falls below ATR-based long stop), with strong sell signals needing similar confirmations.
-Ideal for trend-following and breakout strategies, customizable for various markets and timeframes.

MKR/USDT 4h chart ReviewHello everyone, let's look at the 4H MKR chart to USDT, in this situation we can see how the price moves on the created upward trend line. Going further, let's check the places of potential target for the price:
T1 = $ 1576
T2 = 1657 $
Т3 = 1714 $
Let's go to Stop-Loss now in case of further declines on the market:
SL1 = $ 1529
SL2 = $ 1499
SL3 = $ 1450
SL4 = 1372 $
Looking at the RSI indicator, we see
How slight relaxations give space for further increases by living in the upward trend of price.

A confident close but...A confident close in the S&P 500 daily chart on Friday was an indicator that buyers are willing to hold positions through the weekend. But the next challenge will be to carry through of this momentum on Monday starting with the Asia session Sunday night 5 o'clock Chicago time. The upside objective for Monday would be 5750.

Trend Reversal With Low Demand Natural Gas Outlook: Bearish signals dominate NATGAS with a Head & Shoulders pattern, Shooting Star, and Bearish Engulfing on the chart.
Technical Indicators: RSI is declining, and MACD shows bearish momentum, supporting further downside.
Weather Impact: The UK forecast for the next two weeks shows mixed conditions—initial sunshine but turning unsettled with rain and wind.
Heating Demand: Temperatures will range between 2°C and 13°C, potentially affecting natural gas consumption.
March 28-31: Breezy conditions with low clouds and occasional showers, possibly moderating demand.
Market Reaction: UK NATGAS price projections show stability around 58.2 on March 28 and 57.7 on March 31.
Key Resistance & Support: Watch $4.00 resistance and $3.60 support for potential breakouts.
Bearish Confirmation: If price closes below $3.80, further downside towards $3.50 could be expected.
Fundamental Factors: Geopolitics and supply dynamics still play a major role in volatility.
Risk Management: Monitor weather updates and gas storage reports for potential reversals.
Short-Term Traders: Bearish entries could target $3.60 with tight stop losses above $4.00.
Long-Term Investors: May look for buying opportunities near strong support zones.
Caution: Unexpected cold snaps or supply disruptions could invalidate bearish scenarios.
Stay Updated: Keep track of weather forecasts and fundamental changes impacting demand/supply.
Not Financial Advice: Do your own research before trading.

NASDAQ Bullish Breakout Above Channel;📈 Technical Analysis Overview
1. Breakout from Downtrend Channel
The price has clearly broken out of a descending channel, confirmed by a clean breakout above the upper trendline.
This is a bullish signal, indicating the end of the prior downtrend and the start of a possible uptrend or reversal.
2. Moving Averages (EMA 50 & EMA 200)
EMA 50 (Red): 18,965
EMA 200 (Blue): 19,409
Price is currently trading above both EMAs, which is another strong bullish indicator.
A bullish crossover (where EMA 50 crosses above EMA 200) is likely imminent if upward momentum continues—this would form a Golden Cross, further confirming bullish sentiment.
3. Structure and Market Behavior
After the breakout, price retested the breakout zone and showed a bounce, forming a higher low, which is characteristic of a bullish structure.
The chart includes projected price action with higher highs and higher lows—suggesting a bullish continuation pattern.
4. Volume & Momentum (Not shown but implied)
Breakouts are typically validated by volume. Although volume is not shown, the sharp upward movement and breakout above resistance suggest strong buying pressure.
🔍 Key Levels to Watch
Resistance: 20,000 psychological level; above that, 20,500–21,000 may act as resistance.
Support: 19,400 (near EMA 200), and 18,965 (EMA 50); a break below may invalidate the bullish setup.
📊 Conclusion
The chart shows a clear breakout from a descending channel, supported by the price moving above both key EMAs. The structure favors bullish continuation, especially if price holds above the 19,400–19,500 support zone. Upside targets lie around 20,500 to 21,000.

Bearish Rejection at Resistance – Potential Drop Incoming🔍 Chart Analysis Summary
1. Key Zones
Resistance Zone: ~$3,340 – $3,360
Price has been rejected multiple times from this area, showing strong selling pressure.
Support Zone: ~$3,200 – $3,240
Strong historical support level, previously held during a pullback after the last rally.
2. Moving Averages
EMA 50 (Red): Currently at ~$3,340
Price is fluctuating around it, indicating short-term indecision or a possible retest.
EMA 200 (Blue): Currently at ~$3,300
Acting as a mid-term support level. Price previously bounced from this region.
3. Pattern and Price Action
Fakeout Potential:
The chart suggests a possible false breakout above the resistance followed by a sharp drop—highlighted by the arrow. This is a common bull trap setup.
Bearish Outlook Indicated:
The projected path suggests a rejection from resistance and a drop to the support zone (~$3,200). This would create a lower high, a bearish sign.
4. Trading Bias
Bearish Setup if:
Price fails to hold above $3,340 (EMA50).
Price gets rejected from the resistance zone and breaks below $3,300 (EMA200).
Bullish Invalidated if:
Price closes convincingly above the $3,360 resistance with volume, flipping it into support.
📉 Potential Trade Idea
Short Entry: Around $3,350–$3,355
Stop Loss: Above $3,365 (above resistance zone)
Target: $3,220–$3,230 (support zone)

Bearish Reversal Setup: Resistance Rejection Targeting Key Chart Overview:
Asset: Unspecified (likely XAU/USD or an index based on price levels)
Indicators:
EMA 50 (red) — currently around 3,306.84
EMA 200 (blue) — currently around 3,300.54
Key Zones:
Resistance Zone: ~3,320 to 3,360
Support Zone: ~3,190 to 3,240
Technical Analysis:
Trend Context:
The asset previously had a strong bullish run, peaking above 3,400.
After the peak, it shifted into a lower high structure, indicating potential distribution.
Price is currently fluctuating below the resistance zone but above the support zone, suggesting range-bound conditions.
Moving Averages (EMA Analysis):
The 50 EMA is currently below the 200 EMA, signaling short-term bearish pressure.
Price is hovering around these EMAs, suggesting indecision and the possibility of a breakout or breakdown.
Resistance Behavior:
Price is projected to retest the resistance zone (~3,340–3,360) before a major drop.
The resistance zone has already acted as a strong supply area multiple times, reinforcing its significance.
Support Expectation:
After rejection from the resistance zone, price is expected to decline sharply toward the support zone (~3,200).
The drawn arrows suggest an expectation of a rapid sell-off after the final fake-out at resistance.
Structure and Price Action:
The forecasted scenario shows a liquidity grab above resistance (fake breakout) followed by a strong bearish reversal.
This is typical in a "distribution phase" where market makers induce breakout traders before reversing the move.
Summary:
Primary Bias: Bearish
Setup: Short from resistance rejection after liquidity sweep.
Target: Support zone around 3,200.
Invalidation: A clean breakout and retest above the resistance zone (~3,360) would invalidate the bearish idea.
Risk Management: Ensure proper stop loss above resistance to mitigate risk in case of a genuine breakout.

BTCUSD Analysis Today: Technical and On-Chain !In this video, I will share my BTCUSD analysis by providing my complete technical and on-chain insights, so you can watch it to improve your crypto trading skillset. The video is structured in 4 parts, first I will be performing my complete technical analysis, then I will be moving to the on-chain data analysis, then I will be moving to the liquidation maps analysis and lastly, I will be putting together these 3 different types of analysis.

USDCHF Analysis Today: Technical and Order Flow Analysis !In this video I will be sharing my USDCHF analysis today, by providing my complete technical and order flow analysis, so you can watch it to possibly improve your forex trading skillset. The video is structured in 3 parts, first I will be performing my complete technical analysis, then I will be moving to the COT data analysis, so how the big payers in market are moving their orders, and to do this I will be using my customized proprietary software and then I will be putting together these two different types of analysis.

CAD/JPY at Key Decision Zone: Breakout or Rejection?🕵️♂️ Chart Overview:
Instrument: CAD/JPY
Chart Type: Candlestick
Time Frame: Appears to be intraday (possibly 1H or 4H)
EMAs Used:
50 EMA (Red): 102.814
200 EMA (Blue): 102.710
📊 Key Zones Identified:
1. Immediate Zone (103.30 - 103.50)
Marked as: “Resistance + Support”
This is a key decision zone. Price has tested this region multiple times, showing it holds dual roles — a flip zone.
Price is currently testing this zone again. A break and retest above could confirm bullish momentum.
2. Upper Resistance Zone (104.80 - 105.50)
A broader supply area where previous strong selling pressure occurred.
This is the next logical target if price breaks and holds above 103.50.
3. Lower Support (101.29)
Strong horizontal support, clearly defined from previous lows.
If the price fails to break above the current zone, a rejection could lead to a move back down toward this support.
📈 Bullish Scenario:
Break above 103.50, with a successful retest confirming new support.
Momentum could carry price toward the 105.00–105.50 resistance.
Supported by 50 EMA crossing above 200 EMA (early sign of bullish crossover — Golden Cross).
📉 Bearish Scenario:
Rejection from the 103.30–103.50 zone could signal continuation of range-bound or bearish pressure.
Break below 102.00, followed by momentum towards 101.29 key support.
Would invalidate short-term bullish structure.
📌 Additional Technical Notes:
The chart shows consolidation between 102.00 and 103.50 — likely accumulation or re-accumulation phase.
EMAs are tightening, indicating a potential volatility expansion move is near.
Volume is not visible but would be useful to confirm breakout strength.
📍Conclusion:
CAD/JPY is currently at a critical decision zone. The next few candles will be key. Monitor:
Breakout direction
Retest confirmations
Momentum and volume indicators (if available)

Bitcoin - All time highs will come next!Bitcoin - CRYPTO:BTCUSD - prepares a significant move:
(click chart above to see the in depth analysis👆🏻)
Over the past couple of months, we basically only saw sideways price action on Bitcoin. However, this does not mean, that Bitcoin is now slowing down; actually the opposite is true and Bitcoin is setting up for a major move higher. New all time highs will come very soon.
Levels to watch: $100.000
Keep your long term vision!
Philip (BasicTrading)

ORAS Stock Fundamental AnalysisORAS trend was neutral between the support line 266.851 and the resistance line 291.935, the trend was down by 0.14%. The stock rose, and broke the first support line to reach the second support line 267.905, then the third support line 268.432. It's expected to keep rising till reaching the resistance line 290.144, then 290.671, because of the CBE's decision about cutting the interest rate by 2.25% which will have a positive impact on corporates because according to the current reasons behind the economic activity decreasing interest rate will lead to decreasing the cost of borrowing which will decrease the cost of production and will increase the corporates' profit and their monetary value. On the other side, this will decrease the products' price and individuals will have a higher will to diversify their investment beside increasing their purchasing power as well.

GOLD → Correction before NFP. What are the chances of a decline?FX:XAUUSD strengthens amid dollar correction. The market is correcting ahead of NonFarm Payrolls, trying to accumulate potential before high volatility.
Gold recovers ahead of US employment report
On Friday, gold rebounded from a two-week low, recouping some of its losses ahead of the release of US labor market data (NFP), which could set the tone for prices going forward. Amid optimism over trade talks and a strong dollar, gold ended its worst week in two months, but geopolitical tensions and a potentially weak jobs report could boost demand for safe-haven assets again.
The correction in the dollar gives gold a small chance to strengthen. However, fundamentally, the overall trend has already set the tone and gold may continue to fall.
Resistance levels: 3268, 3285, 3295
Support levels: 3227, 3204
The correction may reach a local zone of interest (money pool) — liquidity above 3270, or the 0.7 Fibonacci zone, after which the price may continue its course along the new trend — down to 3193.
However, unpredictable and unexpected data could disrupt the structure and push the price up to 3320-3350.
Best regards, R. Linda!

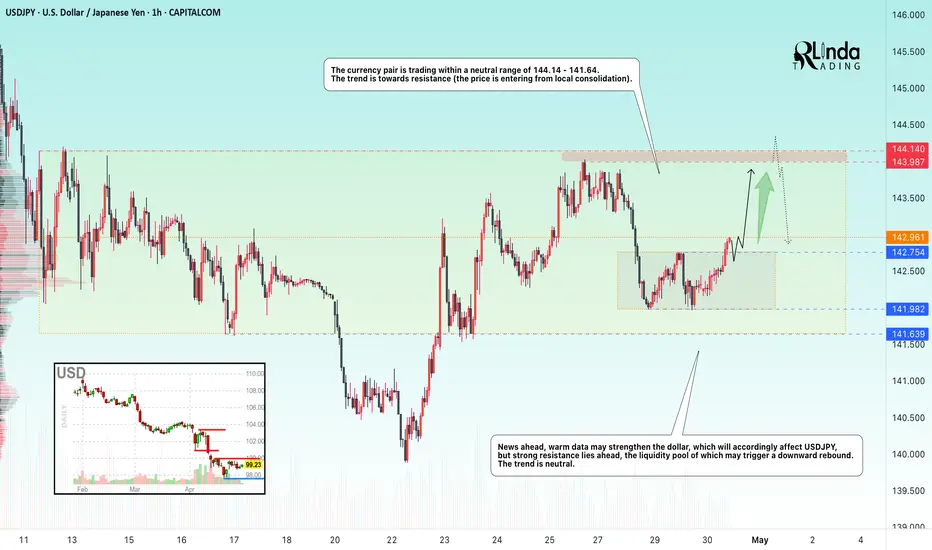
USDJPY → Price in range, retest of resistanceFX:USDJPY is emerging from local consolidation in hopes of seeing economic data that could support the dollar. The target for this movement could be the liquidity zone at 144.00.
The currency pair is trading within a neutral range of 144.14 - 141.64. However, a local consolidation has formed within the range, from which the price has broken out. The main task for the bulls is to hold the defense above 142.75, in which case we will be able to catch the price distribution to the upper border of the global range of 144.14.
News ahead, positive data may strengthen the dollar, which will accordingly affect USDJPY, but there is strong resistance at 144.14, whose liquidity pool may trigger a downward rebound. The trend is neutral.
Resistance levels: 143.9, 144.14
Support levels: 142.75, 141.98
There are no reasons to exit the global range. Over the past two weeks, this will be the first retest of the 144.14 zone, which in general only increases the chances of a false breakout and correction.
Best regards, R. Linda!