Morningstar Candlestick Pattern Forming at the monthly PivotThis 3 candle pattern is a good indicator that a bullish reversal is underway. Price was driven lower on day 1. On day 2 price was initially driven lower but buyers stepped in to take control. And they took control at the monthly pivot which adds even more significance to the move. Finally, on day 3 price moved up which means buyers are in control and bears are losing control. This is likely headline driven and economic outlook driven but the momentum shift at the monthly pivot is an important point to note.
Fundamental Analysis

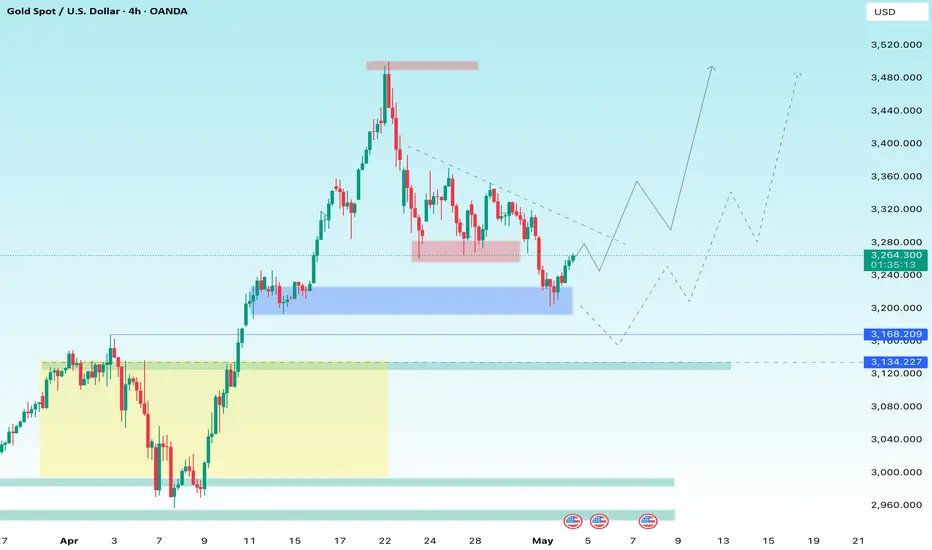
“Gold Poised for a Big Move Ahead of NFP – Reversal or BreakdownGold (XAU/USD) is approaching a major decision zone just before the highly anticipated NFP release. Price is reacting from a strong demand area (3,240–3,200), hinting at potential upside if momentum builds. A break above the descending trendline could fuel a rally toward 3,320 and 3,480.
However, a negative reaction to NFP might push gold down to test the deeper 3,168–3,134 support zone before bouncing.
This setup aligns perfectly with high-impact news – Follow for live updates and smart trade ideas during NFP!
NQ: NFP day!Good day!
Yesterday candle was bearish, Is it the end of the upper move?
All will depend on today's data and rumors from WH.
1- Undershoot data: Very bad for equities and NQ starts its Wave 3. But keep in mind, an undershoot also means FED will cut and free money will be on the table which is positive equities.
2- Inline: Bad for equities as FED rate cut and free money chances will decrease. In this case, price might continue its consolidation.
3- Overshoot: Good for equities and NQ might reach 21000. In this scenario, Fed rate cut will be out from June meeting.
Regarding WH rumors, it seems tariffs deals are imminent or underway. I already mentioned here few times that the 90-day pause will become an eternity pause. This seems a major change. But in my view it won't be a sustainable or durable change as all countries lost confidence in US.
Until the rumor becomes a fact, I maintain the same plan for ST/MT/LT: Sell.
GL!

"Gold Ain’t Done Yet – Snipers Don’t Sleep, They Wait After a clean CHoCH from 3205 and bullish NY session push, Gold is currently hovering around 3239 ahead of major macro catalysts tomorrow (May 2):
💼 News to Watch:
NFP (133K vs. 228K prev)
Unemployment Rate
Average Hourly Earnings All releasing between 15:30–17:00 UTC+2, potentially fueling a volatility storm.
We remain in a broader retracement phase after April highs (ATH 3500), with price still sitting in higher timeframe discount zones and internal bullish signs building. However, supply above is unmitigated and could cap rallies.
🔁 MARKET STRUCTURE
Price is currently at 3239, just above a valid H1–H4 support zone.
Clean CHoCH confirmed from 3205
Liquidity still resting both above 3284 and below 3172
🔽 BUY SCENARIOS (From Discount + Liquidity Areas)
🟢 Buy #1 – 3205–3212
🔹 H1 CHoCH zone + internal FVG
🔹 Sell-side liquidity just swept
🔹 Entry if price retests post-NFP drop
⚠️ Ideal for short-term bounce or reaccumulation into 3260
🟢 Buy #2 – 3172–3185
🔹 H4 OB + sweep zone + EQ
🔹 Heavy stop cluster under 3200
🔹 If broken, becomes invalid → eyes move to 3120
🔸 High-risk/reward reversal zone if NFP panic spikes below
🔼 SELL SCENARIOS (From Premium + Imbalance Zones)
🔴 Sell #1 – 3284–3295
🔹 H1–H4 supply + FVG + internal BOS
🔹 Buy-side liquidity just above 3280
🔹 Classic pre-news pump & dump zone
⚠️ Watch for wicks above 3288 → sniper sell trigger
🔴 Sell #2 – 3325–3333
🔹 HTF OB shelf + imbalance + previous NY rejection
🔹 Final retail breakout trap before larger drop
🔹 Cleanest R:R setup if NFP drives price explosively upward
👀 Eyes On:
Zone Reaction Type What to Watch
3220–3235 Bounce or trap Current zone = fragile intraday demand
3284–3295 Rejection or flip Cleanest NY pump trap zone
3172–3185 Final support Below = invalidates bullish scenario short-term
3325–3333 Bull trap zone If reached = extreme precision sell only
🎯 Bias:
LTF: Bullish retrace valid above 3212
HTF: Still bearish under 3330
Macro: Wait-and-react on NFP → NO prediction
📣 Final Note for GoldMinds:
This is not a prediction plan.
It’s a reaction plan.
We mapped the real zones.
Now let the volatility reveal which liquidity gets hit first.
💬 Drop a 🧠 if you’ve evolved past “buy now / sell now” noise.
Let’s hunt like pros — not guess like rookies.

Bullish Harami/ Hammer -Unconfirmed Candlestick PatternThis candlestick pattern lacks confirmation but suggest a bottom may be forming for crude oil. This is likely fully driven by the state of the economy and trade. Any positive news around the economy, geo politics, trade, etc. will likely result in confirmation with a bullish candle and prices could go higher.

Long Term H&S Pattern with a Completed Intermediate H&S PatternHead and Shoulder pattern are one of the most reliable patterns. And when you think about the psychology behind them it makes sense why. Essentially natural gas pricing in the long run is driven by fundamentals but speculators who trade solely on technical analysis add gasoline to the fire to cause massive price dislocations. The H&S pattern is an example of this. Fundamentals drive the price up. Speculators participate forming the left shoulder. Profit taking ensues completing the left shoulder. Speculators then tap the well again to form the head. At this point fundamental traders(hedgers like large commercials) can’t pass up the massive price dislocations and lock in large profits for future deliveries. Speculators panic and close longs once they lose control. Right shoulder is forming. Speculators will try to tap the well again thinking they can control the large commercials. Large commercials allow them to be right for a short period so they can sell even more future deliveries. In the end the commercials win out and price goes lower. Neckline complete. Speculators panic and massive selling ensues. The expected move to complete the pattern would be the distance from the head to the neckline in terms of percentage. So a $5 head and $3 neckline means a 40% target lower from the $3 neckline. $1.80 seems like a lofty price target. Price targets are suggestions in patterns. They are not absolutes.
These patterns fail as well so while this pattern is forming technically, it is not complete. In my experience, anticipating patterns has a 100% failure rate.

Has Gold's Rally Ended?In 2025, gold experienced an unprecedented surge, marking its best quarterly performance in history with gains exceeding 17% in Q1. The second quarter of 2025 began with further gains, reaching a new all-time high at $3,500.110 per ounce.
Several economic and political factors contributed to the rise in global demand for gold as a safe haven asset amid fears of a potential economic recession, inflation, and a looming trade war.
The recent pullback in gold prices has been somewhat driven by optimistic expectations regarding U.S.-China negotiations and the U.S. president's decision to reduce some tariffs, including those on automobiles.
Technical Outlook for Gold:
The latest declines in gold prices have brought some bearish signals, suggesting a shift from an uptrend to a downtrend. After rising approximately 14%, gold pulled back and broke below its most recent higher low, closing a daily candle below the $3,260.65 level, an indication of a potential trend reversal from bullish to bearish.
However, the Relative Strength Index (RSI) has not yet broken below the 50 mark, despite the recent price drop, which maintains the possibility for a rebound and suggests that the market hasn't entered full bearish momentum.
The $3,436.042 level serves as a key resistance area where selling pressure may emerge, potentially pushing prices down to target $3,265.100 as the first support level.
On the other hand, if the price breaks above $3,500.110 and posts a daily close above it, the bearish scenario would be invalidated.
From a fundamental perspective, gold’s continued decline is closely tied to developments in U.S.-China trade talks. Any positive signs of reaching an agreement or further tariff reductions could weigh negatively on gold prices.

[SHORT] BTCUSDT - Binance | BTC Will Correction Continue?Welcome,
- Status: 📉 Short
- BTC in action
- TP & SL On chart
Keep wait..
Lets see..

Gold Analysis: China - U.S Tariffs Talks and NFP ImpactGold Analysis: China - U.S Tariffs Talks and NFP Impact
Earlier today, China's Ministry of Commerce said it signaled a possible easing of tensions in the US-China trade war. Talks are still ongoing and this is creating a softer environment for gold to cool off from its strength.
On the other hand, today we also have the NFP data and, in relation to the data, the market is expected to anticipate a possible rate cut by the FED during the upcoming meeting, as well as new comments regarding their upcoming decisions.
This could be a strong reason why the GOLD continues to lose its bullish momentum.
However, do not forget that it moves up and down in a strange way most of the time. The current situation is bearish and nothing has changed so far. Even if the NFP data will be in line or less than expectations, I do not think that GOLD should rise for this reason. This is gold, it moves when you least expect it to happen
You may find more details in the chart!
Thank you and Good Luck!
❤️PS: Please support with a like or comment if you find this analysis useful for your trading day❤️

XAUUSD UPDATE : NFP hi everyone
I hope you were able to ride the market based on the previous trade idea.
Gold has broken below the daily support level, and the current upward movement is likely just a retracement. Therefore, both my Plan A and Plan B focus on short positions. For a stronger bullish move, the price needs to form a lower low—at least on the H1 timeframe.
good luck all
**My trading strategy is not intended to be a signal. It's a process of learning about market structure and sharpening my trading my skills also for my trade journal**
Thanks a lot for your support

WTI TRADE UPDATEhi all
Based on the current situation for WTI, with the stop loss hit from the previous trade idea, Plan A now relies on a breakout of the trendline and the support turning into resistance as confirmation for taking a long position.
However, if rejection occurs at the trendline or at the support-turned-resistance level, there's a possibility that the price will decline again, given that a breakout has already happened on the daily timeframe. Therefore, closely monitoring price movements around these key levels is crucial before making any trading decisions.
Ensure strong confirmation before acting, and keep an eye on shifts in market structure. Feel free to share any new updates, and best of luck with your strategy!
good luck all
**My trading strategy is not intended to be a signal. It's a process of learning about market structure and sharpening my trading my skills also for my trade journal**
Thanks a lot for your support

The Day Ahead - US Employment data due!Friday, May 2
Macro Data to Watch (Market Impact Potential):
US April Jobs Report – Major market mover for USD, equities, and bonds. Sets expectations for Fed policy.
US March Factory Orders – Secondary data; relevant for industrial and manufacturing sectors.
Eurozone April CPI – Key inflation data; potential EUR/USD and ECB rate path influence.
Eurozone March Unemployment Rate – Labor market context for ECB policy.
Japan April Monetary Base & Labor Data – JPY-sensitive; signals BoJ liquidity stance.
Italy Manufacturing PMI & March Unemployment – Insight into Eurozone periphery economy.
France March Budget Balance – Fiscal health check; limited direct market impact.
Central Bank Watch:
ECB Economic Bulletin – Can give insight into ECB’s inflation and growth outlook. May guide EUR direction.
Earnings (Key for Sector Moves & Index Impact):
Energy: Exxon Mobil, Chevron, Shell – Crude oil-sensitive; big impact on energy indices.
Healthcare & Insurance: Cigna Group – Influences healthcare and insurance stocks.
Industrials/Chemicals: Eaton, BASF, DuPont – Watch for global growth signals and margins.
Financials: Apollo, ING, NatWest, Standard Chartered – Useful for readthrough on credit trends and regional banking health.
Autos: Mitsubishi, Italy new car registrations – Auto demand signals, relevant for sector ETFs.
This communication is for informational purposes only and should not be viewed as any form of recommendation as to a particular course of action or as investment advice. It is not intended as an offer or solicitation for the purchase or sale of any financial instrument or as an official confirmation of any transaction. Opinions, estimates and assumptions expressed herein are made as of the date of this communication and are subject to change without notice. This communication has been prepared based upon information, including market prices, data and other information, believed to be reliable; however, Trade Nation does not warrant its completeness or accuracy. All market prices and market data contained in or attached to this communication are indicative and subject to change without notice.

NZDJPY 39-Year Trap – 5149 Pips Short Setup!This chart showcases a massive 39-year consolidation range in NZDJPY, spanning from 1986 to 2025, with no confirmed breakout or breakdown throughout this entire period. The pair remains range-bound, signaling long-term indecision.
Currently, we are preparing for short-side trades based on a key technical clue:
The latest monthly candle wicked above resistance, sweeping liquidity before closing lower — a classic liquidity grab or false breakout setup, indicating a potential reversal within the range.
Trade Plan:
Entry 1: 89.364
Entry 2 (Add more lots if price rises): 93.351
Stop Loss for both entries: 95.967
Our targets remain:
Take Profit 1: 70.220
Take Profit 2: 42.516
This setup is aiming for a 5,149 pip move (~55% drop), aligned with the historical range-bound behavior.

Probably nothing btcBitcoin has not yet recorded a real increase in percentage growth compared to previous cycles, so 2025 seems to be accompanied by surprising movements

Gold Triangle Pattern Breakdown? Bearish Setup in Play (XAU/USD)Gold (XAU/USD) has been trading within a tightening consolidation range over the past several sessions, characterized by lower highs and a horizontal support level. This behavior has resulted in the formation of a descending triangle, which is commonly interpreted as a bearish continuation pattern—especially when occurring in a downtrend.
Following a failed attempt to sustain above the $3,400 level, price action has steadily weakened, showing signs of bearish pressure. Recent structure breakdown below the triangle’s lower boundary suggests that the bulls are losing control, opening the door for a potential leg down.
🔍 Technical Structure Breakdown
📐 Triangle Pattern
Formation Type: Descending Triangle
Support Level: ~$3,245
Lower Highs Resistance: Downward sloping line, showing consistent bearish pressure.
Breakdown Confirmation : Clear move below triangle support, followed by a retest and rejection, confirming bearish momentum.
🔄 Key Support & Resistance
Resistance Zone: $3,300–$3,340
This area has acted as a supply zone, where sellers continue to overpower buying attempts. The price has failed multiple times to break above this region, creating a solid resistance cap.
Support Level (Previous Base of Triangle): $3,245
Price repeatedly bounced off this level before the final breakdown, making it a significant level for validation of the pattern.
Next Key Support/Target: $3,155
The projected move is derived by measuring the height of the triangle and subtracting it from the breakout point. This target also aligns with a previous demand zone, increasing its relevance.
➰ Black Curve Line (Dynamic Resistance)
This curved resistance line adds further technical weight to the downtrend. It’s a visual cue of how momentum is progressively shifting downward. The curve reflects a deceleration in bullish effort, a warning signal often preceding breakdowns.
⚙️ Trade Plan: Bearish Bias
Component Level
Entry Zone $3,265–$3,270 (retest of breakdown)
Stop Loss $3,317 (above triangle and curve line)
Take Profit $3,155
Risk-Reward Ratio : ~2.5:1 (based on entry near $3,270, SL $3,317, TP $3,155)
Setup Type : Breakdown + Retest (high-probability pattern continuation setup)
⚠️ Risk Management & Confirmation Factors
Confirmation Needed: A clean hourly candle close below the support zone, followed by rejection wicks on retest, strengthens the case for short entries.
Invalidation : A strong bullish break above $3,317 (stop level) invalidates this setup and could signal a reversal or false breakdown.
Volatility Note : Be mindful of macroeconomic events or FOMC-related headlines that may trigger increased volatility in precious metals.
📊 Conclusion & Trader Sentiment
The descending triangle in gold is a textbook example of consolidation under pressure. With sellers continuously pushing price into lower highs while buyers cling to horizontal support, the eventual outcome often favors the dominant trend—which in this case is bearish.
The current structure offers a clean technical setup for short traders with well-defined risk levels and a logical downside target. As always, ensure strict adherence to risk management principles and stay aware of market news that could impact gold volatility.
📌 Tag Ideas:
#XAUUSD #GoldAnalysis #TrianglePattern #BreakdownSetup #TechnicalAnalysis #PriceAction #BearishTrade #MetalsTrading #ShortSetup #ForexIdeas

GBPCHF BEARISH I believe this is a solid setup for a short with all the confluences aligned in the picture and fundamental pressures include potential GBP weakness from soft UK data, dovish BoE signals and CHF strength from safe haven flows or SNB hawkishness
TRADE SMART BE KIND AND STAY STRONG

SoFi Technologies (SOFI, 1D)On the daily chart, SoFi has broken out of its descending trendline, confirmed the breakout with a clean retest of the 0.618 Fibonacci retracement level at $12.33, and is now building upward momentum from this demand zone. This “buy zone” is acting as a launchpad for a potential mid-term move toward higher resistance levels.
Key Fibonacci-based upside targets:
– $13.48 (0.5 retracement)
– $14.64 (0.382 retracement)
– $16.07 (0.236 retracement) — within the defined target zone
– Extended target: $18.37 (1.0 Fibonacci projection)
Technical structure highlights:
– Breakout of multi-month downtrend + successful retest
– Price now trading above key EMAs (50/100/200)
– Volume expansion on bullish candles confirms demand
– Daily momentum favors further continuation toward the $14–$16 zone
– Premium supply zone above $16 may slow initial momentum but offers long-term potential toward $18+
Fundamental context:
SoFi is evolving as a vertically integrated fintech platform with strong brand recognition and growing user engagement across banking, investing, and lending services. As the company narrows losses and strengthens recurring revenue, investor interest in SOFI is growing — particularly as market appetite returns for high-quality fintech with path-to-profitability models.
The technical breakout is confirmed. As long as price remains above the $12.33–$12.50 buy zone, the bullish scenario remains valid with targets toward $14.64 and $16.07. A breakout above $16 would activate the full expansion toward $18.37 in the mid-term.

When will altseaon start?#Altseaon2025
• BTC dominance: 64.86%, Strong Bitcoin focus.
• Altcoin market cap: $820.93B
• Altseason will start once BTC dominance clearly reverses below 60% and altcoins break out above $900B resistance.
As long as BTC dominance is above 60%, prefer investing in Bitcoin.

Filecoin 1d — Structure-led AccumulationPrice is stabilizing above the 50EMA.
MACD is base-lining with bullish divergence.
Volume compression followed by range reclaim.
Bull Load: 100%
This isn’t noise — it’s signal.
Trend structure is aligning with fundamentals post-F3.
Quants don’t chase candles.
We position early — and let time do the compounding.
#FIL #QuantEdge #Filecoin #FastFinality #DePIN #MarketStructure #ExecutionReady

This stock has strong pumpomentalsJust bought couple shares of $DJT. Think its gonna moon, because a lot of traders do love President Trump. They said description is too short, but idk how come its short if I going to Long this stock. I think those who short sell NASDAQ:DJT will regret eventually. Cuz it's definitely gonna moon and rip all short sellers apart

Usd/Jpy 02-May-2025 AnalysisDisclaimer: easyMarkets Account on TradingView allows you to combine easyMarkets industry leading conditions, regulated trading and tight fixed spreads with TradingView's powerful social network for traders, advanced charting and analytics. Access no slippage on limit orders, tight fixed spreads, negative balance protection, no hidden fees or commission, and seamless integration.
Any opinions, news, research, analyses, prices, other information, or links to third-party sites contained on this website are provided on an "as-is" basis, are intended only to be informative, is not an advice nor a recommendation, nor research, or a record of our trading prices, or an offer of, or solicitation for a transaction in any financial instrument and thus should not be treated as such. The information provided does not involve any specific investment objectives, financial situation and needs of any specific person who may receive it. Please be aware, that past performance is not a reliable indicator of future performance and/or results. Past Performance or Forward-looking scenarios based upon the reasonable beliefs of the third-party provider are not a guarantee of future performance. Actual results may differ materially from those anticipated in forward-looking or past performance statements. easyMarkets makes no representation or warranty and assumes no liability as to the accuracy or completeness of the information provided, nor any loss arising from any investment based on a recommendation, forecast or any information supplied by any third-party.

NF shows a volatile downward trend
📌 Gold Information
China's Ministry of Commerce announced on Friday that the United States has recently initiated communication through official channels, expressing interest in restarting tariff negotiations. Beijing is currently evaluating the proposal, which has sparked optimism that a solution to the long-standing tariff deadlock between the world's two largest economies is imminent.
New hopes for a breakthrough in trade negotiations helped the dollar rise to a three-week high on Thursday, pushing gold prices down towards the $3,200 mark. However, the dollar's bullish momentum remains weakened as the market increasingly digests expectations that the Federal Reserve may cut interest rates further, especially with the closely watched US non-farm payrolls data about to be released.
📊Comment Analysis
NF news volatility is certain, having accumulated significantly since last week. Gold price confirmed the trend after breaking through 3267, and fluctuated downward below 3200
💰Strategy Package
TP1: $3290
TP2: $3280
TP3: $3270🔥
Buy gold area: $3175 - $3177 SL $3170
TP1: $3185
TP2: $3200
TP3: $3210⭐️
⭐️ Note: Labaron hopes that traders can properly manage their funds
- Choose the number of lots that matches your funds
- Profit is 4-7% of the fund account
- Stop loss is 1-3% of the fund account

USDCAD Analysis: Buyers Defend Key Level Ahead of NFP DataUSDCAD Analysis: Buyers Defend Key Level Ahead of NFP Data
Since April 20, USDCAD has been moving sideways without a clear trend. However, in recent days, the pair has found strong support around 1.3780 for the second time, suggesting that buyers are actively defending this zone.
With the upcoming NFP data, there's potential for a bullish move. If the report fuels buying momentum, USDCAD could rise toward the resistance levels at 1.3855 and 1.3890, as seen on the chart.
You may find more details in the chart!
Thank you and Good Luck!
❤️PS: Please support with a like or comment if you find this analysis useful for your trading day❤️
Disclosure: I am part of Trade Nation's Influencer program and receive a monthly fee for using their TradingView charts in my analysis.
